thumbnail

For 40 years, U.S. wheat farmers have supported U.S. Wheat Associates’ (USW) efforts to work directly with buyers and promote their six classes of wheat. Their contributions to state wheat commissions, who in turn contribute a portion of those funds to USW, qualifies USW to apply for export market development funds managed by USDA’s Foreign Agricultural Service. Currently, 17 state wheat commissions are USW members and this series highlights those partnerships and the work being done state-by-state to provide unmatched service. Behind the world’s most reliable supply of wheat are the world’s most dependable people – and that includes our state wheat commissions.


Member: Arizona Grain Research and Promotion Council
USW Member since 1987

Location: Phoenix, Ariz.
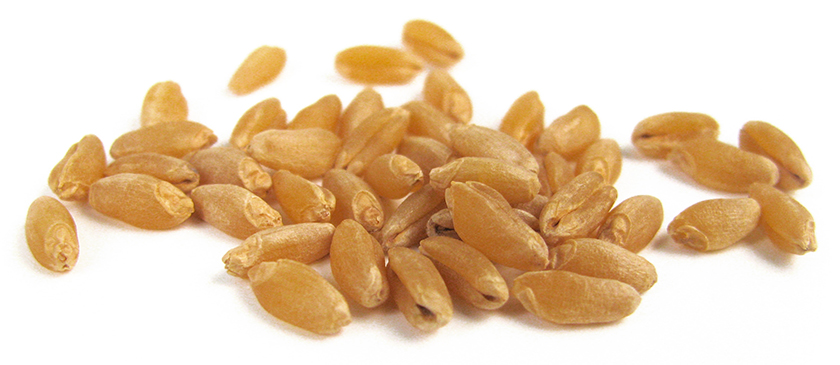
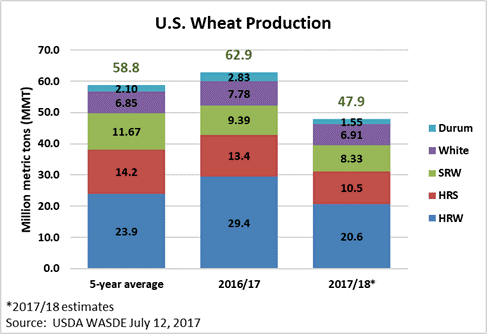
Classes of Wheat Grown: Durum
USW Leadership: Michael Edgar, 2008/09 Chairman

The Arizona Grain Research and Promotion Council utilizes grower check-off funds to aid in marketing for wheat and barley, to participate in research projects and other programs to assist in reducing freshwater consumption, to develop new grain varieties and to improve grain production, harvesting and handling methods. The Council is made up of seven Arizona grain producers appointed by the Governor.

Arizona farmers were growing durum wheat widely in the decades before 1980. As improved varieties were developed to provide consistently excellent semolina for fine quality pasta, growers identified an opportunity to promote their durum overseas. After the AGRPC was authorized by the state legislature in 1985, representatives attended a U.S. Wheat Associates (USW) meeting in 1986 and joined USW in January 1987.

Today, Arizona growers work with USW to promote Desert Durum®, an identity protected by a legal certification mark and owned jointly by the AGRPC and the California Wheat Commission. Desert Durum® is grown only under irrigation in the desert valleys and lowlands of Arizona and California.

Why is export market development important to Arizona wheat farmers and why do they continue to support USW and its activities?

Arizona’s growers are very favorably leveraged by USW’s promotional efforts around the world. Arizona’s growers receive just as much respect from USW and its export promotional programs as do its large wheat-producing members. This has been the case for 33 years and counting.

About half of the annual production of Desert Durum® (Arizona and California combined) has been exported for many years, with Italy as the perennial leading export destination, followed by Nigeria. One reason for Italy’s continued purchase of Desert Durum® is that Italian pasta makers value the consistent semolina quality of Desert Durum® and are willing to pay more for its grain than for durum from other origins.

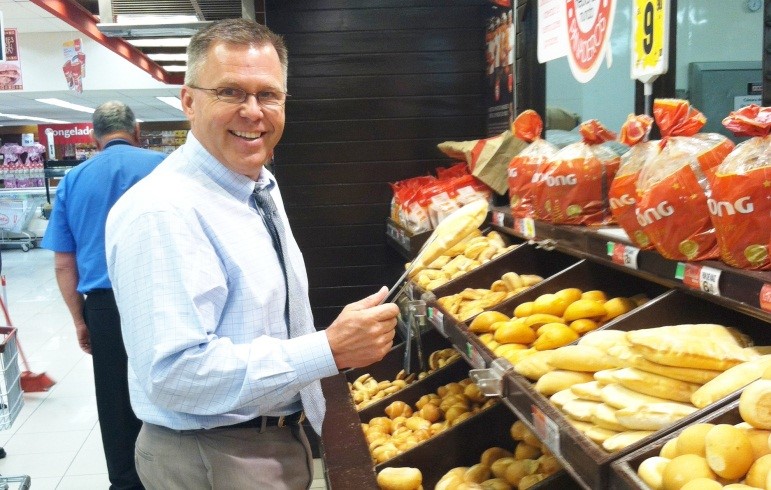
USW assists its members in numerous ways to educate growers and the public about the importance and role of wheat production and export in their states. Some of the means of providing such assistance include arranging board teams of state representatives to visit existing and potential importing countries and organizing trade teams of foreign customer representatives to visit U.S. wheat class production regions. USW members greatly appreciate these opportunities to promote their wheat classes for both export domestic audiences.

USW also publishes annual crop quality reports that characterize both Northern durum and Desert Durum® separately. This distinction allows potential customers to verify the uniform large kernel size, low moisture content, and other grain and processing traits of Desert Durum® that produce very desirable semolina quality.

How have Arizona wheat farmers recently connected with overseas customers?

One member of AGRPC has integrated export market development work through USW into his company’s efforts to provide customers with high quality grains for Identity Preserved markets. Michael Edgar, President of Barkley Seeds, Yuma, Ariz., for more than 30 years has participated in several overseas trade missions organized by USW, including his engagement in a trip to Morocco, Italy and Israel in 2016 to promote Desert Durum® and other U.S. wheat classes. Edgar served as an officer with USW including as its Chair in 2008/09.

AGRPC member Michael Edgar has worked for more than 30 years with USW to promote exports of Desert Durum® and all U.S. wheat classes. Here Edgar (right) accepts the USW Chairman’s gavel in 2008 from outgoing Chairman Ron Suppes, a Kansas Wheat commission member and farmer.

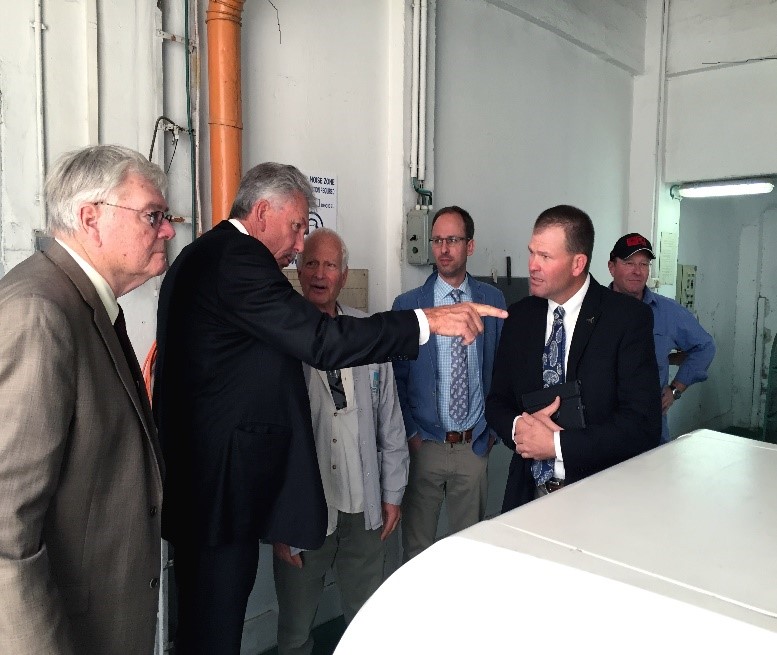
Edgar (second from left) joined other farmer directors of USW on a trade mission to Italy, Morocco and Israel in 2016.

AGRPC member Eric Wilkey has traveled to Latin America with a USW board team, joined by growers from Montana and Oklahoma. He learned that the excellent quality of Desert Durum® is recognized by pasta makers in that region.

Arizona and grower members of AGRPC have also been privileged to entertain numerous USW trade teams from most of the regions that have traveled to the U.S. to learn about the country’s durum producers and their production efforts.

AGRPC member Eric Wilkey joined growers from Montana and Oklahoma on a USW trade team to Latin America.

In 2012, Wilkey described the nature of the Desert Durum® industry to members of Group FORAFRIC, a Moroccan milling firm, who made a self-sponsored visit to Arizona and California, facilitated by USW, to investigate the production and purchase of Desert Durum®.

What is happened lately in Arizona that overseas customers should know about?

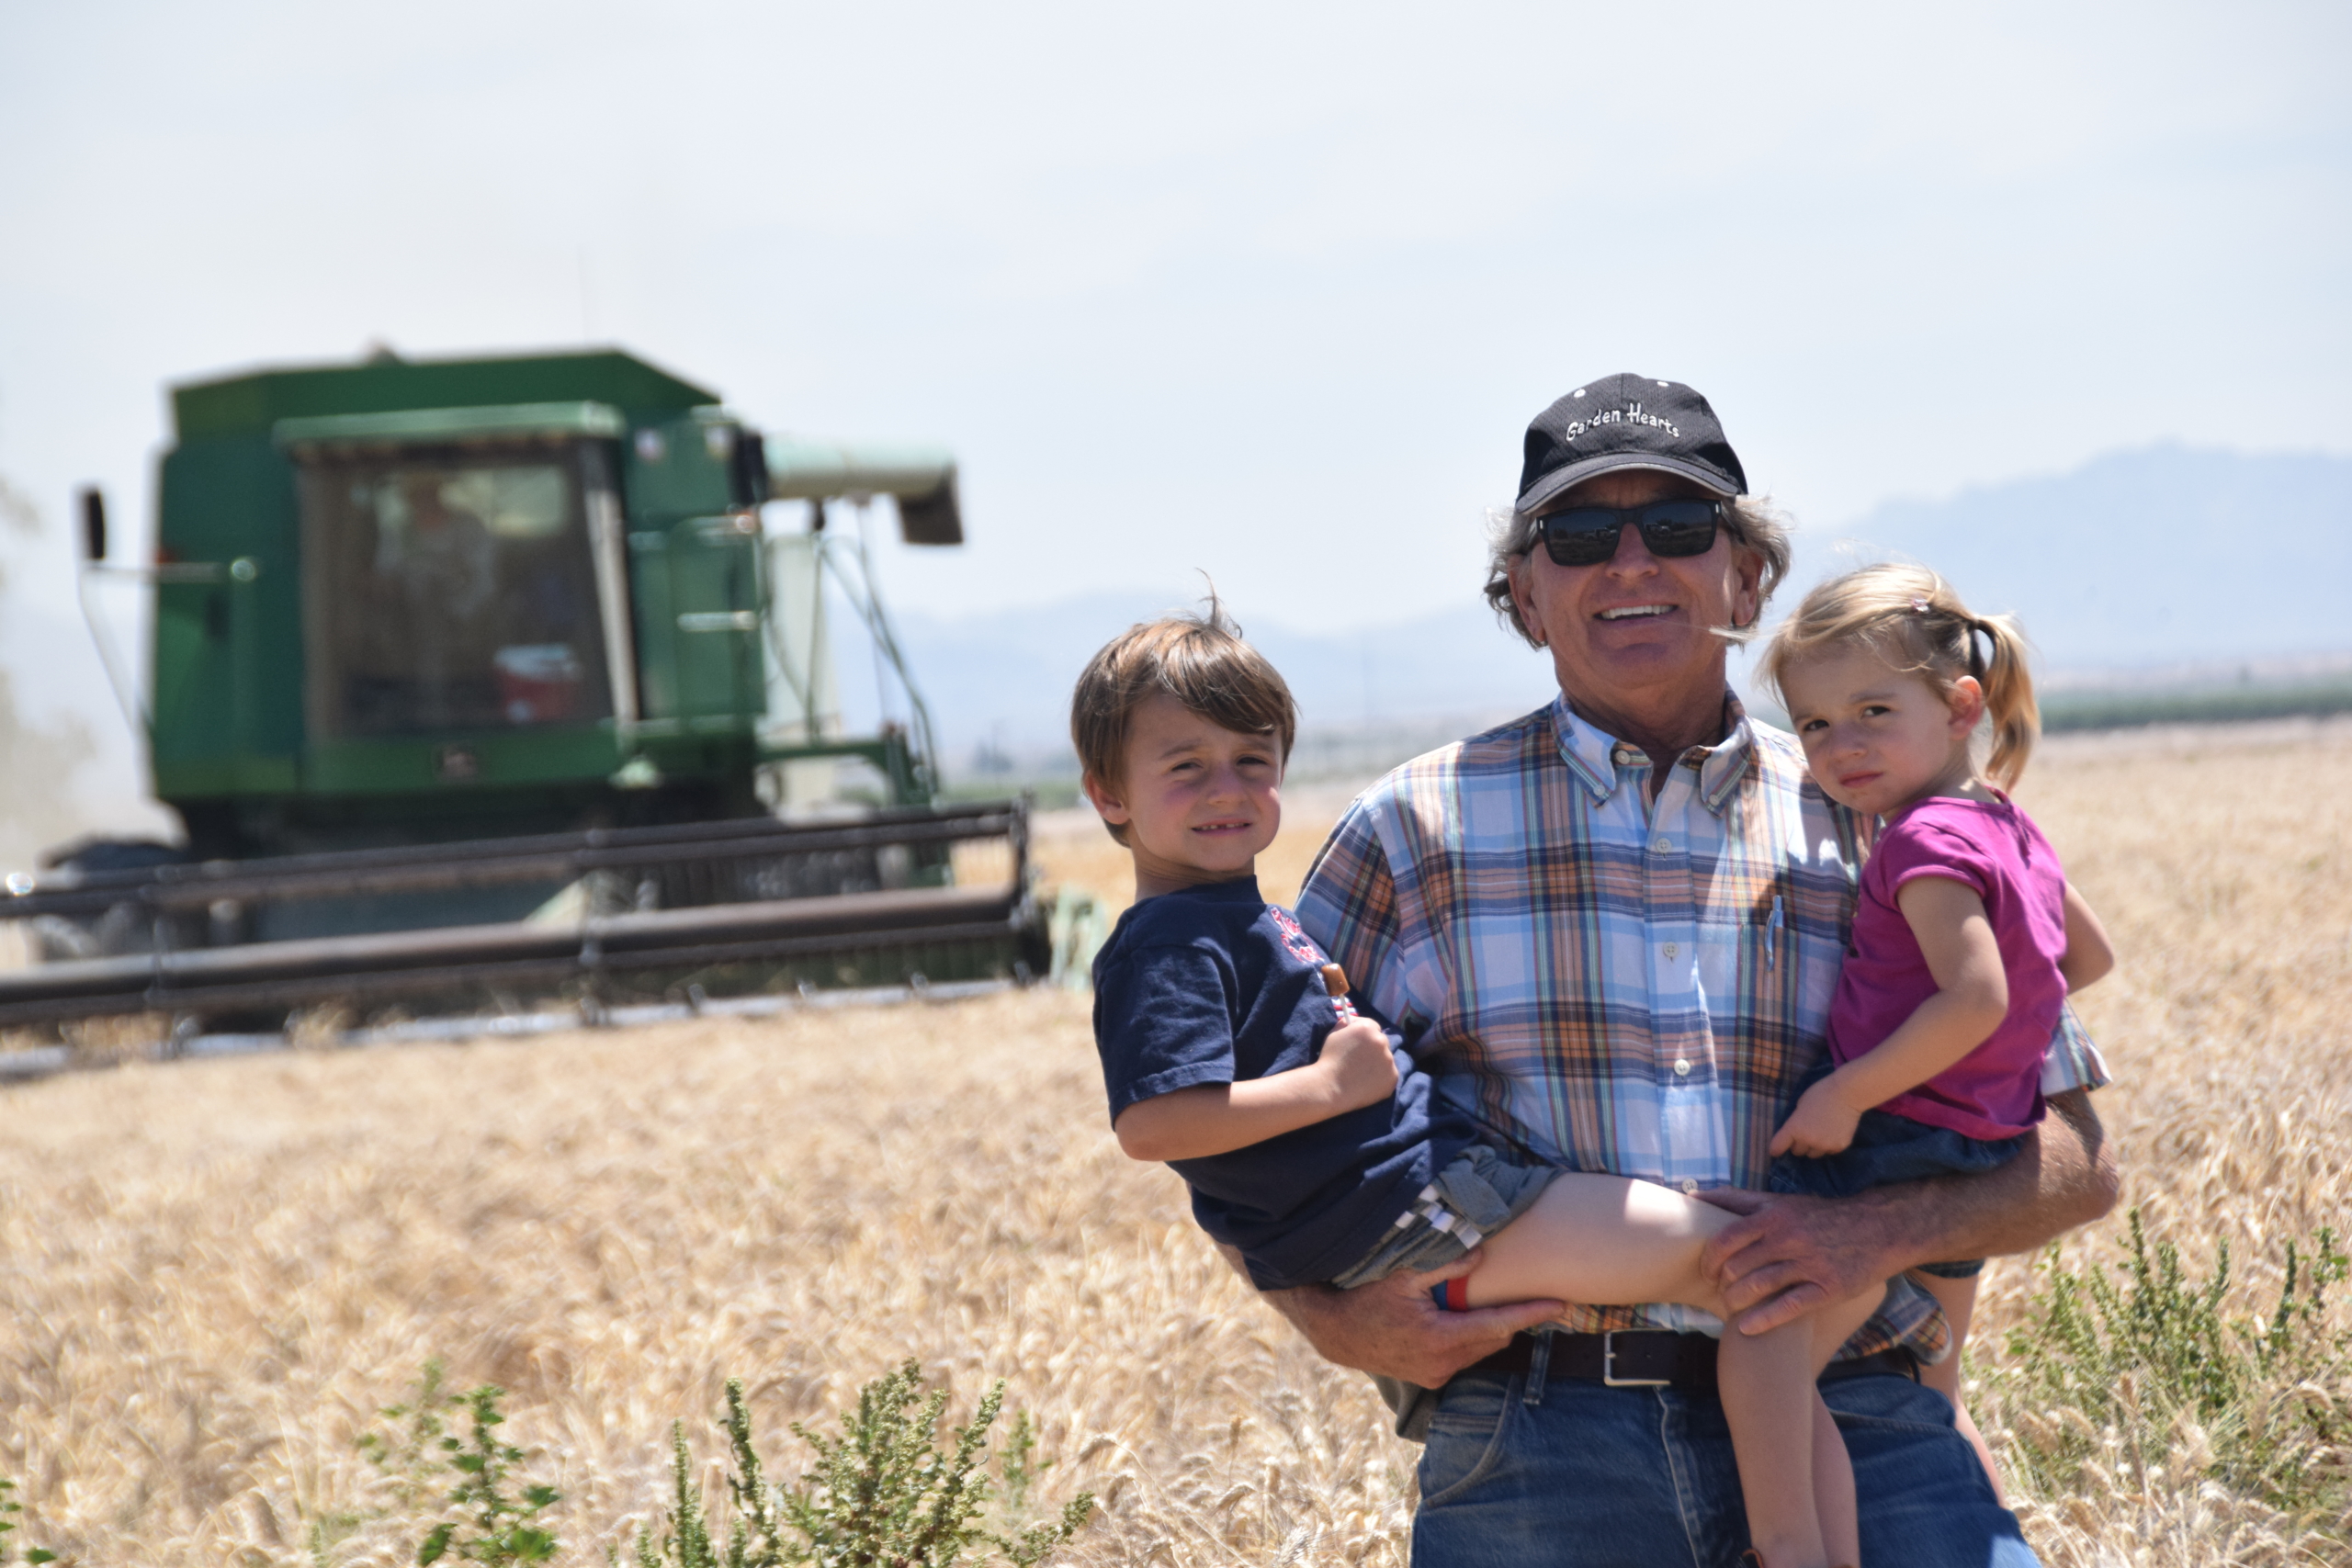
Arizona hosts several private breeding programs that focus intensely on the varietal traits desired by local wheat growers, such as yield, standability and pest resistance, as well as the quality traits that pasta manufacturing customers covet, including bright amber color, strong gluten strength and high falling number.

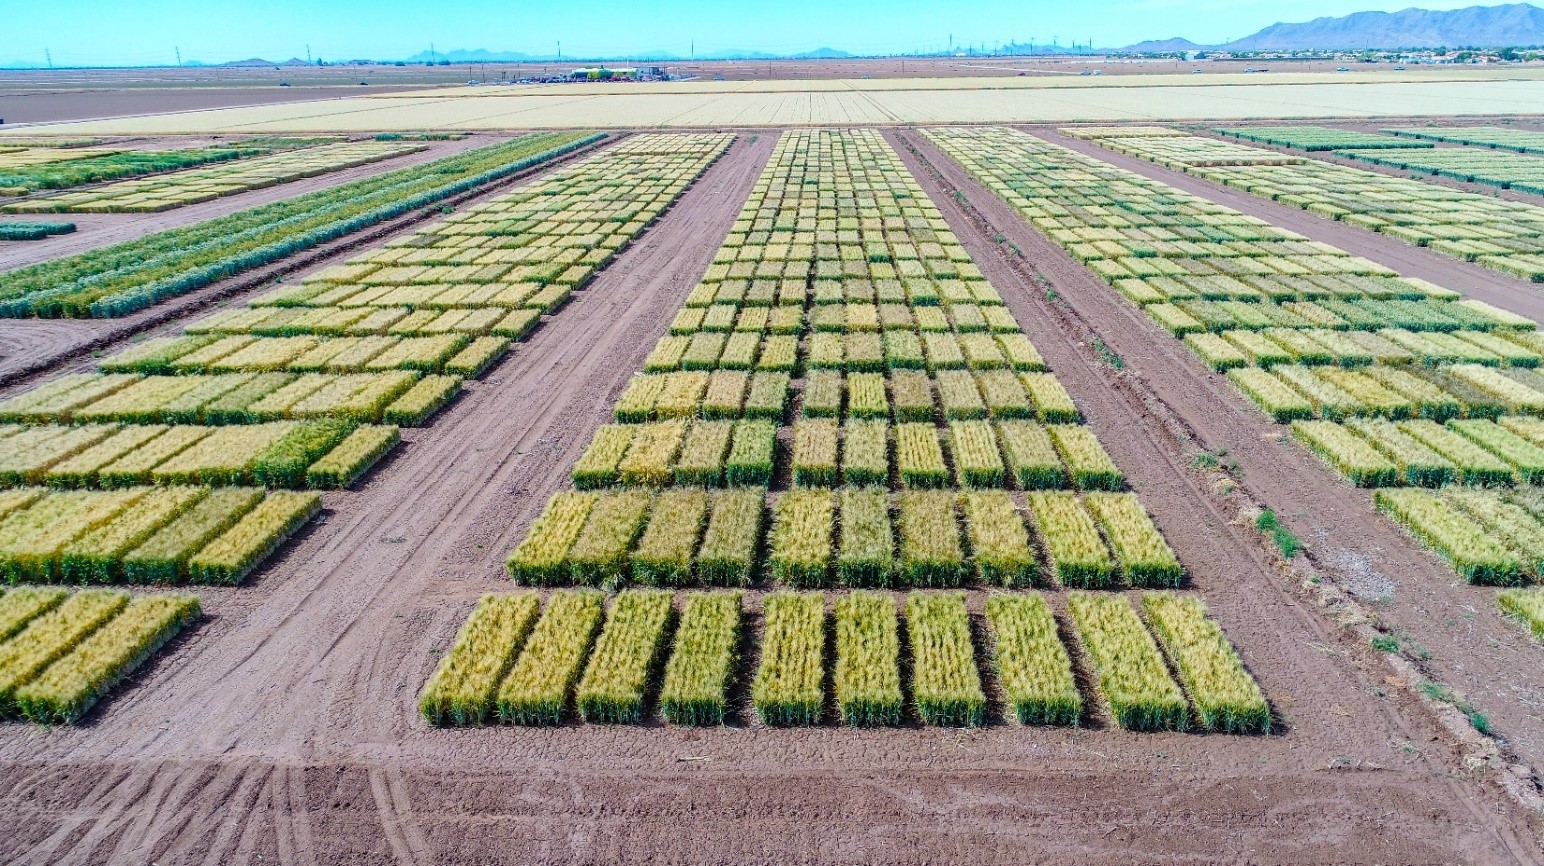
Here is a wheat breeding nursery like those maintained by each of the private breeding enterprises in Arizona, which has no publicly supported wheat breeding program. AGRPC does support grain production research conducted by the University of Arizona.

AGRPC recently commissioned a University of Arizona study that reviewed a wide range of literature related to water use by irrigated grain production in a desert environment. The paper concluded that Arizona’s durum wheat production, as currently practiced, has a water footprint that is lower, to much lower, than evidenced in many other durum production regions.

Learn more about the Arizona Grain Research and Promotion Council on its website here and on Facebook.

thumbnail

By Claire Hutchins, USW Market Analyst

With winter wheat prices remaining at or less than the cost of production and with a very wet planting season, it is no surprise that many U.S. farmers chose to plant slightly less winter wheat for harvest in 2020. USDA’s 2020/21 Winter Wheat Seedings report, released Jan. 10, reported U.S. farmers planted 30.8 million acres (12.5 million hectares) of winter wheat, down slightly from 2019/20 and 7% less than the 5-year average of 33.2 million acres (13.4 million hectares). Decreases for HRW and white winter wheat more than offset an increase in SRW planted area. USDA noted that this is the second smallest number of winter wheat acres on record.

Hard red winter (HRW). USDA assessed HRW planted area at 21.8 million acres (9.35 million hectares), down 1% from 2018. Planted acreage is down year-over-year in several major HRW-producing states with the largest decreases reported in Colorado, Montana and Nebraska. Colorado planted area fell 12% year-over-year to 1.90 million acres due to extreme dryness in the southeast, depressed commodity prices and pest pressure in the northeast. Record low planted area of 900,000 acres (364,000 hectares) in Nebraska can be attributed to weaker marketing conditions and an overly wet, late soybean harvest which prevented fall HRW planting.

“This didn’t just happen overnight,” says Royce Schaneman, executive director of the Nebraska Wheat Board. “State-wide plantings have been trending down for a number of years due to poor marketing conditions.”

HRW planted area in Kansas and Oklahoma is stable year-over-year at 6.90 million acres (2.79 million hectares) and 4.20 million acres (1.7 million hectares), respectively.

Total winter wheat planted area in Texas jumped 9% year-over-year to 4.90 million acres (1.94 million hectares). About 95% of Texas winter wheat is HRW and 5% is SRW.

“Adequate soil moisture in many regions, combined with favorable marketing conditions compared to cotton, allowed producers to maximize HRW acres,” says Darby Campsey, director of communications and producer relations for the Texas Wheat Producers Board.

In South Dakota, North Dakota, Montana and Wyoming, a very wet fall also prevented more HRW seeding, although these states usually plant a relatively small percentage of total U.S. HRW.

Soft red winter (SRW). Total SRW planted area of 5.64 million acres (2.28 million hectares) increased 8% from 2018. Increases in most SRW-producing states more than offset decreases in Delaware, Illinois Indiana, Michigan, Missouri and Wisconsin.

According to Tadd Nicholson, executive director of the Ohio Corn and Wheat Growers Association, the state’s SRW planted area increased 12% over last year to 560,000 acres (227,000 hectares) due to ideal, timely planting conditions following a miserably wet spring which left many corn and soybean acres unplanted.

In Illinois, SRW planted area fell 25% from last year to 490,000 acres (198,000 hectares).

“It was one of the craziest years for weather in Illinois,” says Mike Doherty, interim executive director of the Illinois Wheat Association “It was the third wettest year on record and most of the precipitation fell in the first eight months. Farmers were beside themselves trying to manage other crops through the wet weather. Across the state, corn and soybeans were harvested 30 to 60 days late. You just can’t plant winter wheat if you can’t get the other crops out of the ground.”

There is also SRW grown in areas of Texas and Campsey reports that “strong marketing opportunities and better, dryer planting conditions for SRW compared to last year’s overly wet field conditions led to a significant increase in SRW acreage year-over-year.”

White winter wheat. White winter wheat planted area fell to an estimated 3.37 million acres (1.36 million hectares), down 4% from 2018. White winter wheat planted area in Idaho, Oregon and Washington fell below last year. Idaho farmers reported planting 720,000 acres (291,000 hectares) compared to 730,000 acres (295,000 hectares) in 2018. Planted area in Oregon fell 5% from last year to 700,000 acres (283,000 hectares). Washington planted area fell slightly less than 2018 to 1.70 million acres (688,000 hectares).

Durum. Winter durum planting in the southwestern United States is estimated at 70,000 acres (28,300 hectares), up 9% from 2018 but 41% less than 2017. Arizona and California plant Desert Durum® from December through January for harvest May through July.

thumbnail

By Claire Hutchins, USW Market Analyst

On Sept. 30, USDA released its Small Grains Summary noting that 2019/20 U.S. wheat production increased to 53.3 million metric tons (MMT), up 4 percent from last year due to significant improvements in yield despite lower planted area. While this is still 2 percent below the 5-year average of 54.2 MMT, the production volume coupled with significant carry-in stocks ensure that the U.S. wheat remains the most reliable supply for 2019/20. Here is a look at 2019/20 U.S. wheat production by class.

USDA’s Small Grains Summary indicates U.S. wheat yields offset a reduced planted area for 2019/20.

Hard Red Winter (HRW). Last fall, U.S. farmers decreased HRW planting in the U.S. Southern and Central Plans due to extremely wet conditions which delayed the soybean harvest and in turn HRW planting. A slight uptick in planted area in Montana and South Dakota partially offset reductions in other states. Total U.S. HRW planted area fell 2 percent year-over-year to 22.7 million acres (9.19 million hectares), 15 percent below the 5-year average of 26.6 million acres (10.8 million hectares). Cool temperatures and favorable moisture during the growing season boosted HRW yields substantially year-over-year in Kansas, Nebraska and Oklahoma. In Kansas, the largest HRW producing state, a higher average yield offset lower planted area and production increased 22 percent over 2018/19 levels to 338 million bushels (9.17 MMT). USDA estimates total 2019/20 HRW production increased 26 percent over last year to 834 million bushels (22.7 MMT).

Hard Red Spring (HRS). Cold soil temperatures and excessive moisture in certain areas delayed HRS planting across much of the Northern Plains. USDA says U.S. farmers planted 12.0 million acres (4.86 million hectares), 6% below last year but slightly higher than the 5-year average of 11.8 million acres (4.78 million hectares). A cool summer boosted HRS yields in Montana and South Dakota. Heavy, persistent rain has severely delayed the 2019 HRS harvest. According to USDA, as of September 30, U.S. spring wheat harvest is only 90 percent complete compared to the 5-year average of 99 percent. USDA estimates 2019 HRS production will total 558 million bushels (15.2 MMT), 5 percent lower than 2018, but 8 percent higher than the 5-year average of 518 million bushels (14.1 MMT).

Soft Red Winter (SRW). Last fall, U.S. farmers planted 5.54 million acres (2.24 million hectares) of SRW, down 6 percent from the year prior and 18 percent from the 5-year average of 6.7 million acres (2.71 million hectares) due to low wheat prices compared to soybeans and delayed planting. Excessive moisture continued through the growing season and slowed harvest progress in many places. USDA reported SRW production totaled 239 million bushels (6.50 MMT), down 16 percent from last year and 31 percent below the 5-year average of 348 million bushels (9.46 MMT).

White Wheat (Soft White, Club and Hard White). U.S. white wheat planted area fell 4 percent below 2018/19 levels to 3.95 million acres (1.60 million hectares). Mild growing conditions and good soil moisture in the Pacific Northwest (PNW) supported above-average winter and spring wheat yields. The average white winter wheat yield in Oregon increased 1.0 bu/acre (.067 MT/hectare) over last year to 68.0 bu/acre (4.57 MT/hectare) in 2019. Slightly lower planted area and above-average yields kept U.S. white wheat production stable year-over-year at 273 million bushels (7.43 MMT) and 8 percent higher than the 5-year average of 252 million bushels (6.87 MMT).

Durum. Anticipating less-than break even prices, farmers planted less durum area this year. In its Small Grains 2019 Summary, USDA estimated 1.34 million acres (542,000 hectares) were planted to durum, down 35 percent from 2018/19 and 32 percent below the 5-year average of 2.0 million acres (664,000 hectares). USDA estimated total 2019/20 U.S. durum production at 57.3 million bushels (1.57 MMT), down 26 percent from last year. Cool, wet weather boosted yields in the U.S. Northern plains. Both Montana and North Dakota durum yield potential reached a record high in 2019. The country’s average durum yield also reached a record high of 44.8 bu/acre (3.01 MT/hectare), up 13 percent from last year. However, as with HRS, a significant portion of the northern durum crop has not yet been harvested. Desert Durum® production fell 46 percent year-over year to 5.67 million bushels (154,000 MT) due to sharply lower planted area in both Arizona and California.

thumbnail

Happy World Pasta Day! What a perfect day for U.S. Wheat Associates (USW) to share an overview of the 2018 U.S. Northern Durum and Desert Durum® crop quality results. Analysis shows the Northern durum crop is sound with high protein and excellent kernel characteristics. Vitreous kernel count and average kernel size are high and quality is balanced across the region. Desert Durum® production is down this year, though the 2018 crop will deliver the valuable milling, semolina and pasta quality traits that customers have learned to expect and appreciate.

Here is a summary of test results for Northern durum and Desert Durum®. As always, USW reminds buyers to be diligent with contract specifications to ensure they receive the quality they need.

Northern Durum

Weather and Harvest: A favorable growing season pushed yields to near record levels; production was up almost 60 percent compared to 2017. As with the hard red spring crop, mid-season rain boosted crop conditions and yield potential. Harvest was complete in most areas by late September.

Wheat and Grade Data: The crop average grade is U.S. No. 1 Hard Amber Durum (HAD) with average test weight of 61.4 lbs/bu (79.9 kg/hl) and average total kernel defects of 1 percent. The average vitreous kernel content is 90 percent, up from both last year and the 5-year average, with more than half of the crop above 90 percent vitreous compared to 45 percent in 2017.

Regional average protein is 14.5 percent on a 12 percent moisture basis (12% mb), equal to 2017 and slightly above the 5-year average. The crop average thousand kernel weight (TKW) is 41.2 g, the heaviest in six crop years, and the percent of large kernels is notably higher than a year ago. The average falling number is 425 sec. Although disease pressure was slightly higher in 2018 compared to 2017, DON was undetectable or <0.5 ppm in the samples analyzed.

Semolina and Processing Data: The Buhler laboratory mill average total extraction of 74 percent and semolina extraction of 69.3 percent are both higher than last year and the 5-year averages. The milled product ash and speck counts are also higher than last year and the 5-year averages. The gluten index average is 57.1 percent compared to 86.3 percent in 2017. Last year’s drought conditions supported exceptionally high gluten index values, while the 2018 values are more typical.

Semolina and cooked spaghetti evaluations show similar semolina color values to a year ago, but lower dry pasta color. Mixing properties are slightly weaker and cooked firmness values are similar to the 5-year averages. The higher extraction levels and higher ash levels on the Buhler lab mill may have contributed in part to the lower color scores on the dry pasta. Evaluation of the cooked spaghetti shows slightly lower firmness than 2017, but higher than the 5-year average.

Desert Durum®

Wheat and Grade Data: In 2018, the average grade is No. 1 Hard Amber Durum (HAD). Test weight average was 62.8 lbs/bu (81.8 kg/hl). The average vitreous kernel content (HVAC) is 98.0 percent, a high average typical of Desert Durum®. Average damaged kernels are 0.2 percent and total defects are 0.6 percent. Desert Durum® is characterized by its kernel low moisture content, and this year’s average was 6.7 percent. Protein content average was 13.4 percent (12% mb).

Semolina and Processing Data: The semolina b* value was 30.5, similar to 2017 b* value of 30.9.  Wet gluten of 32.3 percent and gluten index of 75 percent. Semolina Mixograph score was 8 and Alveograph W value was 231 (10-4 Joules), both of which indicate high strength.  Pasta color b* value was 44 and score was 9.6. Pasta cooked firmness was 6.9, significantly higher than 2017.

View the full report for Desert Durum® here.
View the full report for San Joaquin Valley Durum here.
View the full report for Sacramento Valley Durum here.

thumbnail

By Stephanie Bryant-Erdmann, USW Market Analyst

On Sept. 28, USDA released its Small Grains Summary noting that 2018/19 U.S. wheat production increased to 51.3 MMT, up 8 percent from last year due to improvements in both average yield and harvested area. While this is still 8 percent below the 5-year average of 55.8 MMT, the 2018/19 production coupled with significant carry-in stocks ensure that the U.S. wheat store will remain open and well-stocked throughout 2018/19. Here is a look at 2018/19 U.S. wheat production by class.

Hard red winter (HRW). Last fall, U.S. farmers increased HRW planting in the U.S. Southern Plains due to favorable moisture conditions. That slight increase was not enough to offset decreased planted area in the U.S. Northern Plains where a long-term drought delayed, and in some cases, prevented winter wheat planting. Planted area in Montana fell 6 percent year over year. USDA reported HRW planted area at 23.2 million acres (9.39 million hectares), down 2 percent from 2017. Unfortunately, most of the Southern Plains received little to no moisture until spring, with some areas going from October to April without measurable precipitation. The poor weather caused Oklahoma wheat farmers to abandon 43 percent of their winter wheat area, up from both the 5-year average and the 2017/18 abandonment rate of 36 percent. The average HRW yield in Kansas and Oklahoma, the top two HRW-producing states, decreased 21 percent and 18 percent from 2017/18, respectively. With the drought causing both harvested area and average yields to fall, USDA estimates total 2018/19 HRW production dropped 12 percent to 662 million bushels (18.0 MMT). Though smaller in volume, 2018 HRW quality i is excellent. Read more here.

Hard red spring (HRS). Wet conditions slowed HRS planting but replenished depleted soil moisture across the drought stressed Northern Plains. USDA says U.S. farmers planted 12.1 million acres (4.90 million hectares) to HRS, up 17 percent from the year prior. The beneficial moisture boosting average HRS yields and harvested area. In North Dakota, the top HRS producing state, the average yield climbed 20 percent year over year to a record high 49.0 bu/acre (3.29 MT per hectare), up 41 percent from 2017/18. Idaho farmers also produced record high HRS yields. USDA now reports HRS production at 587 million bushels (16.0 MMT), up 53 percent from 2017/18.

Soft red winter (SRW). Last fall, U.S. farmers planted 5.85 million acres (2.37 million hectares) of SRW, up 4 percent from the year prior, but still 23 percent below the 5-year average. While planting conditions were generally favorable, depressed prices kept planted area low. In early 2018, several U.S. SRW growing areas received excessive moisture that decreased yield potential and the wet weather continued through harvest. USDA reported SRW production totaled 286 million bushels (7.78 MMT), down 2 percent from 2017/18 and 33 percent below the 5-year average of 429 million bushels (11.7 MMT). Read more here.

White wheat (including soft white, club and hard white). U.S. white wheat planted acres stayed close to the 5-year average at 4.15 million acres (1.68 million hectares) in 2018/19. A wet winter boosted yield potential for both the winter and spring crops. The average spring white wheat yield in Washington increased 20 percent to 54.0 bu/acre (3.63 MT per hectare). The slight increase in harvested area and significant improvement in average yields pushed 2018/19 total white wheat production to 272 million bushels (7.41 MMT), a 5 percent increase year over year, and 8 percent above the 5-year average of 252 million bushels (6.86 MMT).

Durum. Farmers planted less durum area this year in response to lower prices and large carry-out stocks during spring planting. USDA estimates 2.00 million acres (810,000 hectares) were planted to durum, down 13 percent from 2017/18 but still 9 percent above the 5-year average of 1.84 million acres (745,000 hectares). USDA estimated total 2018/19 U.S. durum production at 77.3 million bushels (2.10 MMT), up 41 percent from last year. Generally favorable weather boosted yields in the U.S. Northern Plains, with average durum yields increasing to 39.3 bu/acre (2.64 MT per hectare), up 13.3 bu/acre from last year when drought severely impacted the crop. Desert Durum® production fell 8 percent year over year to 10.5 million bushels (385,000 MT) due to sharply lower planted area in both Arizona and California.

thumbnail

By Stephanie Bryant-Erdmann, USW Market Analyst

With the small, stressed hard red winter (HRW) wheat crop getting the lion’s share of attention, it was an initial surprise to read in USDA’s May World Agricultural Supply and Demand Estimates (WASDE) that U.S. wheat production is expected to increase to 49.6 million metric tons (MMT) in 2018/19. That would be up 5 percent year over year, if realized.

The forecast increase is a result of greater harvested area and slightly higher average yield in the other classes. USDA forecast 2018/19 all wheat average yield at 46.8 bushels per acre (3.15 metric tons [MT] per hectare), up from 46.3 bushels per acre (3.11 MT per hectare) last year. Harvested area is expected to increase 1.3 million acres (526,000 hectares) in 2018/19. Crop condition ratings also matter in this forecast, and as the following by-class reviews show, HRW is clearly the exception to the up-trend in production.

HRW production is expected to be the smallest since 2006/07 at 17.6 MMT. If realized, that would be down 14 percent year over year and 22 percent below the 5-year average. Low farm-gate prices and poor planting weather last fall reduced 2018/19 U.S. HRW planted area to 23.2 million acres (9.4 million hectares), the second lowest planted area on record. That poor start coupled with widespread drought throughout the U.S. Southern Plains set up the current situation where harvested HRW acres are expected to fall 5 percent from 2017/18 to 16.5 million acres (6.68 million hectares).

The large decrease in harvested acres is centralized in the U.S. Southern Plains where HRW crop condition ratings remain poor. In top HRW-producing states of Kansas, Oklahoma and Texas, 51 percent, 65 percent, and 59 percent of HRW is rated poor or very poor, respectively. As a consequence of the drought and resulting poor crop conditions, USDA expects harvested area in Oklahoma to fall 31 percent year over year to 2.0 million acres (810,000 hectares). On May 10, USDA rated 25 percent of HRW in the states surveyed in good to excellent condition, while 45 percent is rated poor or very poor. Read more about the all too evident challenge of wheat farming on the High Plains.

Soft red winter (SRW) production is expected to increase to 8.57 MMT in 2018/19. If realized, that would be up 8 percent year over year, but still 22 percent below the 5-year average. 2018/19 U.S. SRW harvested area is expected to increase 8 percent from the year prior to 4.0 million acres (1.62 million hectares). USDA also expects record high yields in Indiana, Kentucky, Maryland and Michigan due to favorable growing conditions this spring.

On May 14, USDA noted week over week crop condition rating improvements in nearly all SRW-growing states, with 67 percent of the SRW acres surveyed rated good to excellent. Week over week improvements were noted in Illinois and Arkansas where 63 percent of SRW was rated good to excellent, up 10 percentage points and 5 percentage points, respectively, from the week prior.

White wheat.* 2018/19 white winter wheat production is forecast at 6.24 MMT, including 5.66 MMT of soft white (SW) winter wheat and 577,000 MT of hard white (HW) winter wheat. If realized, SW winter wheat production would be up 2 percent year over year, due to increased planted area, while HW winter wheat production would be down 11 percent from 2017/18 due to forecast reduction in average yield. SW winter wheat production is centralized in the Pacific Northwest (PNW) states of Idaho, Oregon and Washington. As of May 14, 71 percent of Idaho SW, 80 percent of Oregon SW and 85 percent of Washington SW was rated in good to excellent condition.

Desert Durum®. USDA expects Desert Durum® production — centralized in Arizona and California and planted in the winter — to total 332,000 MT, up 6 percent from 2017/18 due to significantly better yields in California. In Arizona, the Desert Durum® crop was 90 percent headed by April 29, significantly ahead of the year prior’s pace.

Spring wheat and Northern durum. Snow covered, frozen fields delayed spring wheat and Northern durum planting this year, but U.S. farmers are beginning to catch up. As of May 14, spring wheat and durum planting is 58 percent complete, up from just 30 percent complete the week prior, but still behind the 5-year average pace of 67 percent.

With spring planting still underway, USDA did not provide a by-class breakdown of production for hard red spring (HRS) and durum on May 10. However, USDA did note that combined spring wheat and Northern durum production is projected to increase 34 percent year over year due to “both increased area and yield.” With total U.S. wheat production projected at 49.6 MMT and U.S. winter wheat production projected at 32.4 MMT, that puts 2018/19 spring wheat — including soft white spring, HRS, and hard white spring — and durum production at 17.2 MMT.

Back on March 29, USDA projected U.S. HRS planted area at 12.1 million acres (4.9 million hectares). If farmers are able to realize their planting intentions despite the late start, that would be up 17 percent year over year. Northern durum planted area was forecast at 1.88 million acres (760,000 hectares), down 14 percent, if realized. Still, weather will play a role in farmers’ decisions, and a late spring in Montana and western North Dakota tends to favor increased wheat area. Conversely, it tends to favor increased corn and soybean acres in Minnesota.

To stay in touch with U.S. wheat harvest progress, subscribe to the U.S. Wheat Associates Weekly Harvest Reports, which will start later this month.

*In the May 10 report, USDA combined data for soft white winter wheat and hard white winter wheat. Both soft white (SW) and hard white (HW) can be grown in either the spring or fall. USDA will provide a wheat by-class outlook in July. Similarly, data for HRS, SW spring, HW spring and spring-planted durum were combined into a general “spring-planted wheat” category.

thumbnail

USDA forecast U.S. 2017/18 wheat production at 47.9 million metric tons (MMT), down 24 percent year over year and 18 percent below the 5-year average. The reason: an anticipated 12 percent decline in average yield and the lowest planted acres since USDA records began in 1919. However, USDA expects 2017/18 U.S. beginning stocks to total 32.2 MMT, up 21 percent year over year and the most since 1988/89. As a result, total 2017/18 U.S. wheat supply is forecast at 80.1 MMT, down 10 percent from 2016/17 but still 1 percent above the 5-year average of 79.3 MMT. USDA expects average yield to be 46.2 bu/acre (3.10 MT/ha), which is close to the 5-year average of 46.6 bu/acre (3.13 MT/ha).

On June 30, USDA estimated total planted wheat area would fall 9 percent year over year to 45.7 million acres (18.5 million hectares). If realized, that would be 17 percent lower than the 5-year average. USDA expects 2017/18 harvested area to drop 13 percent from last year and 18 percent below the 5-year average to 38.1 million acres (15.4 million hectares).

USDA forecast 2017/18 hard red winter (HRW) production to total 20.6 MMT, down 30 percent from 2016/17 and 14 percent below the 5-year average. A smaller planted area and sharply lower harvested area led to the decline. U.S. farmers planted 23.8 million acres (9.63 million hectares) of HRW for 2017/18, down 10 percent from 2016. Due to weather and wheat streak mosaic virus, harvested area in top HRW-producers Texas, Oklahoma and Kansas is projected to fall 16 percent year over year. USDA forecast 2017/18 HRW beginning stocks at 16.1 MMT, up 33 percent year over year and 81 percent above the 5-year average. Total 2017/18 HRW supply is expected to total 36.8 MMT, down 12 percent from 2016/17.

Soft red winter (SRW) production is also expected to decline 11 percent to 8.33 MMT in 2017/18 due to fewer planted acres. USDA estimated total 2017/18 SRW area at 5.61 million acres (2.27 million hectares), 15 percent lower than 2016/17 and 30 percent below the 5-year average. In contrast to recent years, SRW harvest in the U.S. Southern Plains is progressing rapidly with good harvest conditions. On July 7, the USW Weekly Harvest report showed the average grade on 199 samples was U.S. #2 in a generally sound crop with DON levels that are significantly below the 5-year average. USDA estimates that SRW 2017/18 beginning stocks totaled 5.85 MMT, up 37 percent from 2016/17 and 47 percent above the 5-year average. The larger beginning stocks will offset reduced production, and total 2017/18 SRW supply is expected to increase by 500,000 MT year over year to 14.2 MMT.

USDA reported white wheat production will decrease 11 percent from 2016/17 to 6.91 MMT, but still 1 percent above the 5-year average, if realized. The decline is due to 3 percent fewer planted acres and slightly lower forecast yields. Idaho, Oregon and Washington have received ample moisture and winter wheat conditions there average 78 percent good to excellent. USDA estimates soft white (SW) beginning stocks increased 42 percent year over year to 2.86 MMT. The larger beginning stocks are expected to offset the lower production, leaving the 2017/18 SW supply unchanged year over year at 9.77 MMT.

Hard red spring (HRS) production is expected to plummet in 2017/18 to 10.5 MMT, down 22 percent from the prior year and the lowest since 2002/03, if realized. The average spring wheat yield is forecast at 40.3 bu/acre (2.73 MT/ha), down 15 percent from 2016/17. USDA also estimates farmers planted 10.3 million acres (4.17 million hectares) to HRS, 10 percent below 2016/17 levels. As of July 11, 55 percent of North Dakota is in a severe or extreme drought and the remainder of the state is abnormally dry or in a moderate drought. Similarly, 72 percent of South Dakota and 45 percent of Montana are in a moderate to extreme drought. As of July 10, just 35 percent of the spring crop was rated good or excellent and 39 percent was poor or very poor. In North Dakota, the largest HRS producing state, 36 percent of the crop is in good or excellent condition. USDA anticipates 2017/18 HRS beginning stocks of 6.39 MMT are 14 percent less than last year. Estimated 2017/18 HRS supply will total 16.9 MMT, down 19 percent year over year. USDA expects the HRS stocks-to-use ratio to fall to 22 percent in 2017/18, compared to 41 percent one year prior.

Smaller planted area and 30 percent lower yields are expected to reduce durum production to 1.55 MMT in 2017/18, down an estimated 45 percent from 2016/17 and 26 percent below the 5-year average. USDA expects average durum yields to sink to 30.9 bu/acre (2.08 MT/ha), compared to 44.0 bu/acre (2.96 bu/acre) in 2016/17. Durum planted area decreased this year as farmers responded to lower prices and large carry-out stocks. Spring-planted northern durum is grown primarily in North Dakota and Montana, and the Desert Durum® harvest in Arizona and California is nearly complete. USDA estimates 2017/18 durum beginning stocks at 980,000 MT, up 29 percent from the prior year and 45 percent greater than the 5-year average. Increased beginning stocks will not offset the drastically reduced 2017/18 production so USDA expects the U.S. durum supply will fall to 2.53 MMT, 29 percent below 2016/17 levels and 9 percent below the 5-year average. The U.S. durum stocks-to-use ratio will fall to 24 percent, on par with the 5-year average.

Even with reduced production for 2017/18, U.S. farmers stored significant amounts of grain last year, ensuring that customers can continue purchasing reliable, high-quality wheat. Customers are encouraged to contact their local USW representative to discuss purchasing strategies in this volatile global wheat market.

thumbnail

By Elizabeth Westendorf, USW Policy Specialist

Roy Motter farms 2,500 acres in the Imperial Valley of California, and while that may be small compared to other U.S. wheat farms, his operation supports three families. Motter has been farming with his two brothers-in-law since the 1970s, and he oversees their wheat production. They grow Desert Durum® wheat, as well as lettuce, cabbage, onions, sugar beets, sugar cane, alfalfa seed and hay, Sudan grass, melons and tomatoes.

“I chose to start farming more than 40 years ago because I like being outdoors, and I like the dynamics of working for yourself and making those decisions,” said Motter. “Farming is multi-dimensional; every crop is different and has different demands.”

Motter is one of six U.S. wheat farmers featured in a USW series on wheat sustainability representing the six U.S. wheat classes, grown in distinct regions and local micro-climates. The series suggests that while aggregate measures of sustainability are important, but they fail to capture the nuances of a crop that is grown across many different climates, soil types and farm environments. These profiles show the differences in farming practices across the country and how those practices enhance the sustainability of U.S. agriculture.

For Motter, wheat is a pivotal part of their approach to sustainable farming.

“We can’t grow our money crops — lettuce, onions and sugar beets — year after year,” said Motter. “You have to have a rotation, and wheat is a good rotational crop for us. It lets us control weeds and disease that affect the other crops and gives the ground a chance to rest.”

Farmers in the Southwest increase economic water productivity (the dollar value of crop production per acre-foot of water consumed) by 9 to 21 times by rotating wheat production with vegetable production. And in an arid climate like the Imperial Valley, maximizing water productivity is vital.

“We get a lot of criticism for using irrigation water from the Colorado River. But if you want to sustain a growing world population with food and fiber, you must modify the environment to satisfy those needs,” said Motter. “If we want to talk about sustainability issues in relation to wheat crops, the primary issue is to use our water as efficiently as we can, and we work to improve that every year.”

Motter’s reliance on irrigation does not mean his farm is less sustainable. The Imperial Valley grows 85 percent of the nation’s lettuce in the winter months of the year, and with or without its wheat production, the region will continue to grow its vegetable crops. By rotating wheat with that lettuce production, Motter reduces the amount of water his farm uses. In fact, over the past 30 years, farmers in the desert Southwest have reduced their water usage for barley and wheat by approximately 30 percent and consistently invest money in water and energy conservation efforts.

U.S. wheat farmers deal with unique challenges and growing conditions. For Motter, those challenges are managing water use in an arid climate and controlling crop diseases without the benefit of a cold winter in between growing seasons. Motter and his family’s farm have thrived because they use rotation and best practices to maximize soil health and production while minimizing required inputs. This formula is one that all farmers strive to balance, and each go about it in ways that make the most sense in their region. Sustainability is not “one size fits all.”

Learn more about Motter and his farm at www.uswheat.org/factsheets. There is also more information about U.S. farmers, ranchers, fishermen and foresters share their values, sustainability experiences and conservation practices at the U.S. Sustainability Alliance.

thumbnail

By Elizabeth Westendorf, USW Policy Specialist

In 2016, Field to Market published its third National Indicators Report that assessed sustainability metrics in U.S. agriculture and looked at production of each crop on a national scale. Based on its environmental indicators, the report showed that wheat production has continued to improve, with particular progress in reducing soil erosion, over the past 25 years. The assessment results reflect yield improvements in wheat and demonstrate how farmers have adopted conservation practices. Reports like this help quantify sustainability and production improvement over time.

Assessing wheat sustainability on a national scale is difficult, however, because of the highly regional nature of its production. There are six U.S. wheat classes, grown in distinct regions and local micro-climates. Aggregate measures of sustainability are important, but they fail to capture the nuances of a crop that is grown across many different climates, soil types and farm environments.

To capture some of those nuances, USW has developed a series of farmer profiles that highlight regional sustainability in U.S. wheat production. Featuring farmers that grow a specific U.S. wheat class, the profiles highlight their practices, dedication to sustainability and unique growing conditions. They illustrate that while no two farmers are the same, they share a dedication to protecting their land for the next generation and a commitment to responsible stewardship.

The profiles include:

We encourage our customers and stakeholders to read the profiles at www.uswheat.org/factsheets. There is also more information about how U.S. farmers, ranchers, fishermen and foresters share their values, sustainability experiences and conservation practices online at The U.S. Sustainability Alliance.

thumbnail

By Elizabeth Westendorf, USW Policy Specialist

When it comes to analyzing the sustainability of agricultural crops there is a tendency to apply generalized metrics or standards to a wide swath of scenarios. While there is value in using generalized metrics, broad stroke approaches can miss the small details that often make a big difference in regional situations. Seeing the whole forest is important, but sometimes you learn more by focusing a little more on individual trees.

Let us discuss wheat, for example. This is a crop with many specific advantages often not considered in a sustainability analysis. Farmers tend to grow wheat on marginal land areas that do not receive enough water for other agricultural production or in areas too cold or too dry for other crops. In some regions and systems, it plays a vital role in rotations with other row crops by providing residue in a soybean rotation and a water-saving role in irrigated corn or sorghum. In assessing wheat’s sustainability, generalized base metrics of water usage do not take in the whole picture. Wheat’s true sustainability should also include what it adds to the entire agricultural system, and how it complements other crops while providing an essential food grain for literally billions of people.

One area of wheat production that has been criticized for its sustainability in the past is Desert Durum® in the desert southwest United States. Unlike most other wheat production, Desert Durum receives almost all of its water from irrigation. However, it uses less irrigation water than many of the other crops grown in that region, and farmers are constantly working to increase irrigation efficiency.

A recent study by Dr. George Frisvold of the University of Arizona analyzed sustainability metrics for water use in Arizona small grain production and found that most generalized metrics of sustainability do not adequately reflect the true nature of this system. Wheat, and specifically Desert Durum, plays an important role in sustainable agriculture in the Southwest. Using wheat in a rotation with vegetables in this area increases farmer profit significantly and maximizes economic productivity of water use. In addition, the study showed that the amount of water necessary to produce one bushel of Desert Durum in Arizona has declined by 18 percent over the last 30 years.

In the case in desert wheat and durum production, as in other U.S. wheat producing regions, different systems and environments face different challenges and producers adapt with different sustainable solutions. A general measure can never fully capture all of those nuanced solutions comprehensively.

For more information, visit https://bit.ly/1LROd1O, or https://www.thesustainabilityalliance.us/.