By Jonathan H. Harsch, Agri-Pulse, Excerpted with Permission
(Editor’s note: This is the third in a new series of Agri-Pulse in-depth stories dealing with the challenges and opportunities for U.S. agriculture when it comes to selling more commodities and value-added products to overseas customers. This article was sponsored by funding from the National Association of Wheat Growers, U.S. Wheat Associates, Washington Grain Commission, North Dakota Wheat Commission and Idaho Wheat Commission.)
Prospects for U.S. farm exports can change suddenly and dramatically.
Breaking into foreign markets takes decades of persistent hard work and hefty investments in building infrastructure, relationships and, ultimately, sales.
Augusto Bassanini, chief operating officer for United Grain Corp., knows firsthand the challenges of building all three. This experienced grain exporter tells Agri-Pulse that after taking years to build trust and a reputation for reliability, “any interference with that trust, that reliability, is going to have an immediate impact … So, you spend years building that rapport and everything could change overnight.”
“It takes years, especially in Asia, to build that rapport,” he says, “and you have to build it face-to-face.”
Bassanini says he’s seen major new export markets developed in South America, Asia and elsewhere thanks to vital funding from farmers’ checkoff dollars and USDA’s export promotion programs. But he warns that current concerns over U.S. trade agreements and tariff battles with China “create an environment of uncertainty,” forcing buyers and end-users to scramble to find new sources for the grain, soybeans, or other commodities they need to stay in business.
Vancouver, Wash.-based, United Grain operates grain terminals in Oregon, Montana, and North and South Dakota where, Bassanini says, “small farming communities are dependent upon grain exports for providing crucial revenue to those remote locations.” So, any threat to export growth will have a disproportionate impact on these farming areas. And he says that threat is already here.
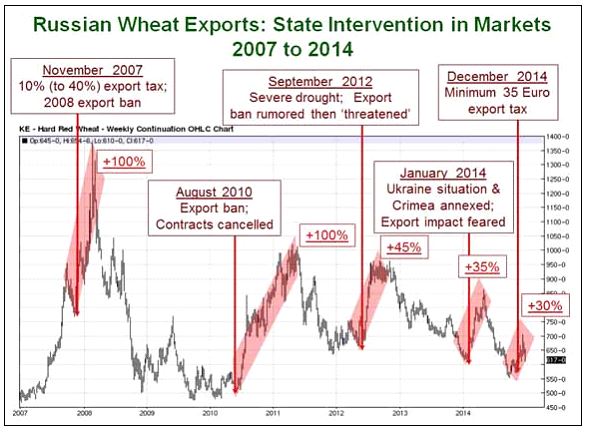
“We continue to lose market share in terms of volume to competing major export hubs like South America, Brazil, Argentina, Russia and the Black Sea region,” he says. “If we are going to compete with them on a yield basis, I don’t think we are going to win that fight.”
Still, he says that despite headwinds, “we continue to expand our share in regions like Southeast Asia because competing countries are not able to deliver quality products on a consistent, reliable basis.” Maintaining these gains, he says, depends on the U.S. investing in improving supply chain efficiencies, upgrading the infrastructure needed to deliver product reliably, and avoiding even rumors about trade disruptions.
Disruption Concerns. Since taking office, the Trump administration has made several gains on the export front for agricultural products.
However, the administration has also unnerved trading partners by renegotiating the North American Free Trade Agreement (NAFTA), pulling out of the Trans-Pacific Partnership (TPP) and announcing tariffs on steel, aluminum and a variety of other products – prompting retaliatory threats from the Chinese and other countries.
Several U.S. agricultural groups say that one of the best ways to keep pressure on the Chinese and counter the Asian giant’s influence is for the U.S. to rejoin what used to be called the Trans-Pacific Partnership (TPP).
The U.S. Wheat Associates (USW) and the National Association of Wheat Growers (NAWG) welcomed the possibility of reviving the full 12-nation pact. “If the United States joins TPP, U.S. wheat should be able to compete on a level playing field with Canadian and Australian wheat,” said USW Chairman Michael Miller, a wheat farmer from Ritzville, Wash.
Representing 140,000 American wheat farmers, USW and NAWG wrote USTR’s Lighthizer in March, warning that “Lost market share is incredibly difficult to regain.” They pointed out that under new CPTPP rules, Japan will cut its tariffs on imported Canadian and Australian wheat to $85 per ton but keep the current $150 per ton tariff in place for U.S. wheat. While the change will phase in over nine years, the wheat groups said the “loss in market share and its negative effect on farm-gate prices are likely to come much sooner, as Japanese millers reformulate their product mix to avoid the need to purchase artificially expensive U.S. wheat.”
Hopes were also raised that the farm sector’s major role in the U.S. economy would translate into White House support for increasing rather than flat-lining or reducing funding for the two USDA cost-share programs that, in partnership with farmer-funded checkoff dollars, have played a vital role in expanding U.S. farm sales abroad: the Market Access Program (MAP) and the Foreign Market Development (FMD) Program.
Export promotion legislation. To support these programs, last September Sen. Angus King, I-Maine, introduced S. 1839, the “Cultivating Revitalization by Expanding American Agricultural Trade and Exports Act.” Along with the companion House bill, H.R. 2321, King’s CREAATE bill would steadily raise MAP [and] FMD funding.
The House version of the new farm bill takes a different approach. USDA’s trade programs, including the MAP and FMD, would be combined under a new International Market Development Program … Under current law, only MAP would have funding after this year under the expiring 2014 farm bill. Combining the programs would ensure all the programs have a permanent funding baseline. Boosting both ag exports and export promotion funding has become vital to both the rural and the national economy.
Success in the Philippines. Based in Manila, USW Regional VP for the Philippines and South Korea Joseph Sowers is keenly aware of … aggressive competition. He says it’s an “uphill battle” to convince buyers to opt for premium-priced but better performing U.S. wheat. He also points to significant gains.
In the Philippines, Sowers says, “We have a program here where we invest in increasing consumption of wheat-based foods. And we’ve done it.” He adds that almost all the gains benefit the U.S. with its 97 percent market share, proving that “These kinds of investments are paying off.”
Key to this level of market dominance, Sowers insists, is being on-the-ground for decades with regional offices and regular seminars. He says this presence builds trust with buyers and end-users to the point that “decision makers trust us, they look to us for advice.” He considers [state wheat] checkoff, FMD and MAP funding vital to maintaining USW’s foreign offices and “absolutely essential to everything we do.”
“Our mandate is twofold,” Sowers says. “One is to create the greatest returns to our farmers, to the people who fund us. The other mandate is to make the local industry here the most profitable they can be, to increase their profits so they will buy from us.”
To make it all happen, Sowers hosts seminars year-round, with upcoming ones set for Manila, Bangkok and Jakarta, “talking to buyers about methods that they can use to decrease their purchasing price or to plan their purchases through the year. And then at the same time, have a mill management seminar showing them how to increase their profitability using, of course, U.S. products.”
Along with working to increase exports to developing markets like Sri Lanka and Malaysia, Sowers says Thailand, Indonesia and Vietnam offer “the most opportunity for huge increases in sales” and that new trade agreements offer the best way to make U.S. products more competitive.
New Coalitions. USW’s President Vince Peterson and VP of Overseas Operations Mark Fowler [say] with the farm economy struggling in an already down market, the tariff battle with China puts 1.5 million metric tons of U.S. wheat sales at risk just when unsettled NAFTA and TPP issues threaten sales to other major buyers like Mexico and Japan.
Peterson says the trade battles have “forced us to form coalitions” with other U.S. stakeholders and with “customers overseas worried about their supply relationship with us. They don’t like this any more than we do.” He says the new coalitions aim to alert the Trump administration to escalating impacts on U.S. agriculture from recent policy changes.
Peterson and Fowler tell Agri-Pulse that the strategy to success is to sign new trade agreements, complete the NAFTA negotiations without harming ag exports, reconsider joining the TPP, use the WTO dispute settlement process, and double funding for USDA’s MAP and FMD programs as … CREAATE legislation proposes.
Trade Battles Undermine U.S. Reputation as a Reliable Supplier. U.S. Grains Council President and CEO Tom Sleight warns that due to the trade battles launched by the U.S., “our loyal, longtime customers are actively looking at alternative sources of supply … We’re hurting our reputation not only in China, but with other trading partners, with key ones like Japan, Korea, Mexico. Even in places in Southeast Asia that are new and growing markets for the U.S., we’re creating doubt.”
“There are definite consequences if these battles do not get settled expediently and with proper attention to the impact on agriculture,” he says.
National Association of Wheat Growers President Jimmie Musick explains that with his wheat, cattle, alfalfa, cotton and sorghum operation in Sentinel, Okla., “it doesn’t appear like I raise a commodity that China [is] not [targeting] in their tariff trade war.” To help remove this threat, he wants the administration to understand “how important it is that we maintain good trade relationships and how devastating it will be to our farmers when China puts a 25 percent tariff on our commodities.”
Musick’s also at work on getting more support from farm-state members of Congress. He’d like them to persuade the administration to switch from tariffs to negotiations by offering in return to support legislation that’s on Trump’s priority list.
With today’s long list of farm and trade organizations linking arms as never before, Musick and his colleagues are hopeful their concerted pressure on Congress and the White House will pay off in terms of less turbulent waters ahead and continued growth in the U.S. ag export markets that they’ve worked so diligently to build over several decades.