thumbnail

Members of the International Longshore and Warehouse Union (ILWU) are crucial workers at U.S. export grain elevators. Overseas wheat buyers in the Asia-Pacific region likely recall the challenges faced in 2015 during a lengthy contract negotiation that occasionally interrupted the West Coast supply chain. Although the dispute was finally settled with a contract through June 2019, trade organizations representing shippers like the Pacific Grain Exporters Association and transportation providers encouraged the parties to consider negotiating a longer-term agreement.

On Aug. 4, union longshore workers at 29 ports in Oregon, California and Washington ratified a new, three-year contract extension with the PMA. The contract virtually eliminates the possibility of a labor-related disruption through July 1, 2022. The contract also increases wages along with health and pension benefits.

The new contract clearly adds operational stability to Pacific Northwest ports that loaded more than 13 MMT of U.S. wheat exports in marketing year 2016/17, representing almost 48 percent of total U.S. overseas sales. Along with the U.S. government’s commitment to continuous improvement of the Columbia-Snake River System, USW believes this is very good news for overseas wheat buyers and U.S. farmers.

thumbnail

By Steve Wirsching, USW Vice President and West Coast Office Director

This winter the Pacific Northwest (PNW) has seen snowstorms and record rainfall that reduced vessel loading and inbound rail service. A slowing of rail service for just a few weeks manifested itself into long vessel lineups and loading delays of up to three to four weeks. Normally there are 12 to 15 vessels in the Columbia River waiting to load. However, the Daily Grain Bulletin, published by the Portland Grain Exchange, reported 38 grain vessels waiting to load a few days ago.

Almost every sort of natural disaster imaginable has interrupted rail service to the PNW. The Burlington Northern Santa Fe (BNSF) railroad applied additional resources to restore full service as soon as humanly possible. Last week there was a break in the weather, which allowed the rail service to partially recuperate. This marginal improvement raised train velocities and increased the number of unit-trains arriving in Portland daily.

Export elevators are also struggling with the weather because they cannot load when it is raining. Reports are that vessel loading efficiency is down 25 percent due to the heavy rainfall. Portland set a record in the month of February when over 10 inches of rain fell in 28 days, the most precipitation since 1996. When it rains this hard, exporters must close the hatches to protect the grain from excess moisture. Some facilities have special hatch covers where some grain can be blown through a small hole, but the loading speed is dramatically reduced.

Further complicating the weather delays are the planned repairs of the Columbia Snake River System. The U.S. Army Corp of Engineers closed the river system on Dec. 12 for necessary long-term maintenance, putting additional pressure on the rail system, now the sole mode of transportation to move grain to market. An ice storm in the Columbia River gorge stopped construction for several days, delaying repairs with possible impact on the planned reopening date of March 20. The Army Corp of Engineers is doing everything in its power which includes working on the weekends and adding labor to complete the repairs on time, but there is only so much they can do when fighting mother nature.

The grain trade is working its way out of this backlog and all expectations are that by April the Columbia River will be back to normal. Currently vessels entering the river are waiting two to three weeks to load. Loading delays and higher basis levels will potentially crowd out spot market demand limiting sales for the next year. However, most wheat buyers heeded the advice of USW early last year, when told to purchase wheat ahead of the river closure. Wheat sales and shipments are ahead of last year’s pace, a clear indication that buyers responded to USW’s recommendations. Grain (wheat, corn and soybean) exports are as much as 21 percent higher this year, the best year in the last 10 on a calendar year basis.

With a healthy dose of perseverance, the grain trade, railroads, barge lines, growers and overseas buyers will work through these logistical challenges and overcome the delays. Traditional U.S. folk lore says March weather “comes in like a lion and out like a lamb.” There are hundreds of people here in the PNW, and among many of our customers, we are waiting anxiously for the lamb to arrive!

Harvest Report

By Stephanie Bryant-Erdmann, USW Market Analyst

The sharp inverse in export basis between March delivery and April delivery for U.S. wheat at both Gulf and Pacific Northwest (PNW) ports indicates that exporters have faced logistical challenges during a brutally cold and snowy winter. It also provides a savings opportunity for those customers who can wait for delivery until April or May.

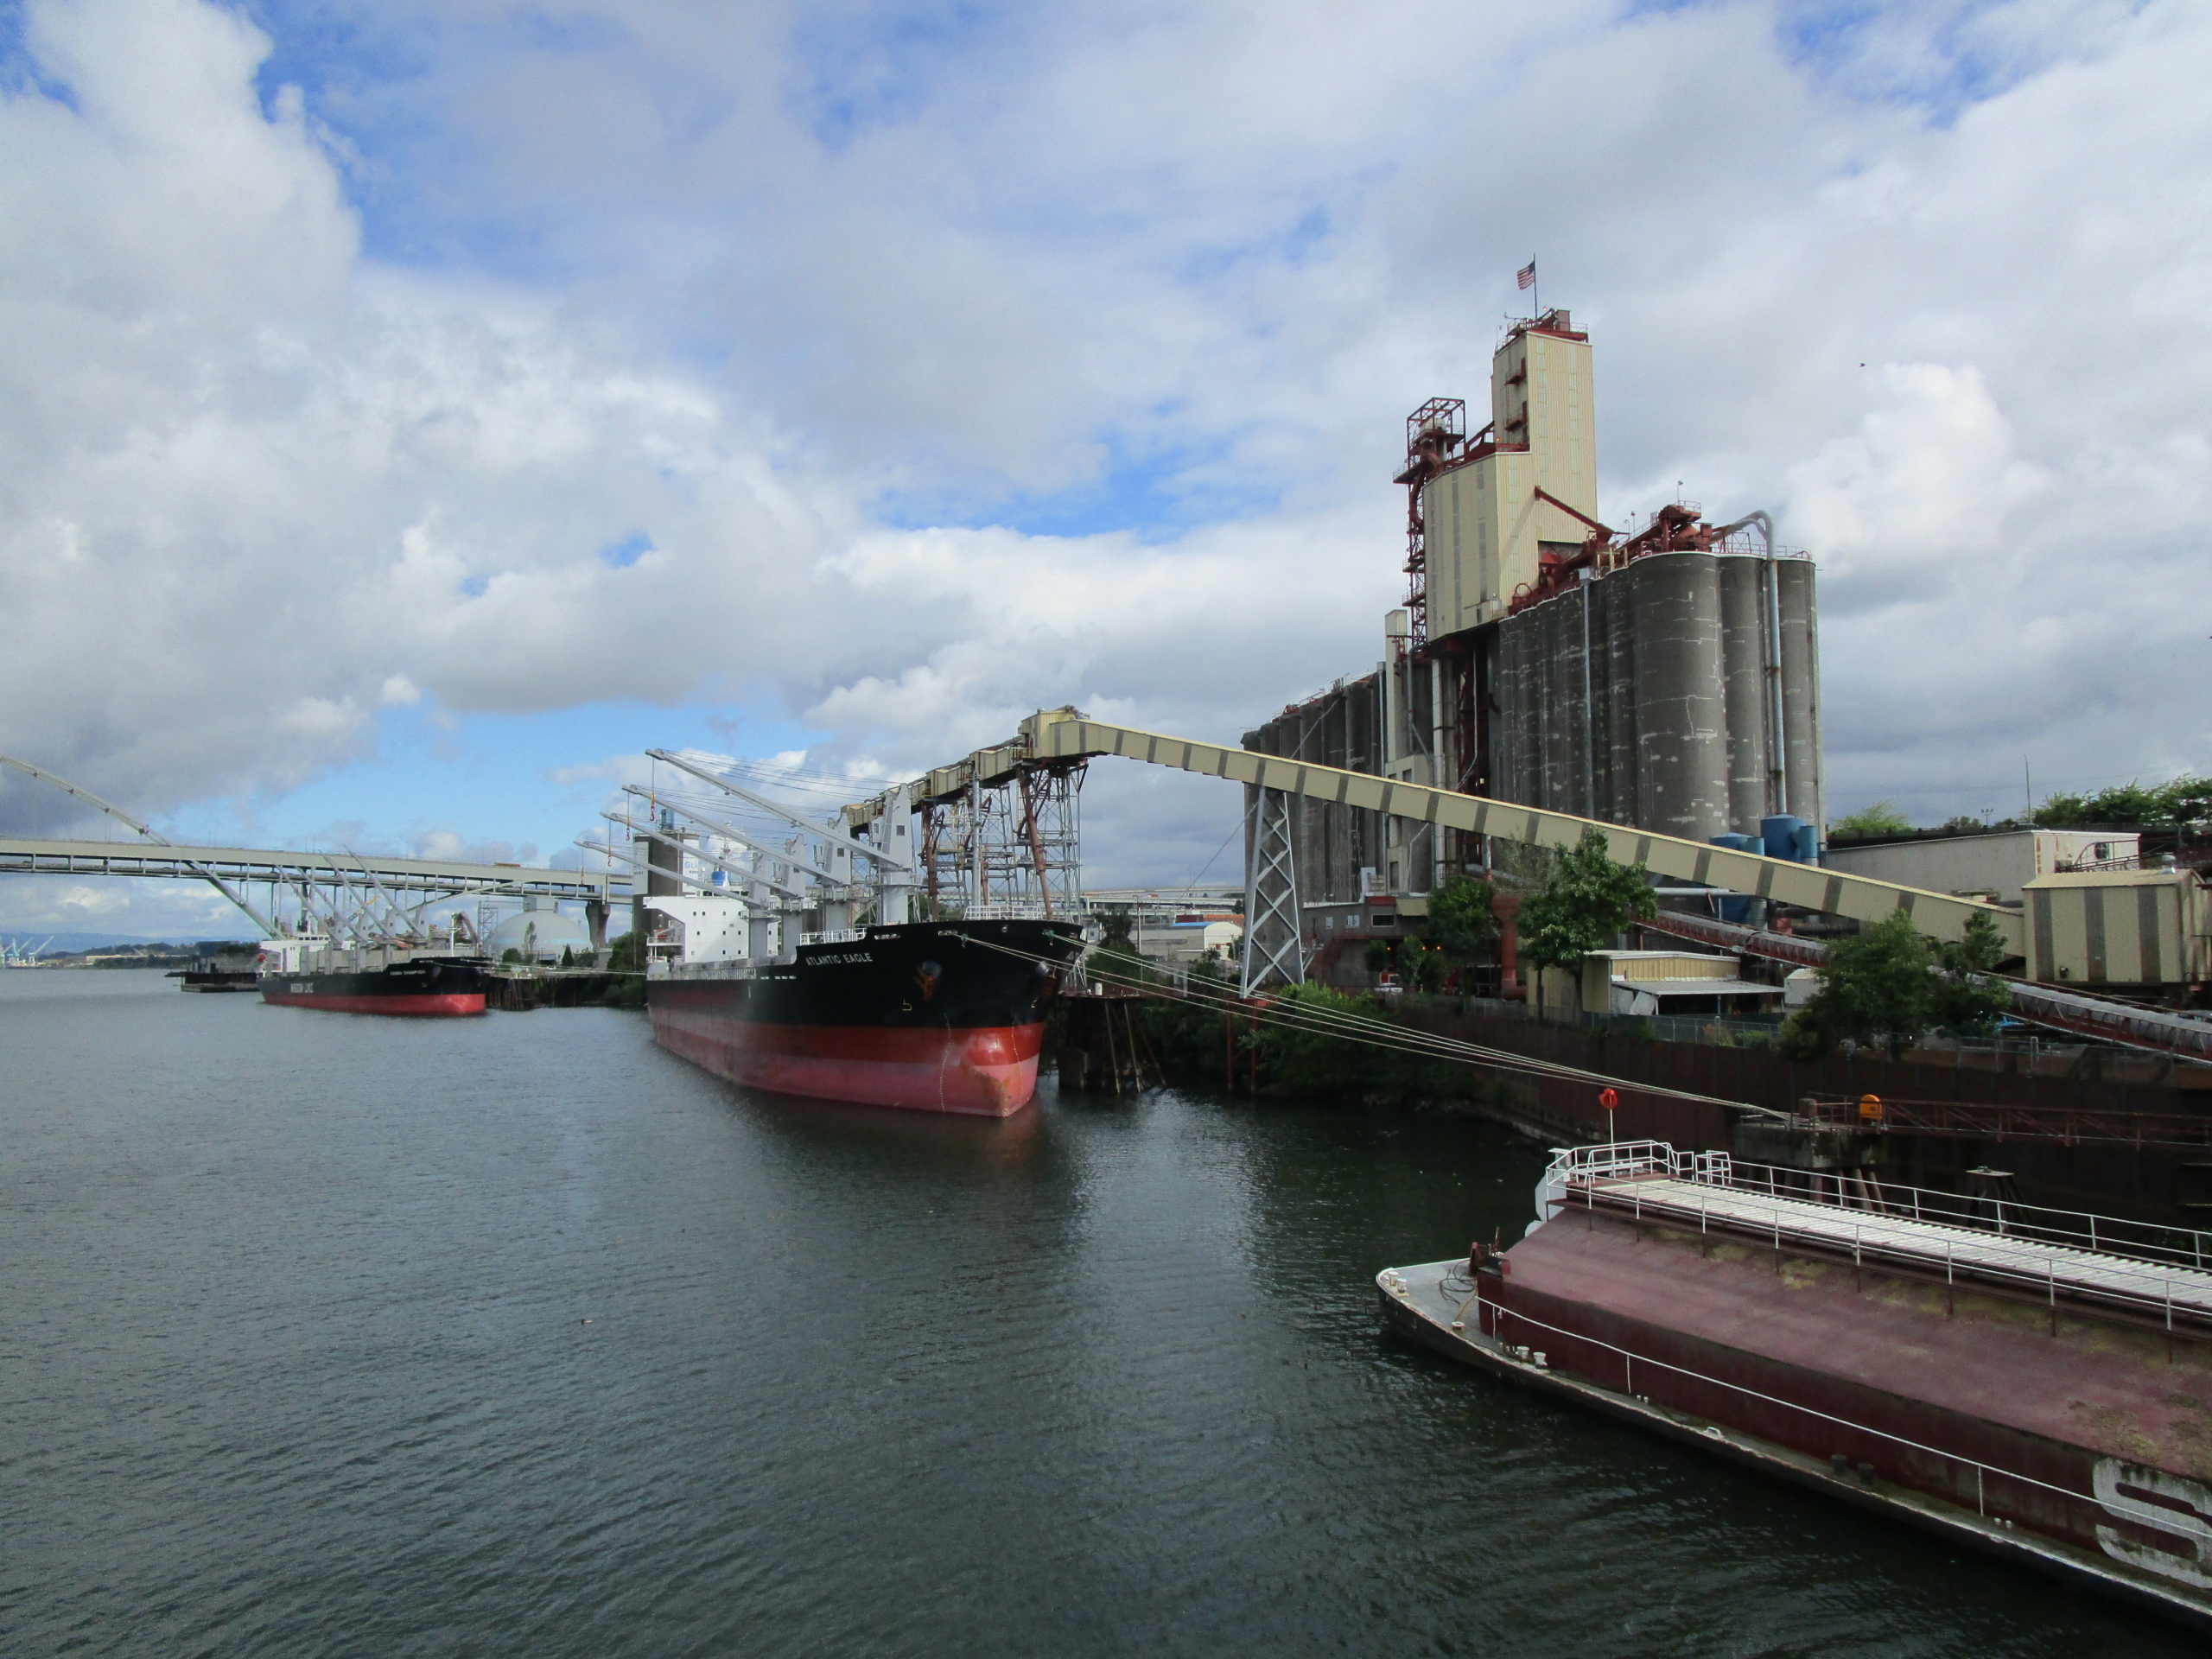
USDA data shows that in January, U.S. grain export inspections increased 18 percent year over year and are on par with the 5-year average. The bad winter weather began slowing rail and barge arrivals at both Gulf and PNW ports in December. Those delays worsened as January brought frigid temperatures and snow to the U.S. Northern Plains, Midwest and, unusually so, to PNW ports. This year’s snowfall is the largest in Portland, OR, since 1995.

Railcar supply tightened in December and January, as the bad weather slowed train movement across the Northern Plains. In severe cold, railroads must decrease the number of cars pulled by each locomotive for safety reasons. During January, the U.S. rail system round trip rate slowed according to Surface Transportation Board data. In turn, the higher demand for rail freight pushed secondary rail freight rates dramatically higher.

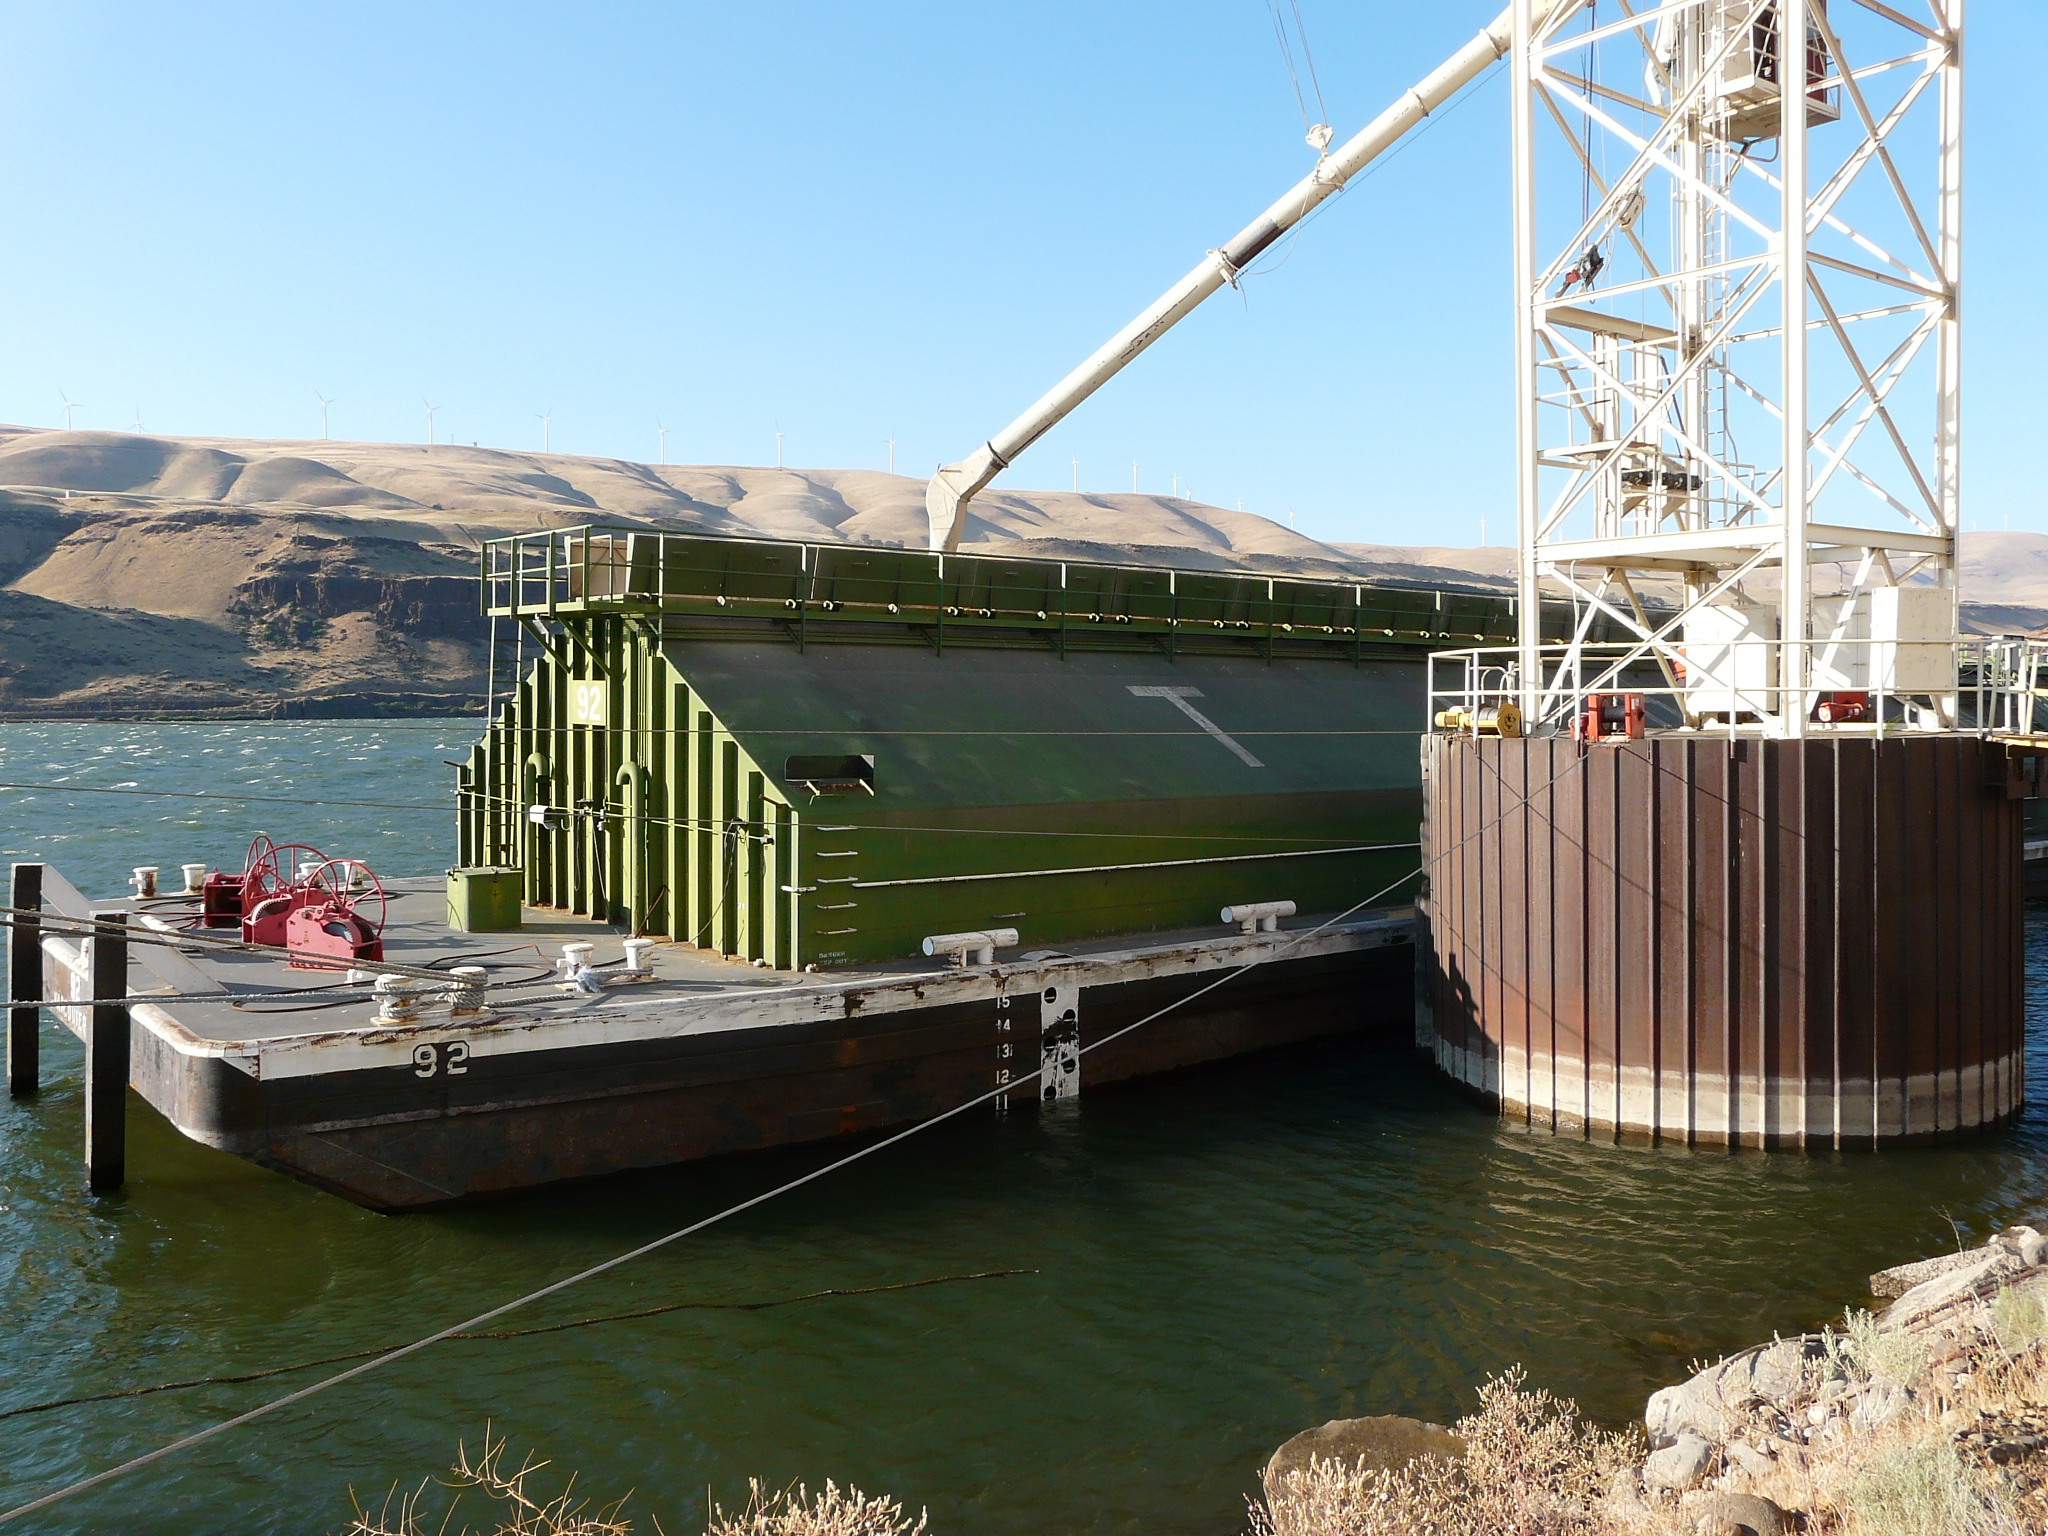
In calendar 2016, barges delivered 43.2 million metric tone (MMT) of grain to U.S. Gulf ports, the largest volume recorded since USDA began tracking in 2003. This year, demand for barge space continued into January rather than tapering off after fall harvest. Year to date in 2017, barges moved 2.81 MMT of grain on the Mississippi River, up 18 percent year over year and 21 percent above the 5-year average.

While U.S. export facilities have some storage on-site, a consistent flow of grain from the interior is needed to keep up with vessel loading. Since 2010, PNW export terminal storage capacity has increased 27 percent to 1.08 MMT, yet PNW export terminals turn their inventory about every 12 days. Gulf export terminals have roughly 2.2 MMT of capacity and on average turn over their inventory about every 10 days.

With the delays in grain delivery, vessels waiting to load have increased significantly. In its Feb. 2 Grain Transportation Report, USDA said 65 vessels were at port in the U.S. Gulf, compared to the 2016 weekly average of 43 vessels. Throughout January, the U.S. Gulf had an average 58 vessels either loading or waiting, up 14 percent from January 2016 and 25 percent above the 5-year average. As of Feb. 2, there were 37 vessels at port in the PNW, up 85 percent from the same time last year.

Looking ahead, exporters believe they can work through the backlog by the end of March barring any additional severe weather events. In January, an average 43 vessels per week loaded in the Gulf, compared to an average 40 vessels per week in 2016. Though PNW vessel loading slowed to an average 10 vessels per week for the first three weeks of 2017, Federal Grain Inspection data showed 31 vessels were loaded between Jan. 26 and Feb. 2.

As exporters continue to load vessels, U.S. wheat customers are likely very aware of demurrage and dispatch clauses in their contracts. All types of export contracts include incentives for exporters to load as quickly as possible to avoid incurring demurrage. U.S. law ensures customers’ contracts will be fulfilled as soon as physically possible because it is in the exporter’s financial interest to do so. According to traders, demurrage on current charters in the PNW and Gulf are averaging $12,000 per vessel per day.

This year’s weather has certainly been worse than normal, but the issues that come with such challenges are well-known. That is partly why U.S. railroads, ports and waterway associations continually invest in infrastructure to improve the flow of grain from U.S. farmers to overseas customers.

Customers who have adequate supplies can save between $6 to $20 per metric ton at current export basis levels depending on the class and port of origin by pushing new wheat business deliveries out to April or May. As always, the U.S. wheat store remains open and transparent. And, as always, U.S. Wheat Associates (USW) representatives are available to answer any questions customers may have about U.S. export logistics and how they can continue to get the best value possible from U.S. wheat.

Harvest Report

By Stephanie Bryant-Erdmann, USW Market Analyst

2016 ended on a high note for U.S. wheat exports, which posted the largest volume of sales in the fourth quarter since 2010. From October through December, the United States exported 6.5 million metric tons (MMT) of wheat, 48 percent above last year’s sales and 28 percent greater than the 5-year average. The strong export sales pace pushed total U.S. wheat exports to 20.9 MMT through Dec. 29, 7 percent ahead of the 5-year average and greater than total 2015/16 sales of 20.7 MMT.

Hard red winter (HRW) and hard red spring (HRS) are leading the charge. Year-to-date, HRW sales of 8.43 MMT are 24 percent ahead of the 5-year average and already greater than both 2015/16 and 2014/15 total sales. U.S. HRS sales are also 31 percent ahead of the 5-year average at 6.78 MMT and just shy of last year’s total 2015/16 sales of 6.91 MMT. These sales allowed the United States to regain the title of the largest single-country exporter in volume and value in a calendar year from Canada. According to USDA export sales data, U.S. wheat exports totaled 25.9 MMT, up 27 percent from CY 2015.

In CY 2015, Canada exported roughly 2.3 MMT more wheat than the United States and Russia, which nearly tied with a difference of less than 30,000 MT between them, based on Global Trade Atlas (GTA) data. The extra tonnage boosted the value of Canadian wheat exports to $6.23 billion compared to the U.S. wheat export value of $5.62 billion and the Russian value of $3.95 billion. In other words, despite the United States and Russia being virtually tied for the number two spot by tonnage in CY 2015, U.S. wheat exports earned 42 percent more dollars.

This year, the value comparison is even more interesting. GTA data shows U.S. wheat exports back on top from January to November with a value of $4.88 billion. For the same time period, GTA estimates Canadian wheat export value at $4.13 billion and Russian wheat export value at $3.32 billion.

While industry reports tend to focus on tonnage for grains, reports concerning other crops often refer to value of exports. While volume of exports reflects the drawdown of available stocks and infrastructure utilization, the value of exports reflects the relative financial return to the various exporting country economies as well as to producers and grain handlers.  International Grains Council (IGC) data shows the export price of Canadian 13.5 percent protein (on a 13.5 percent moisture basis) spring wheat at Vancouver averaged $218/MT ($5.93/bu) in 2016, and Russian milling wheat averaged $179/MT ($4.87/bu). By comparison, U.S. hard red spring (HRS) 13.0 percent protein (on a 12.0 percent moisture basis) at the Pacific Northwest averaged $232/MT ($6.31/bu) in 2016.

With many of the world’s largest exporters producing record-large crops with lower than normal protein content this year, buyers around the world are looking for high-quality, higher protein wheat. As the fourth quarter sales show, the U.S. wheat store continues to supply customers with the wheat they need. Customers around the world see the value of U.S. wheat versus its competitors and rely on it to provide consistent high quality flour to their own customer demand.