thumbnail

For 40 years, U.S. wheat farmers have supported U.S. Wheat Associates’ (USW) efforts to work directly with buyers and promote their six classes of wheat. Their contributions to state wheat commissions, who in turn contribute a portion of those funds to USW, qualifies USW to apply for export market development funds managed by USDA’s Foreign Agricultural Service. Currently, 17 state wheat commissions are USW members and this series highlights those partnerships and the work being done state-by-state to provide unmatched service. Behind the world’s most reliable supply of wheat are the world’s most dependable people – and that includes our state wheat commissions.


Member: Minnesota Wheat Research & Promotion Council
USW Member since 1980

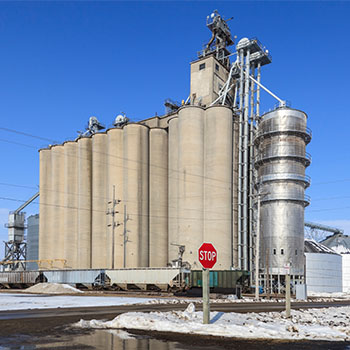
Location: Red Lakes Falls, Minnesota
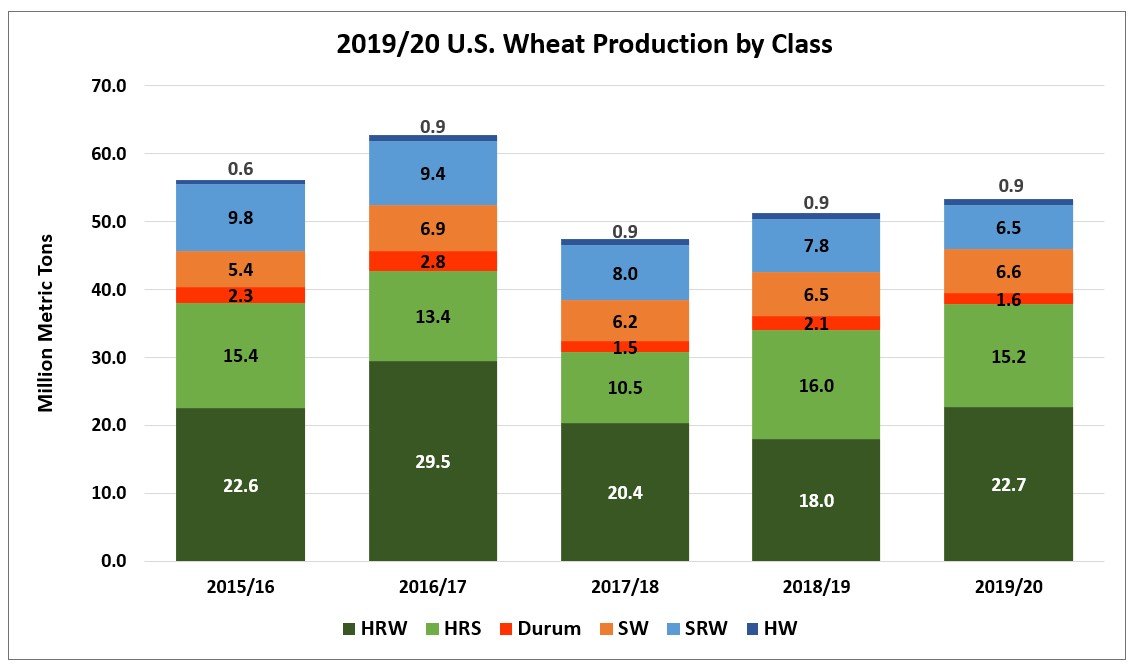
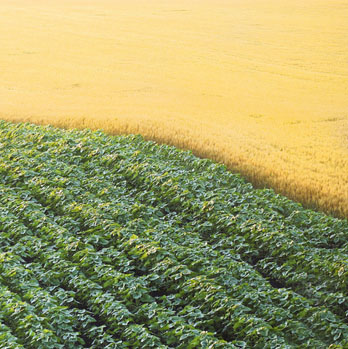
Classes of Wheat Grown: Hard Red Spring (HRS), Hard Red Winter (HRW)
USW Leadership: Don Loeslie, 1989/90 Chairman; Bruce Hamnes, 2000/01 Chairman; Rhonda K. Larson, 2019/20 Secretary-Treasurer (slated for 2021/22 Chairman)

The Minnesota Wheat Research & Promotion Council builds opportunities for farmer profitability working to enhance wheat research and promote wheat in the marketplace.

(L to R): Michael Peters, Oklahoma; Rhonda Larson, Minnesota; Darren Padget, Oregon; Doug Goyings, Ohio; Vince Peterson, USW.

Why is export market development important to Minnesota wheat farmers and why do they continue to support USW?

Like most of the country, more than half the wheat grown in Minnesota is exported. Developing and maintaining wheat export markets is vital to improving farm profitability.

“We produce more wheat in Minnesota than can be consumed by Minnesota, so overseas customers are essential customers for our wheat farmers,” said Charlie Vogel, Chief Executive Officer.

Scott Swenson (second from left), a farmer from Minnesota, participated on the 2018 USW Board Team that traveled to China and Taiwan.

How have Minnesota wheat farmers recently interacted with overseas customers?

Minnesota has proudly hosted many trade teams over the years and are excited to continue to elevate this effort in the future. Most recently, Minnesota hosted a team from Africa that visited the Duluth Seaway Port Authority, toured the CHS Export Terminal, met with Riverland Ag regarding storage in Duluth, wheat farms and elevators throughout Northern Minnesota.

“Most of our interaction with overseas customers has been possible because of U.S. Wheat Associates and the Northern Crops Institute,” said Vogel. “This face to face interaction is where we have a chance to tell our story and demonstrate the value and quality of Minnesota Wheat to our customers.”

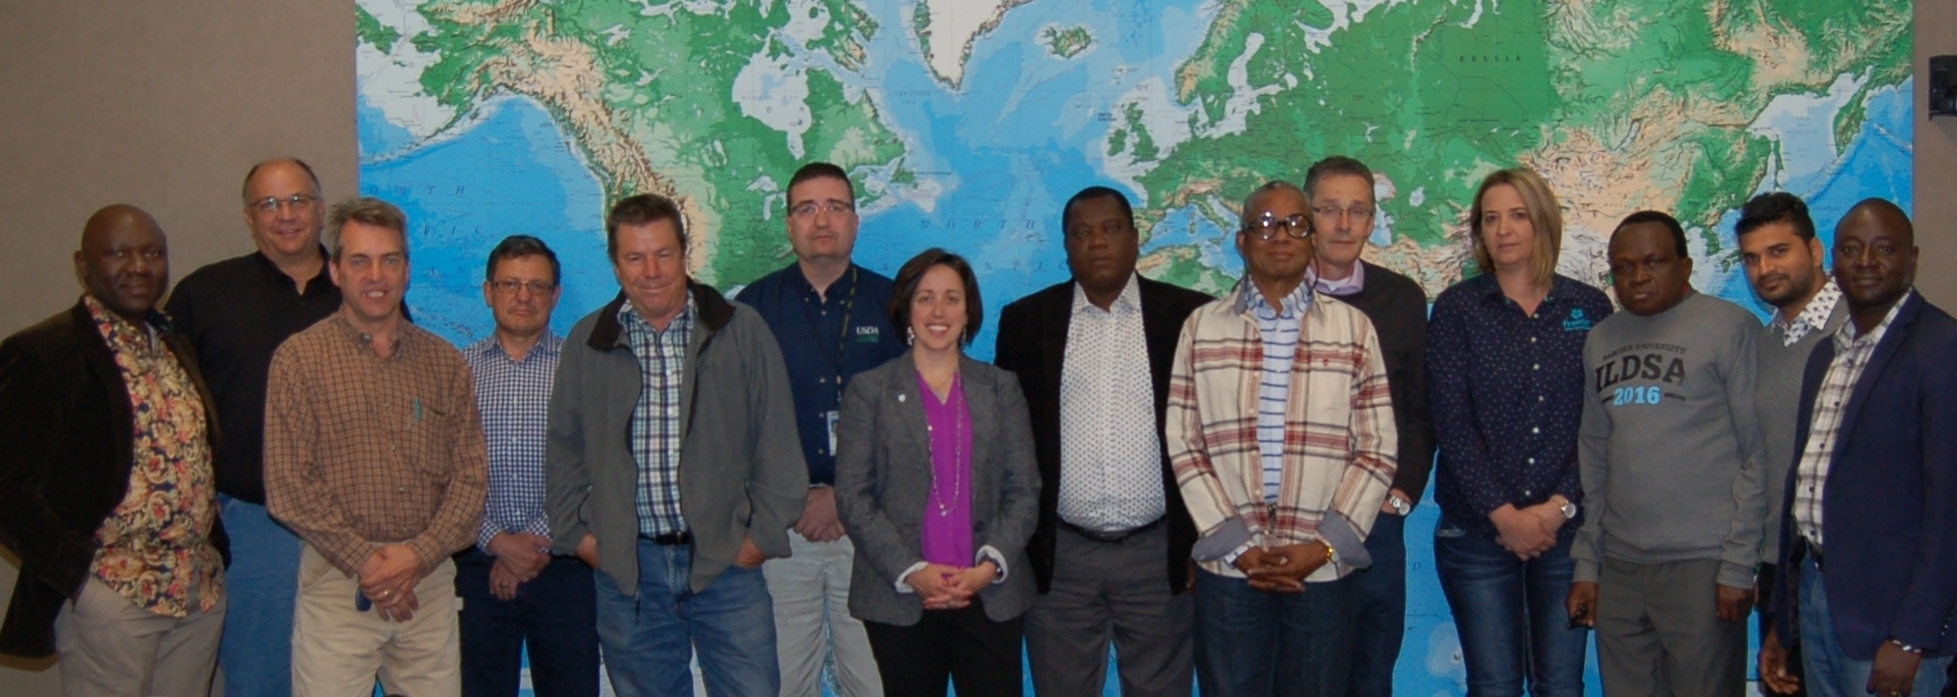
In 2017, a USW Regional African trade delegation visited farmers in Minnesota.

What is happening lately in Minnesota that overseas customers should know about?

University of Minnesota wheat breeders and private breeders are increasing their emphasis on improving wheat quality in our varieties. They are making strides in improving yield that helps farmers, but at the same time, elevating the level of quality wheat we’re able to provide. Historically, HRS wheat in Minnesota produces a high protein product and a high-quality baking experience.

“Minnesota growers are by far the most progressive people I’ve ever worked with in terms of weighing economic, environmental and consumers demands,” said Vogel. “They look beyond the farm gates, to a bigger picture of the customers we serve around the world.”

Learn more about the Minnesota Wheat Research & Promotion Council on its website and on Facebook and Twitter.


Greg LeBlanc (fourth from right), a farmer from Minnesota, participated on the 2016 USW Board Team that traveled to Japan and Korea.

Minnesota representatives Mark Jossund (second from left) and Kevin Leiser (third from left) at the 2016 USW Board of Directors Summer Meeting.

Minnesota Wheat CEO Charlie Vogel with USW Market Analyst Claire Hutchins and South Dakota Wheat CEO Reid Christopherson at the Northern Commodity Transportation Conference in Bloomington, MN, in March 2020.


thumbnail

The 2019 U.S. hard red spring wheat (HRS) crop is one of contrasts with above average yields and high protein, but with key kernel parameters impacted by harvest rains. Due to the unusual harvest conditions and delay, the entire crop is not represented in this year’s data. Functional performance of the 2019 crop shows weaker dough properties and lower absorption but excellent baking properties. Premium quality will command higher prices, but good value can be obtained with diligent contract specifications. Ample carryover from the excellent quality 2018 crop will be helpful in meeting traditional quality needs of buyers.

That is a summary of the major regional results for HRS from the upcoming U.S. Wheat Associates (USW) 2019 Crop Quality Report. The HRS Wheat Quality Lab at North Dakota State University collected and analyzed 781 HRS samples collected from Minnesota, North Dakota, South Dakota, Montana, Idaho and Washington state. Funding for the annual survey come from USW member state wheat commissions and the USDA Foreign Agricultural Service. Complete 2019 crop quality data for all six U.S. wheat classes will soon be available online and at annual USW Crop Quality Seminars.

Weather and Harvest: Planting begin in late April and was slow but ended in early June. Frequent and widespread rains developed across the region in mid-June, boosting yield potential but also elevating disease pressures. Harvest began slowly in mid-August with about 50% of the crop harvested by Sept. 1. By mid-September, record rains interrupted harvest and affected the quality of the remaining crop. About 10% of the crop will not be harvested. Regional production is estimated at 559 mil bu (15.2 MMT), up 8% percent from the 5-year average but down 5% from 2018 on reduced planted area.

Wheat and Grade Data: For the portion of the crop surveyed, the average grade is U.S. No. 1 Northern Spring (NS), down from No. 1 Dark Northern Spring (DNS) in 2018; 85% of Eastern Region samples and 87% of Western Region samples grade U.S. No. 1.  Average test weight of 60.7 lb/bu (79.8 kg/hl) is lower than 2018 and the 5-year average. Average damage is 1.0%, up notably from 2018 with higher damage levels in Eastern samples. Overly wet harvest conditions resulted in a very low vitreous kernel (DHV) average of 52% compared to the 5-year average of 74%. Average DHV is 61% for Western samples and 44% for Eastern.

Even with record yields and low DHV, the crop averages 14.4% (12% mb) protein, similar to 2018 and slightly above the 5-year average, which adds value to the crop. Western average protein is 14.4%, down marginally from 2018, while Eastern average protein held steady at 14.3%. One-half of all samples have greater than 14.5% protein in 2019 with just 18% below 13.5% protein.The heaviest pressure from Fusarium head blight occurred across southern parts of the region. The crop’s overall DON average is 0.6 ppm, up from 0.3 ppm in 2018. Average thousand kernel weight (TKW) is 31 g, similar to the 5-year average. Falling numbers (FN) across the entire region averaged 339 sec, down from 403 in 2018.

Flour, Dough and Baking Data: Buhler laboratory mill flour yield averages 68.4%, higher than 2018 and the 5-year average. Flour ash increased slightly to 0.54%, compared to 0.52% a year ago. Wet gluten averages 34%, slightly lower than 2018. Amylograph values average 406 BU for 65 g of flour, down sharply from 2018 and the 5-year average, with the lowest values in Eastern samples.

Farinograph indicates the crop has 1.3 percentage point lower absorption compared to 2018, but similar to the 5-year average, with Western area average at 63.6% and Eastern area at 62.1%.  The average farinograph stability is 10.1 min, lower than 2018 and the 5-year average. Dough strength is similar across the region with the Eastern crop declining more compared to the 2018 crop and with no correlating increase at higher protein levels; the Western area does show increased dough strength at higher protein levels.

Alveograph and extensograph analyses show more extensibility and less resistance. The average alveograph P/L ratio is 0.61 compared to 0.72 in 2018, and the W-value is 342 (10-4 J), down from 415 last year. The overall extensibility and resistance to extension of the 135 min extensograph are 15.6 cm and 639 BU, notably more extensible than 2018 crop values of 13.2 and 855.

The average loaf volume is 1026 cc, up notably from 973 in 2018; Western area averages 1004 cc and Eastern area averages 1046 cc. Average bake absorption is 67.6%, down from 2018 but higher than the 5-year average. Bread scores are similar to 2018 with the Western area scoring slightly higher than the Eastern area.

thumbnail

By Claire Hutchins, USW Market Analyst

Despite the potential for reduced U.S. hard red spring (HRS) production year-over-year and crop quality concerns on late-harvested HRS, the United States is still well-stocked to meet overseas customer needs throughout marketing year (MY) 2019/20. As domestic sellers and buyers manage their risk in a dynamic market, however, overseas buyers should expect HRS export basis to increase. U.S. Wheat Associates (USW) wants to provide a closer analysis of this rather unique situation.

Unrelenting precipitation in the Northern Plains continued to challenge HRS wheat producers throughout the 2019 harvest season. Excess moisture on unharvested wheat can lead to low falling numbers, reduced test weights, reduced percentage of DHV and increased DON levels. By Sept. 20, only 76 percent of the country’s spring wheat was harvested compared to 96 percent in 2018.

As markets considered potential quality issues on the rest of the harvest, HRS export prices jumped significantly between Sept. 13 and Sept. 20. The average Gulf HRS 14.0 (12% moisture basis) export basis for nearby delivery increased 20 cents/bu from $1.40/bu to $1.60/bu. In the same week, average Pacific Northwest (PNW) HRS 14.0 export basis for nearby delivery jumped 36 percent from $1.05/bu to $1.65/bu. Market uncertainty carried into the week of Sept. 27 when the country’s HRS harvest was only 87 percent complete, well behind the 5-year average of 99 percent. By Sept. 27, the average Gulf HRS 14.0 export basis increased another 30 cents to $1.90/bu and the average PNW HRS 14.0 export basis added 27 percent to $2.10/bu, both driven by crop quality concerns and minimal farmer selling.

Source: U.S. Wheat Associates Price Report, Oct. 4, 2019

In its October World Agricultural Supply and Demand Estimates (WASDE) report, USDA estimated the United States would produce 15.2 million metric tons (MMT) of HRS in 2019. On Oct. 15, USDA reported harvest was 94 percent complete, still well behind the average completion date of around Sept. 30. Many industry sources now believe the HRS harvest is essentially over as farmers struggle to enter their fields due to ongoing precipitation, including heavy snow in parts of North Dakota and Montana. If realized, this would put the total 2019 U.S. HRS harvest closer to 14.3 MMT, 12 percent lower than last year.

As noted, the United States is still well-stocked to meet export throughout MY 2019/20. Industry experts estimate between 60 and 65 percent of this year’s HRS harvest, about 8.94 MMT, is high-quality, milling grade wheat. USDA estimated 2019 HRS beginning stocks at 7.16 MMT. This puts the total supply of U.S. milling wheat in MY 2019/20, including the remainder of last year’s excellent harvest, at 16.1 MMT.

However, customers should be aware that a large portion of these stocks remain in storage as farmers are reluctant to sell wheat at current local prices. HRS export basis levels continue to climb because producers have several incentives to hold their high-quality HRS into the coming months.

First, Minneapolis Grain Exchange (MGEX) forward futures contracts show a significant carry between December 2019 and December 2020. As of the last trade on Oct. 15, the December 2019 MGEX HRS futures contract (MWEZ19) traded at $5.45/bu while the December 2020 MGEX HRS futures contract (MWEZ20) closed at $5.95/bu. Each MGEX HRS futures contract gains about 10 cents per contract period starting in December 2020, a reason for farmers to hold supplies until cash prices increase.

Source: MGEX

Second, average local basis levels are firming across the Northern Plains, which signals to farmers that the discount between futures values and the cash price they receive could shrink over time. For example, according to DTN data, the average HRS local basis value in North Dakota decreased from negative $0.79/bu to negative $0.72/bu between Sept. 30 and Oct. 15. At one elevator in North Dakota, the gap between the December futures price and the local cash price shrank 42 percent from negative $1.05/bu to $0.65/bu. Over the same period, the local average HRS cash price in North Dakota increased from $4.66/bu to $4.74/bu.

Finally, storage space is not under pressure. Typically, HRS moves into the market around harvest and when storage space is needed for row crop harvest, which in 2019 has seriously affected in the Northern Plains. For example, the heavy snow hit North Dakota with only 1 percent of the corn harvest and 16 percent of the soybean harvest completed. With no other crops coming out, farms and country elevators do not yet need to move much HRS wheat out of storage.

Given this situation, USW believes HRS export basis will continue to rise until local cash prices increase enough to encourage producers to liquidate their HRS stocks into the milling and export channels. The United States has plenty of high-quality HRS available to sell into MY 2019/20, but it will take a significant shift in local cash price dynamics across the Northern Plains for these supplies to reach export terminals.


thumbnail

By Claire Hutchins, USW Market Analyst

On Sept. 30, USDA released its Small Grains Summary noting that 2019/20 U.S. wheat production increased to 53.3 million metric tons (MMT), up 4 percent from last year due to significant improvements in yield despite lower planted area. While this is still 2 percent below the 5-year average of 54.2 MMT, the production volume coupled with significant carry-in stocks ensure that the U.S. wheat remains the most reliable supply for 2019/20. Here is a look at 2019/20 U.S. wheat production by class.

USDA’s Small Grains Summary indicates U.S. wheat yields offset a reduced planted area for 2019/20.

Hard Red Winter (HRW). Last fall, U.S. farmers decreased HRW planting in the U.S. Southern and Central Plans due to extremely wet conditions which delayed the soybean harvest and in turn HRW planting. A slight uptick in planted area in Montana and South Dakota partially offset reductions in other states. Total U.S. HRW planted area fell 2 percent year-over-year to 22.7 million acres (9.19 million hectares), 15 percent below the 5-year average of 26.6 million acres (10.8 million hectares). Cool temperatures and favorable moisture during the growing season boosted HRW yields substantially year-over-year in Kansas, Nebraska and Oklahoma. In Kansas, the largest HRW producing state, a higher average yield offset lower planted area and production increased 22 percent over 2018/19 levels to 338 million bushels (9.17 MMT). USDA estimates total 2019/20 HRW production increased 26 percent over last year to 834 million bushels (22.7 MMT).

Hard Red Spring (HRS). Cold soil temperatures and excessive moisture in certain areas delayed HRS planting across much of the Northern Plains. USDA says U.S. farmers planted 12.0 million acres (4.86 million hectares), 6% below last year but slightly higher than the 5-year average of 11.8 million acres (4.78 million hectares). A cool summer boosted HRS yields in Montana and South Dakota. Heavy, persistent rain has severely delayed the 2019 HRS harvest. According to USDA, as of September 30, U.S. spring wheat harvest is only 90 percent complete compared to the 5-year average of 99 percent. USDA estimates 2019 HRS production will total 558 million bushels (15.2 MMT), 5 percent lower than 2018, but 8 percent higher than the 5-year average of 518 million bushels (14.1 MMT).

Soft Red Winter (SRW). Last fall, U.S. farmers planted 5.54 million acres (2.24 million hectares) of SRW, down 6 percent from the year prior and 18 percent from the 5-year average of 6.7 million acres (2.71 million hectares) due to low wheat prices compared to soybeans and delayed planting. Excessive moisture continued through the growing season and slowed harvest progress in many places. USDA reported SRW production totaled 239 million bushels (6.50 MMT), down 16 percent from last year and 31 percent below the 5-year average of 348 million bushels (9.46 MMT).

White Wheat (Soft White, Club and Hard White). U.S. white wheat planted area fell 4 percent below 2018/19 levels to 3.95 million acres (1.60 million hectares). Mild growing conditions and good soil moisture in the Pacific Northwest (PNW) supported above-average winter and spring wheat yields. The average white winter wheat yield in Oregon increased 1.0 bu/acre (.067 MT/hectare) over last year to 68.0 bu/acre (4.57 MT/hectare) in 2019. Slightly lower planted area and above-average yields kept U.S. white wheat production stable year-over-year at 273 million bushels (7.43 MMT) and 8 percent higher than the 5-year average of 252 million bushels (6.87 MMT).

Durum. Anticipating less-than break even prices, farmers planted less durum area this year. In its Small Grains 2019 Summary, USDA estimated 1.34 million acres (542,000 hectares) were planted to durum, down 35 percent from 2018/19 and 32 percent below the 5-year average of 2.0 million acres (664,000 hectares). USDA estimated total 2019/20 U.S. durum production at 57.3 million bushels (1.57 MMT), down 26 percent from last year. Cool, wet weather boosted yields in the U.S. Northern plains. Both Montana and North Dakota durum yield potential reached a record high in 2019. The country’s average durum yield also reached a record high of 44.8 bu/acre (3.01 MT/hectare), up 13 percent from last year. However, as with HRS, a significant portion of the northern durum crop has not yet been harvested. Desert Durum® production fell 46 percent year-over year to 5.67 million bushels (154,000 MT) due to sharply lower planted area in both Arizona and California.

thumbnail

By Claire Hutchins, USW Market Analyst

Though early April is the ideal planting window for U. S. hard red spring (HRS) wheat, saturated fields and cold soil temperatures kept many farmers out of their fields until late May or early June this year. The same precipitation and cool temperatures that delayed planting boosted early HRS development through mid-June and helped reduce concerns about late planting from central Montana to western Minnesota. Now, scattered precipitation and high humidity across the Northern Plains are preventing many farmers from entering their fields to begin the spring wheat harvest. According to USDA’s August 19 Crop Progress report, only 16% of the country’s spring wheat harvest was complete compared to last year’s 56% and the 5-year average of 49%. In spite of the delay, USDA rates 70% of U.S. spring wheat in good to excellent condition and an average yield of 49.2 bu/acre (3.30 MT/hectare), up from last year’s 48.3 bu/acre (3.25 MT/hectare). USDA predicts the country will produce 597 million bushels (16.2 million metric tons (MMT)) of HRS in 2019.

USW gathered some additional information from our stakeholders in HRS production states.

Minnesota. “It’s been a good year for wheat. The crop looks great and we expect above average yields and average protein levels despite delays,” says Charlie Vogel, Executive Director of the Minnesota Wheat Research & Promotion Council. Farmers in Minnesota, the second largest HRS-producing state in the country, are expected to harvest 91.7 million bushels (2.5 MMT) of wheat in 2019, down slightly from 2018 levels as reduced planted area offset increased expected yields. According to Vogel, Minnesota farmers have barely begun the spring wheat harvest due to scattered precipitation throughout the state. In an average year, farmers would be about 88% complete by now compared to the 14% reported by USDA. In the west, farmers are swathing their wheat in windrows to dry it out before combining. With a cool, dry weather forecast for the next 10 days, Vogel expects Minnesota’s harvest to progress nearly to completion by next week if dry conditions hold.

In Montana, the third largest HRS-producing state in the country, cold and wet soil conditions widened the spring planting window from mid-April to early June. A dry July helped farmers who were able to get their HRS in the ground early, but could hurt yields for late-planted HRS. The Montana spring wheat harvest has been “slow and frustrating” according to Cassidy Marn, Marketing Program Manager at the Montana Wheat & Barley Committee, as rainy, cold weather poured over the southern two thirds of the state around August 10. Marn believes these conditions have delayed the HRS harvest by about 3 days on average and by as much as two to three weeks in some places. Montana’s spring wheat harvest, at 20% complete, is far behind last year’s pace of 42% and the five-year average of 44%. When Montana’s farmers do complete harvest, they are expected to see an average 34.0 bu/acre (2.28 MT/hectare) in 2019, 2.0 bu/acre higher than last year’s yield, according to USDA. Montana’s HRS crop is expected to total 85.0 million bushels (2.31 MMT) this year, down 11% from last year as reduced planted area more than offsets increased expected yields.

North Dakota. “Spring wheat harvest had a sluggish start, but is beginning to accelerate. It is an above-average crop and we are waiting to see how rains impact harvest pace,” says Jim Peterson, Policy and Marketing Director at the North Dakota Wheat Commission. North Dakota is the largest HRS-producing state in the country and is expected to produce 320 million bushels (8.70 MMT) in 2019. Cool, wet weather delayed spring wheat planting but boosted yield potential in the central and southern part of the state. In north-central North Dakota, HRS yields could be lower than USDA’s predicted 50.0 bu/acre (1.36 MT/hectare) due to unusually dry conditions that affected the crop throughout the summer. As of August 18, only 12% of the state’s HRS was harvested compared to 55% last year and the 5-year average of 43%. Peterson predicts the state’s HRS harvest could take off in the next couple of days if a pocket of cool, dry weather rolls through the state.

South Dakota. According to Reid Christopherson, Executive Director of the South Dakota Wheat Commission, “HRS harvest is extremely delayed. Unfortunately, the crop is ready to harvest; however, moisture and mud in the fields have stalled progress. Extreme humidity and frequent rains have allowed only a few hours of harvest per day when field conditions permit access.” Only 27% of the state’s HRS harvest is complete compared to last year’s 89% and the 5-year average of 75%. Based on early harvest data, South Dakota HRS test weights and protein levels look good, but continued moisture throughout the harvest could reduce kernel color. USDA expects South Dakota HRS yields to increase 12% over last year to 42.0 bu/acre (2.82 MT/hectare), but production is expected to fall 10% year-over-year as reduced planted area offsets increased expected yields.

thumbnail

Originally printed in Dakota Gold, June 2019, Volume 35, No. 3; Reprinted with permission from the North Dakota Wheat Commission

In May, Dr. Senay Simsek, Professor and Wheat Quality Specialist with North Dakota State University (NDSU), traveled to the Philippines and Indonesia with U.S. Wheat Associates (USW) to meet with millers and end-users of U.S. wheat. The objective of the visits and seminars was to provide technical assistance to mills to improve their efficiency to produce flour that meets their local needs. USW staff included Peter Lloyd, Andres Saturno Eguren, Ivan Goh, Joe Sowers and Matt Weimar.

The seminars and technical visits to the mills were intense, and included presentations on Cereal Chemistry at the Mill, Biochemistry Behind Solvent Retention Capacity (SRC), and Food Safety in the Mill and Understanding Mycotoxins. These presentations are likely baffling to any that don’t have a cereal chemistry or cereal science degree, so it may be hard to understand how this type of activity helps U.S. wheat producers.

Wheat milling and baking with flour may seem like simple, straight forward tasks, but in reality, getting the correct flour from various classes and grades of wheat that corresponds into the end-use products consumers want is a complicated task.

“Dr. Simsek presents information to overseas millers and bakers that gives them an advantage in producing superior products,” says Joe Sowers, USW Regional Vice President for the Philippines and Korea. “The Philippine wheat foods industry is expanding very quickly, creating a huge demand for training and information. Dr. Simsek’s specialized expertise of HRS [hard red spring] is incredibly useful for the Philippine millers and bakers. She offers a depth of knowledge in cereal chemistry useful to the most experienced miller and baker while still accessible to newer entrants to the industry.”

All of the seminars, meetings and trainings were arranged by U.S. Wheat Associates.

Over a century of investment in HRS breeding has yielded an ideal raw material for Philippine baked goods while nearly 60 years of market development work has helped make it the largest foreign market in the world for the class. In 2018/19, the Philippines imported 68 million bushels of HRS, a historic record for any country in the world. Total U.S. sales of all wheat classes to the Philippines were almost double that at 120 million bushels.

Sales of HRS into Indonesia are not quite as robust due to a strong U.S. dollar and low flour prices. However, successes by USW in familiarizing the milling industry with the U.S. marketing system and gaining confidence in U.S. grain inspection protocols have led to average annual total wheat sales exceeding 35 million bushels, up nearly five-fold from the previous 5-year average. HRS sales last year were about 7 million bushels.

Matt Weimar, USW Regional Vice President for South Asia sees potential for growth of HRS sales. “We are optimistic that current economic and demographic trends will increase disposable income and consumer interest in higher quality end products, which often involve using HRS,” says Weimar. “Also, the Indonesian industry is quite different from others. The bread baking industry is dominated by thousands of small entrepreneurs, which represent about 65% of the bread market and their mixing equipment isn’t ideal for handling HRS.”

USW is working diligently through training programs such as this and targeted short courses to show customers the benefits of using U.S. wheat. Programs carried out by USW helps U.S. producers gain and maintain a foothold in some of the most competitive wheat markets in the world.

Header Photo Caption: Dr. Simsek (middle) discusses bread quality in Indonesia.

thumbnail

By Claire Hutchins, USW Market Analyst

Despite challenging market factors, U.S. wheat exports for marketing year (MY) 2018/19, which ended May 31, totaled 25.8 million metric tons (MMT) (948 million bushels), in line with USDA’s adjusted export volume estimate. That is 9% ahead of MY 2017/18 and 1% ahead of the 5-year average of 25.5 MMT (937 million bushels). Commercial sales of all classes of wheat in MY 2018/19 exceeded 2017/18 levels due to abundant exportable supplies, excellent harvest qualities, competitive export prices and sustained service from U.S. Wheat Associates (USW) representatives supported by its state commissions and USDA’s Foreign Agricultural Service programs. This offset the bearish factors including a strong U.S. dollar, competitor’s advantages, uncertainty about U.S. trade policies and difficult inland transportation logistics.

Hard Red Winter. USDA reported hard red winter (HRW) 2018/19 sales totaled 9.40 MMT (345 million bushels), 1% above 2017/18 and 1% above the 5-year average of 9.30 MMT (342 million bushels). Customers took advantage of the highest quality HRW crop in several years at attractive export prices compared to 2017/18. Out of the Gulf, between Jan. 1 and May 31, 2019, the average export price of U.S. HRW 12.0 protein (12% moisture basis) cost $227/metric ton (MT) compared to $257/MT over the same period in 2018. Sales to Mexico and Nigeria were up 6% and 36% respectively, while sales to Japan were down 6%. Sales to Mexico totaled 2.15 MMT (79.0 million bushels), 44% above the 5-year average of 1.49 MMT (55.0 million bushels), once again making Mexico the top HRW buyer. Commercial sales to Iraq, now the fourth-largest consumer of U.S. HRW, were in line with 2017/18 levels at 674,000 metric tons (MT) (24.7 million bushels).

Soft Red Winter. 2018/19 soft red winter (SRW) sales increased 33% year-over-year to 3.33 MMT (123 million bushels), still 14% below the 5-year average of 3.92 MMT (144 million bushels) despite difficult inland transportation logistical issues due to major flooding on the Mississippi River and its tributaries. The 2018/19 SRW crop boasted higher protein levels and good extensibility, making it a valuable blending ingredient for cookies and cakes. A steady decline in SRW futures prices between mid-December 2018 and mid-May 2019 encouraged strong commercial sales to top SRW-importing regions. Export sales to three of the top five SRW purchasers increased or remained steady compared to 2017/18. Sales to Mexico, the top importer of U.S. SRW, increased 25% over last year to 917,000 MT (33.6 million bushels) and sales to Peru, the fifth-largest importer of U.S. SRW, increased 13% over last year to 175,000 MT (6.46 million bushels). Export sales to Nigeria held strong at 272,000 MT (9.96 million bushels).

Hard Red Spring. By the end of MY 2018/19, hard red spring (HRS) export sales totaled 7.15 MMT (263 million bushels), 16% ahead of last year’s pace, despite a 94% decrease in commercial sales to China, formerly the fourth-largest importer of U.S. HRS. A 60% year-over-year increase in HRS production, at 16.0 MMT (588 million bushels), higher ending stocks, high protein content and competitive export prices all supported export sales. Gulf exports of HRS 14.0 protein between Jan. 1 and May 31, 2019, cost, on average, $263/MT compared to $305/MT over the same period in 2018. Seven of the country’s top ten HRS-importing partners increased commercial sales year over year. Commercial sales to the Philippines, the top importer of U.S. HRS, jumped to 1.85 MMT (68.0 million bushels) in 2018/19, 39% ahead of last year and 38% ahead of the 5-year average of 1.34 MMT (49.2 million bushels).

White wheat. Total commercial sales of soft white (SW) and hard white (HW) wheat climbed to 5.45 MMT (200 million bushels) in 2018/19, which includes about 165,000 MT of HW sales to Nigeria. That is slightly ahead of last year’s pace and 21% ahead of the 5-year average of 4.51 MMT (166 million bushels) due to increased production, increased exportable supplies and below-average protein levels compared to years prior. Sales to the Philippines and Japan, the top two importers of U.S. SW, respectively, increased 13% and 7% over 2017/18 levels. The Philippines purchased 1.32 MMT (48.9 million bushels) of SW compared to 1.17 MMT (43.0 million bushels) in 2017/18. White wheat sales to Japan increased to 889,000 MT (32.7 million bushels) compared to 829,000 MT (30.4 million bushels) in 2017/18.

Durum. USDA reported 2018/19 durum sales at 504,000 MT (19.8 million bushels), up 24% from the year prior, but 12% below the 5-year average of 573,000 MT (21.0 million bushels). Increased production, high protein content, excellent kernel characteristics and competitive prices throughout the marketing year all supported northern durum export levels. Increased sales to four of the five top markets for U.S. durum boosted export figures. The European Union (EU) purchased 290,000 MT (10.7 million bushels) of U.S. durum in 2018/19, up 71% year-over-year following a drought that cut production in many EU countries.

thumbnail

By Claire Hutchins, USW Market Analyst

(Revised April 5, 2019)

According to the March 29 USDA Prospective Plantings report, U.S. total spring-planted wheat area will fall to an estimated 14.2 million acres (5.75 million hectares), 7% below 2018/19, if realized. The estimate includes 12.4 million acres of hard red spring (HRS), down 2% from last year, if realized. USDA expects U.S. durum planted area to total 1.42 million acres (575,000 hectares), 25% below 2018/19 and 30% below the 5-year average. Farmers in the top four spring wheat producing states of North Dakota, Montana, South Dakota, and Minnesota are expected to decrease total spring wheat planted area year over year on price and weather concerns.

USDA expects a 150,000 acre (61,000 hectare) increase in North Dakota HRS area from 2018 to 6.7 million acres (2.71 million hectares), a 7% increase over the 5-year average, if realized. At the same time, USDA expects the state to decrease its planted durum area by 32% from last year. Currently, HRS commands a premium over durum at local elevators, prompting the decline in North Dakota’s durum planted area from 1.10 million acres (445,000 hectares) in 2018 to 750,000 acres (304,000 hectares) in 2019. Farmer frustration is evident in recent planting trends. In 2019, 11% of North Dakota spring wheat acres will go to durum compared to 23% in 2017.

Dr. Frayne Olson, crop economist and marketing specialist at North Dakota State University, told U.S. Wheat Associates (USW) the increase in HRS over durum planted area in the past few years is driven by the inversion in cash premiums for both classes.

“Four years ago, in 2015, farmers received $1.90 per bushel more for durum than HRS. And three years ago, in 2016, the durum premium over HRS was $1.20 per bushel,” Dr. Olson said. “Now, HRS commands a premium of between $0.12 per bushel to $0.41 per bushel premium over the top durum grade.”

USDA forecast Montana spring wheat planted area at 2.60 million acres (1.05 million hectares), down 10% from 2018/19. According to Cassidy Marn, marketing program manager with the Montana Wheat & Barley Committee, farmers are on track to begin planting by the third week in April, barring an unforeseen weather event, but are seeking more profitable alternatives to spring wheat. However, Marn added, more profitable choices are difficult to find because “the pulse market isn’t strong, and neither is the market for durum.” Mike Krueger, an independent market analyst based in North Dakota, suggests Montana farmers are more likely to leave would-be spring wheat acres fallow than to plant alternative crops like dry peas or barley.

Minnesota HRS planted area is expected to decrease 5% from 2018/19 levels to 1.53 million acres (62,000 hectares). Krueger believes the state’s final area planted to HRS in 2019 will fall below the USDA’s estimate due to price and weather concerns.

“In the fall, there was a lot of enthusiasm for HRS because the initial 2019 CRC insurance price for spring wheat is $5.77.  That compares to $6.31 a year ago,” Krueger said.

He believes Minnesota farmers will convert more 2019 spring wheat acres to soybeans because, despite trade disputes with China, the domestic soybean market is firmer on average than the markets for corn and wheat. Soybeans may be the most viable alternative if record precipitation keeps Minnesota farmers out of the fields for the next 20 to 30 days, forcing them out of the ideal spring wheat planting window.

Competitive Soybeans. Comparing average and recent cash prices, relative stability can offer an incentive for farmers in North Dakota and Minnesota to plant more soybeans than spring wheat. This year, wet conditions could also favor more soybean planting. 


South Dakota 2019/20 HRS planted area is forecast at 1.02 million acres (41,000 hectares), down 3% from last year. Reid Christopherson, executive director of the South Dakota Wheat Commission, said the USDA’s estimate may be a little optimistic given current weather and price conditions in the state. In the fall, producers were enthusiastic about converting harvested soybean acres to winter wheat, before extremely wet conditions delayed harvest and winter planting. Then, he said, hope for strong wheat markets persisted into the spring until the “bomb cyclone” hit the state, leaving many would be HRS acres buried under 30 to 43 cm. of snow. Now, he expects, spring wheat planting in South Dakota to be delayed until the third or fourth week in April. Christopherson said, “Late planting and low market prices will prompt producers to plant more row crops in 2019 than spring wheat, despite earlier intentions.”

On April 1, USDA also updated the country’s winter wheat planted area from the February forecast. Total U.S. winter wheat area is now expected to hit 31.5 million acres (12.8 million hectares), up 200,000 acres (81,000 hectares) from the February forecast, but still 3% below the planted area for 2018/19 harvest. USDA now forecasts HRW planted area at 22.4 million acres (9.07 million hectares), up slightly from the previous projection, but still 3% below the year prior and 10% below the 5-year average on delayed planting. Soft red winter (SRW) planted area for 2019 harvest decreased from the previous estimate to 5.55 million acres (2.25 million hectares), 5% below 2018/19 planted area. The first USDA Crop Progress report of 2019, released April 1, indicated 56% of the country’s winter wheat to be in good to excellent condition.

USDA expects white wheat acres, planted in both winter and spring, to fall to 3.9 million acres (1.57 million hectares) for 2019/20, down 5% from 2018/19 and the 5-year average of 4.1 million acres (1.66 million hectares). The U.S. Drought Monitor shows adequate moisture for wheat-growing regions clustered in northeastern Oregon, southeastern Washington and north-central Idaho. However, central Washington and Oregon are experiencing abnormally dry to moderate drought conditions. Still, USDA reported that the majority of the white wheat crop in those three states is in good to excellent condition.

Planted area reductions for all classes bring the total wheat planted area for 2019 harvest down to 45.8 million acres (18.5 million hectares), 4% below 2018 and 7% below the 5-year average, making this year’s total wheat planted area the lowest since USDA records began in 1919.

thumbnail

By Erica Oakley, USW Director of Programs

As a key part of its commitment to transparency, each year U.S. Wheat Associates (USW) produces an annual Crop Quality Report that includes grade, flour and baking data for all six U.S. wheat classes. The report is compiled from sample testing and analysis conducted during and after harvest by our partner laboratories. The report provides essential, objective information to help buyers get the wheat they need at the best value possible.

The 2018 USW Crop Quality Report is now available for download in English, Spanish, French and Italian, and will be available in Chinese and Arabic soon. USW also shares more detailed, regional reports for all six U.S. wheat classes on its website, as well as additional information on its sample and collection methods, solvent retention capacity (SRC) recommendations, standard deviation tables and more.

USW’s annual Crop Quality Seminars are already underway and will continue over the next month around the world. USW invites its overseas customers, including buyers, millers and processors, to these seminars led by USW staff, U.S. wheat farmers, state wheat commission staff and educational partner organizations. The seminars dive into grade factors, protein levels, flour extraction rates, dough stability, baking loaf volume, noodle color and texture and more for all six U.S. wheat classes, and are tailored to focus on the needs and trends in each regional market.

In 2018, USW is projected to host 41 seminars in 28 countries.

Customers have previously shared that they use the report throughout the year as a reference manual and to guide them through purchases and future planning. The seminars provide a first look at the overall crop and a deep dive into the data and how to use it. Customers will often use the seminars and report as educational training for new employees.

The reports and seminars have been a traditional part of USW’s strategy since 1959, growing to become its single largest marketing activity.

thumbnail

Growing conditions over most of the U.S. hard red spring (HRS) wheat production area helped produce a 2018 crop with many positive features for buyers. There is greater supply of high-grade HRS with above average protein levels and very good dough and bake qualities. In general, many quality features are balanced across the region with some variation in grade factors, DON and dough strength.

At an estimated 16.0 million metric tons (MMT), this is the largest HRS crop in 22 years and up significantly from 2017 with higher planted area and a record national average yield.

Here is a summary of the season and test results, with full data available online soon and in upcoming USW Crop Quality Seminars. As always, U.S. Wheat Associates (USW) reminds buyers to be diligent with contract specifications to ensure they receive the quality they need.

Weather and Harvest: Planting began in late April, later than normal, and continued to be slow until mid-May. Most of the crop was planted by early June. Then rain established a robust stand and good early growth. Drier conditions later in the season accelerated maturity and harvest started in late July; most of the crop was harvested by mid-September.

Wheat and Grade Data: The average grade is a U.S. No. 1 Dark Northern Spring (DNS), up from U.S. No. 1 Northern Spring (NS) in 2017. The overall average test weight is 62.2 lb/bu (81.7 kg/hl), higher than in 2017 and the 5-year average. Average damage is 0.3 percent, up from 2017, and shrunken and broken kernels average is 1.0 percent, similar to 2017. The crop shows excellent kernel color with average vitreous kernel content (DHV) of 87 percent compared to 71 percent for the 5-year average. Average DHV is 90 percent for Western samples and 84 percent for Eastern.

The average protein is 14.5 percent (12 percent mb), similar to 2017. Western average protein is 14.6 percent, down slightly from 2017, while Eastern average protein held steady at 14.4 percent.

Disease pressures were higher than in 2017. The overall DON average is 0.3 ppm, ranging from 0.0 to 0.2 ppm for Western composites and from 0.5 to 0.7 ppm for Eastern composites. Thousand kernel weight (TKW) is slightly higher than 2017 at 31.1 grams. A dry harvest period supported a high average falling number of 399 sec, indicating sound wheat.

Flour, Dough and Baking Data: Buhler laboratory mill flour yield averages 67.8 percent, down 3.5 percent from 2017, but similar to the 5-year average. Flour ash fell to 0.52 percent, compared to 0.58 percent a year ago. Wet gluten averages 35.3 percent. Amylograph values average 635 BU for 65 g of flour, up notably from 2017 and the 5-year average.

Farinograph dough tests indicate slightly higher absorption than last year with the Western region average at 65.2 percent and Eastern at 63.0 percent. The average farinograph stability is 10.8 min, similar to 2017 and the 5-year average. The Eastern crop has slightly stronger dough properties compared to the Western, but dough strength increases at higher protein levels in both regions.

Alveograph and extensograph analyses show more resistance and less extensibility. The average alveograph P/L ratio is 0.61 compared to 0.72 in 2017, and the W value is 415 (10-4 J) compared to 360 in 2017. The overall extensibility and resistance to extension of the 135 min extensograph are 13.2 cm and 855 BU compared to 2017 crop values of 13.5 and 770.

The average loaf volume is 973 cc, up marginally from 968 in 2017 with Western volumes down slightly but Eastern volumes higher. Average bake absorption is 69.6 percent, up sharply from both last year and the 5-year average. Bread scores are slightly lower in both Western and Eastern crops compared to 2017.