thumbnail

By Stephanie Bryant-Erdmann, USW Market Analyst

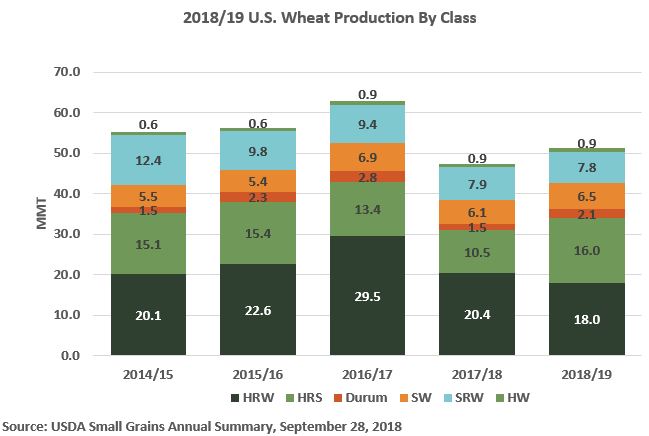
On Sept. 28, USDA released its Small Grains Summary noting that 2018/19 U.S. wheat production increased to 51.3 MMT, up 8 percent from last year due to improvements in both average yield and harvested area. While this is still 8 percent below the 5-year average of 55.8 MMT, the 2018/19 production coupled with significant carry-in stocks ensure that the U.S. wheat store will remain open and well-stocked throughout 2018/19. Here is a look at 2018/19 U.S. wheat production by class.

Hard red winter (HRW). Last fall, U.S. farmers increased HRW planting in the U.S. Southern Plains due to favorable moisture conditions. That slight increase was not enough to offset decreased planted area in the U.S. Northern Plains where a long-term drought delayed, and in some cases, prevented winter wheat planting. Planted area in Montana fell 6 percent year over year. USDA reported HRW planted area at 23.2 million acres (9.39 million hectares), down 2 percent from 2017. Unfortunately, most of the Southern Plains received little to no moisture until spring, with some areas going from October to April without measurable precipitation. The poor weather caused Oklahoma wheat farmers to abandon 43 percent of their winter wheat area, up from both the 5-year average and the 2017/18 abandonment rate of 36 percent. The average HRW yield in Kansas and Oklahoma, the top two HRW-producing states, decreased 21 percent and 18 percent from 2017/18, respectively. With the drought causing both harvested area and average yields to fall, USDA estimates total 2018/19 HRW production dropped 12 percent to 662 million bushels (18.0 MMT). Though smaller in volume, 2018 HRW quality i is excellent. Read more here.

Hard red spring (HRS). Wet conditions slowed HRS planting but replenished depleted soil moisture across the drought stressed Northern Plains. USDA says U.S. farmers planted 12.1 million acres (4.90 million hectares) to HRS, up 17 percent from the year prior. The beneficial moisture boosting average HRS yields and harvested area. In North Dakota, the top HRS producing state, the average yield climbed 20 percent year over year to a record high 49.0 bu/acre (3.29 MT per hectare), up 41 percent from 2017/18. Idaho farmers also produced record high HRS yields. USDA now reports HRS production at 587 million bushels (16.0 MMT), up 53 percent from 2017/18.

Soft red winter (SRW). Last fall, U.S. farmers planted 5.85 million acres (2.37 million hectares) of SRW, up 4 percent from the year prior, but still 23 percent below the 5-year average. While planting conditions were generally favorable, depressed prices kept planted area low. In early 2018, several U.S. SRW growing areas received excessive moisture that decreased yield potential and the wet weather continued through harvest. USDA reported SRW production totaled 286 million bushels (7.78 MMT), down 2 percent from 2017/18 and 33 percent below the 5-year average of 429 million bushels (11.7 MMT). Read more here.

White wheat (including soft white, club and hard white). U.S. white wheat planted acres stayed close to the 5-year average at 4.15 million acres (1.68 million hectares) in 2018/19. A wet winter boosted yield potential for both the winter and spring crops. The average spring white wheat yield in Washington increased 20 percent to 54.0 bu/acre (3.63 MT per hectare). The slight increase in harvested area and significant improvement in average yields pushed 2018/19 total white wheat production to 272 million bushels (7.41 MMT), a 5 percent increase year over year, and 8 percent above the 5-year average of 252 million bushels (6.86 MMT).

Durum. Farmers planted less durum area this year in response to lower prices and large carry-out stocks during spring planting. USDA estimates 2.00 million acres (810,000 hectares) were planted to durum, down 13 percent from 2017/18 but still 9 percent above the 5-year average of 1.84 million acres (745,000 hectares). USDA estimated total 2018/19 U.S. durum production at 77.3 million bushels (2.10 MMT), up 41 percent from last year. Generally favorable weather boosted yields in the U.S. Northern Plains, with average durum yields increasing to 39.3 bu/acre (2.64 MT per hectare), up 13.3 bu/acre from last year when drought severely impacted the crop. Desert Durum® production fell 8 percent year over year to 10.5 million bushels (385,000 MT) due to sharply lower planted area in both Arizona and California.

thumbnail

By Amanda J. Spoo, USW Assistant Director of Communications

This week, the Wheat Quality Council hosted its annual hard red spring (HRS) and durum crop tour. Participants spent three days mainly in North Dakota surveying this year’s crop and estimating yield. The tour, which surveyed a total of 342 fields, estimated weighted average HRS yield at 41.1 bushels per acre (bu/a), slightly higher than last year’s HRS average of 38.1 bu/a, which was impacted by ongoing drought conditions in western areas. The durum weighted average yield was 39.3 bu/a, in line with last year’s average of 39.7 bu/a, which was a decline from 45.4 bu/a in 2016. While the overall crop looks better than last year, it is still below the tour’s 5-year average of 45.4 bu/ac.

Participants on the tour always represent a wide range of the wheat industry, including millers, traders, farmers, researchers, government officials and media who travel along eight distinct routes covering most of the state’s wheat production.

“The continuing success of this tour is that we make it a value-added experience,” said Wheat Quality Council Executive Vice President Dave Green. “We keep training more and more people and that makes a difference across this industry.”

On the first day, participants drove west from Fargo to Bismarck, with two routes going farther into the western part of the state, and others covering western Minnesota and northern South Dakota. The Day 1 weighted average yield was 41.1 bu/a, up from 38.8 bu/a in 2017. For HRS specifically, the yield was 41.3 bu/a, down from 37.9 bu/a in 2017. The scouts surveyed 138 fields on Day 1, of which 135 were HRS and 3 were durum.

On Day 2, the tour surveyed 148 fields, 135 of which were HRS and 13 were durum. The group moved from Bismarck to Devils Lake. The overall average for Day 2 was 38.8 bu/a, up from 35.7 in 2017. For HRS, the yield was 38.3 bu/a, up slightly from 35.8.

The third day of the tour included a half day of crop surveying. The participants then all returned to North Dakota State University’s Northern Crops Institute in Fargo to compile the overall crop report. On Day 3, participants surveyed at total of 55 HRS fields and one durum field. The Day 3 weighted average yield for HRS was 45.6 bu/a, down slightly from 46.2 bu/a in 2017.

The results reflect a snapshot of yield potential observed by the participants in the fields they scouted.

“I think what we saw was kind of encouraging in part because there had been concern about scab with this crop, but we saw a lot of spraying for it; and we never felt that more than a handful of fields had a serious scab problem,” said Green. “And we were scouting for it, so we were very positive about what we saw.”

Green added, “I’m also positive that we thought we were headed for a lower protein record relative to how good everything looked going in, but I wouldn’t say the same thing now that we’ve seen the crop. I think it is going to have a wide range of protein and a lot of choices for buyers. I would anticipate that with the heat that us on the crop, the quality is going to be better than normal.”

View highlights and photos from the tour by searching #wheattour18 on Facebook and Twitter. For more information and for results from previous tours, visit the Wheat Quality Council’s website at www.wheatqualitycouncil.org.

thumbnail

By Stephanie Bryant-Erdmann, USW Market Analyst


There is an old saying: “When there’s blood on the streets, buy property.” Given recent price movements, that could easily be changed to: “When trade policies are in the news, buy wheat.”


Since the steel and aluminum tariffs went into full effect for major U.S. wheat customers, September Kansas City hard red winter (HRW) wheat futures have fallen 51 cents per bushel ($19 per metric ton [MT]), September Chicago soft red winter (SRW) wheat futures dropped 25 cents per bushel ($9 per MT) and Minneapolis hard red spring (HRS) plunged 58 cents per bushel ($21 per MT).


Seasonal harvest pressure always impacts U.S. wheat prices during the summer months; however, this year the unique trade environment is also pressuring export demand and driving U.S. wheat prices lower. As of July 19, U.S. export sales for marketing year 2018/19 (June 1 to May 31) totaled 6.43 MMT, down 32 percent year over year. Exporters note that customers are choosing to purchase smaller than normal volumes of U.S. wheat, just what they need for the short-term or are waiting to make purchases, noting uncertainty about U.S. trade policies and their own countries’ retaliatory measures. Sales to the top five U.S. wheat customers — Mexico, Japan, the Philippines, Korea and Nigeria — are 27 percent behind last year’s pace.


Futures v Global S&D

U.S. wheat futures prices are not reflecting global supply and demand realities. Buyers are uncertain about the effects of unforeseen tariff wars and have altered their typical wheat import cadences.

With trade policy issues dominating the headlines, U.S. wheat futures markets are mostly ignoring global wheat supply and demand fundamentals, which can be seen in competitors’ wheat prices. The average global wheat price is up 41 cents per bushel ($15 per MT) with larger increases noted in Australia and Argentina, which compete with the United States in key quality-driven markets. According to International Grains Council (IGC) data, the average price of Australian wheat is up $19 per MT and the average price of Argentine wheat is up $75 per MT. These price increases are driven by increased global wheat demand, shrinking global wheat supplies and their location.


USDA noted in last week’s World Agricultural Supply and Demand estimates that global wheat production will fall to 737 MMT in 2018/19, the first drop in 5 years and down 3 percent from 2017/18. Decreased production is expected in the European Union (EU), Russia, Ukraine, Kazakhstan, and Australia. While the United States, Canada and Argentina are expected to have increased production, exporter supplies are expected to fall 20.2 MMT year over year.


Simultaneously, many importers are engaging in “just in time” purchases since wheat price movement has rewarded their patience the last few years. USDA expects importer ending stocks to fall to 49.8 MMT in 2018/19, the lowest amount in a decade.


While importer stocks are shrinking, USDA expects global wheat demand to surge to a new record high of 749 MMT, 4 percent above the 5-year average. That means that global wheat consumption will outpace global wheat production by 12.6 MMT this year and drop the global wheat stocks-to-use ratio (excluding China) to less than 20 percent. A level that has not been seen since 2007/08.


For perspective, in July 2007 all three wheat futures were above $6.00 per bushel ($220 per MT) and would continue climbing until March 2008 when prices peaked at $11.60 per bushel ($426 per MT) for SRW, $12.17 per bushel ($447 per MT) for HRW and $17.30 per bushel ($636 per MT) for HRS. On Friday, July 20, those three futures were at $5.16 per bushel ($190 per MT), $5.08 per bushel ($187 per MT) and $5.55 per bushel ($204 per MT), respectively, indicating there is a lot of room for upward mobility.


With exporter supplies shrinking and importers continuing a “just in time” purchasing pattern, global wheat prices are sitting on a powder keg that trade policy issues are currently disguising. Customers should take advantage of current U.S. futures price levels and lock in the competitive prices.


To track U.S. wheat export prices, subscribe to the USW Weekly Price Report.

U.S. Wheat Associates Board of Directors Header

Generally cool spring conditions delayed the start of the 2018/19 U.S. winter wheat harvest, but the combines are now in the fields and U.S. Wheat Associates (USW) published a preliminary Harvest Report on May 25. USW Harvest Reports are published every Friday afternoon, Eastern Daylight Time, throughout the season with updates and comments on harvest progress, crop conditions and current crop quality for hard red winter (HRW), soft red winter (SRW), hard red spring (HRS), soft white (SW) and durum wheat.

The weekly Harvest Report is a key component of USW’s international technical and marketing programs. It is a resource that helps customers understand how the crop situation may affect basis values and export prices.

USW’s 14 overseas offices share the report with their market contacts and use it as a key resource for answering inquiries and meeting with customers. USW also publishes the report in Spanish as  “Trigonoticias,” distributed to Latin American wheat buyers and millers and posted on www.uswheat.org.

Anyone may register to subscribe to an email version of the Harvest Report. For the first time this year, USW includes links in the email to additional wheat condition and grading information, including the U.S. Drought Monitor, USDA/NASS Crop Progress and National Wheat Statistics, the official FGIS wheat grade standards and USDA’s World Agricultural Supply and Demand Estimates report. Harvest Reports are also posted online at www.uswheat.org/harvest.

thumbnail

By Stephanie Bryant-Erdmann, USW Market Analyst

With the small, stressed hard red winter (HRW) wheat crop getting the lion’s share of attention, it was an initial surprise to read in USDA’s May World Agricultural Supply and Demand Estimates (WASDE) that U.S. wheat production is expected to increase to 49.6 million metric tons (MMT) in 2018/19. That would be up 5 percent year over year, if realized.

The forecast increase is a result of greater harvested area and slightly higher average yield in the other classes. USDA forecast 2018/19 all wheat average yield at 46.8 bushels per acre (3.15 metric tons [MT] per hectare), up from 46.3 bushels per acre (3.11 MT per hectare) last year. Harvested area is expected to increase 1.3 million acres (526,000 hectares) in 2018/19. Crop condition ratings also matter in this forecast, and as the following by-class reviews show, HRW is clearly the exception to the up-trend in production.

HRW production is expected to be the smallest since 2006/07 at 17.6 MMT. If realized, that would be down 14 percent year over year and 22 percent below the 5-year average. Low farm-gate prices and poor planting weather last fall reduced 2018/19 U.S. HRW planted area to 23.2 million acres (9.4 million hectares), the second lowest planted area on record. That poor start coupled with widespread drought throughout the U.S. Southern Plains set up the current situation where harvested HRW acres are expected to fall 5 percent from 2017/18 to 16.5 million acres (6.68 million hectares).

The large decrease in harvested acres is centralized in the U.S. Southern Plains where HRW crop condition ratings remain poor. In top HRW-producing states of Kansas, Oklahoma and Texas, 51 percent, 65 percent, and 59 percent of HRW is rated poor or very poor, respectively. As a consequence of the drought and resulting poor crop conditions, USDA expects harvested area in Oklahoma to fall 31 percent year over year to 2.0 million acres (810,000 hectares). On May 10, USDA rated 25 percent of HRW in the states surveyed in good to excellent condition, while 45 percent is rated poor or very poor. Read more about the all too evident challenge of wheat farming on the High Plains.

Soft red winter (SRW) production is expected to increase to 8.57 MMT in 2018/19. If realized, that would be up 8 percent year over year, but still 22 percent below the 5-year average. 2018/19 U.S. SRW harvested area is expected to increase 8 percent from the year prior to 4.0 million acres (1.62 million hectares). USDA also expects record high yields in Indiana, Kentucky, Maryland and Michigan due to favorable growing conditions this spring.

On May 14, USDA noted week over week crop condition rating improvements in nearly all SRW-growing states, with 67 percent of the SRW acres surveyed rated good to excellent. Week over week improvements were noted in Illinois and Arkansas where 63 percent of SRW was rated good to excellent, up 10 percentage points and 5 percentage points, respectively, from the week prior.

White wheat.* 2018/19 white winter wheat production is forecast at 6.24 MMT, including 5.66 MMT of soft white (SW) winter wheat and 577,000 MT of hard white (HW) winter wheat. If realized, SW winter wheat production would be up 2 percent year over year, due to increased planted area, while HW winter wheat production would be down 11 percent from 2017/18 due to forecast reduction in average yield. SW winter wheat production is centralized in the Pacific Northwest (PNW) states of Idaho, Oregon and Washington. As of May 14, 71 percent of Idaho SW, 80 percent of Oregon SW and 85 percent of Washington SW was rated in good to excellent condition.

Desert Durum®. USDA expects Desert Durum® production — centralized in Arizona and California and planted in the winter — to total 332,000 MT, up 6 percent from 2017/18 due to significantly better yields in California. In Arizona, the Desert Durum® crop was 90 percent headed by April 29, significantly ahead of the year prior’s pace.

Spring wheat and Northern durum. Snow covered, frozen fields delayed spring wheat and Northern durum planting this year, but U.S. farmers are beginning to catch up. As of May 14, spring wheat and durum planting is 58 percent complete, up from just 30 percent complete the week prior, but still behind the 5-year average pace of 67 percent.

With spring planting still underway, USDA did not provide a by-class breakdown of production for hard red spring (HRS) and durum on May 10. However, USDA did note that combined spring wheat and Northern durum production is projected to increase 34 percent year over year due to “both increased area and yield.” With total U.S. wheat production projected at 49.6 MMT and U.S. winter wheat production projected at 32.4 MMT, that puts 2018/19 spring wheat — including soft white spring, HRS, and hard white spring — and durum production at 17.2 MMT.

Back on March 29, USDA projected U.S. HRS planted area at 12.1 million acres (4.9 million hectares). If farmers are able to realize their planting intentions despite the late start, that would be up 17 percent year over year. Northern durum planted area was forecast at 1.88 million acres (760,000 hectares), down 14 percent, if realized. Still, weather will play a role in farmers’ decisions, and a late spring in Montana and western North Dakota tends to favor increased wheat area. Conversely, it tends to favor increased corn and soybean acres in Minnesota.

To stay in touch with U.S. wheat harvest progress, subscribe to the U.S. Wheat Associates Weekly Harvest Reports, which will start later this month.

*In the May 10 report, USDA combined data for soft white winter wheat and hard white winter wheat. Both soft white (SW) and hard white (HW) can be grown in either the spring or fall. USDA will provide a wheat by-class outlook in July. Similarly, data for HRS, SW spring, HW spring and spring-planted durum were combined into a general “spring-planted wheat” category.

thumbnail

By Stephanie Bryant-Erdmann, USW Market Analyst

According to the March 29 USDA Prospective Plantings report, U.S. total spring-planted area will jump to an estimated 14.1 million acres (5.71 million hectares), 12 percent above 2017/18, if realized. The estimate includes 12.1 million acres (4.90 million hectares) of hard red spring (HRS), up 17 percent from 2017, if realized. It is important to note that this is an estimate, as farmers in the top four HRS producing states of Minnesota, Montana, North Dakota and South Dakota have not started planting due to extremely cold, snowy weather across the region.

USDA expects a 1.05 million acre (425,000 hectare) increase in North Dakota spring wheat area, which is forecast at 6.40 million acres (2.59 million hectares). If realized, that would be up 20 percent year over year. Spring wheat acres in Minnesota are also expected to increase 38 percent from 2017/18 levels to 1.6 million acres (648,000 hectares). South Dakota 2018/19 HRS planted area is forecast at 1.05 million acres (425,000 hectares), up 80,000 acres (32,000 hectares). However, the planting window for spring wheat in North Dakota and Minnesota is no more than three weeks; after that the yield potential starts to decrease and farmers choose to plant alternative crops.

“This cold, wet spring could work against spring wheat planting in eastern North Dakota and western Minnesota,” said Mike Krueger, an independent market analyst based in North Dakota. “Farmers in these areas are reluctant to plant spring wheat after late April and right now the forecast is calling for another two weeks of cold weather and snow. If planting is delayed until May, we will probably see a switch to soybeans or other crops.”

USDA forecast Montana HRS planted area at 2.50 million acres (1.00 million hectares), in line with 2017/18 planted area. But, in contrast to eastern North Dakota and western Minnesota, the late spring may increase HRS planted acres in parts of Montana according to Cassidy Marn, marketing program manager with the Montana Wheat & Barley Committee.

“Farmers in Montana have fewer alternatives and, since we can only grow limited quantities of corn and soybeans here, wheat tends to be the last alternative,” said Marn. “Planting peas and lentils is possible, but given the amount of snow we still have on frozen ground, some farmers could miss the window for those crops. Planting spring wheat in June is not ideal, but it is preferable to planting nothing.”

USDA expects U.S. durum planted area to total 2.00 million acres (809,000 hectares), down 13 percent from 2017/18, if realized. The predicted decline is driven in large part by USDA’s expectation that North Dakota farmers will switch from durum to HRS or oilseed crops due to lower returns on durum in recent years. In addition, growers near the border are frustrated by a large volume of durum freely crossing the border from Canada that increases pressure on durum prices. Weather conditions will also affect durum planting decisions.

USDA also updated the winter wheat planted area from its January 2018 estimate, increasing winter wheat planted area by 50,000 acres (20,000 hectares) to 32.7 million acres (13.2 million hectares). The new estimate is still 2 percent below the 2017/18 planted area. The increase came from hard red winter (HRW) area, estimated at 23.2 million acres (9.39 million hectares), up slightly from the previous projection, but still 2 percent below the year prior and 17 percent below the 5-year average.

The decreased HRW planted area makes crop conditions even more crucial. The April 2 USDA Crop Progress report rated 10 percent of Kansas HRW, 9 percent of Oklahoma HRW and 17 percent of South Dakota winter wheat as good, with virtually none of the crop rated as excellent in those states.

Soft red winter (SRW) planted area decreased from the previous estimate to 5.85 million acres (2.37 million hectares), but is still 4 percent above 2017/18 planted area. Overall, conditions for SRW are similar to what growers faced at the same time last year with a majority of the crop rated in good to excellent condition.

USDA expects white wheat acres — planted in both winter and spring — to reach 4.15 million acres (1.68 million hectares) for 2018/19, up 3 percent from 2017/18, but in line with the 5-year average. The U.S. Drought Monitor shows adequate moisture for Washington, but southern Idaho and Oregon are experiencing abnormally dry to moderate drought conditions. Still, USDA reported that the majority of the white wheat crop in those states are in good to excellent condition.

The expected increase in spring wheat area would increase total U.S. wheat planted area to 47.3 million acres (19.1 million hectares) in 2018/19, up 3 percent year over year. The increase was unexpected, but if realized it would still be the second lowest planted wheat area since 1919 when USDA records began.

As always, spring brings the waiting game — all we can do is watch how the crops respond to conditions going forward.

thumbnail

By Stephanie Bryant-Erdmann, USW Market Analyst

Total U.S. planted wheat area will rise 500,000 acres (202,000 hectares) in 2018/19 due to an expected increase in spring wheat area (including durum) according to Joanna Hitchner of the USDA World Agricultural Outlook Board. The USDA held its annual Agricultural Outlook Forum on Feb. 22 to 23, where Hitchner presented the 2018/19 Grain and Oilseeds Outlook.

USDA forecasts 2018/19 combined spring wheat and durum planted area at 13.9 million acres (5.63 million hectares). If realized, that would be up 2 percent from 2017/18 and the largest spring and durum planted area since 2015/16. Increased spring wheat and durum planted area is expected to more than offset the lowest U.S. winter wheat planted area since 1909. USDA currently estimates 2018/19 (June to May) wheat acreage at 46.5 million acres (18.8 million hectares), a one percent increase from last year, if realized.

Wheat buyers should note that factors affecting planting decisions can change before seed is sown. Long-term dry conditions in top hard red spring (HRS) and durum producing states of Montana, North Dakota and South Dakota may significantly alter farmers’ plans.

In January, USDA reported U.S. farmers planted 32.6 million acres (13.2 million hectares) of winter wheat last fall, down slightly from 2017/18, but 15 percent below the 5-year average. Increases for soft red winter (SRW) and white wheat offset a decrease in hard red winter (HRW). USDA assessed 2018/19 HRW planted area at 23.1 million acres (9.35 million hectares), down 2 percent from 2017/18 with planted acreage down year over year in nearly every HRW-producing state. However, 2018/19 total SRW planted area of 5.98 million acres (2.42 million hectares) increased 4 percent from last year, and white winter wheat planted area increased to an estimated 3.56 million acres (1.44 million hectares), up 1 percent from the prior year. Winter durum planting in the Southwestern United States was estimated at 74,000 acres (30,000 hectares), down 41 percent from 2017/18 and 51 percent below 2016/17.

Based on trend yields, USDA expects the national average yield to grow to 47.4 bushels per acre, up from 46.3 in 2017/18 due to expected increases in spring and durum wheat yields which were hard hit by last year’s drought. USDA projects the wheat harvested-to-planted ratio will increase to 0.83, up slightly from last year’s 0.82 due to a small decrease in expected abandonment rates. Total U.S. 2018/19 wheat production is forecast to rise by 6 percent year over year to 50.0 million metric tons (MMT).

In addition to lower planted area for winter wheat, crop conditions for many HRW-producing states are deteriorating due to sustained drought conditions. On Feb. 26, USDA rated 12 percent of Kansas winter wheat in good to excellent condition, down from 14 percent at the end of December. Winter wheat condition remained unchanged in Oklahoma with just 4 percent rated good to excellent, but declined in Colorado, Montana, Nebraska, North Dakota and South Dakota. SRW conditions improved in Illinois, where 45 percent of the winter wheat crop was rated in good to excellent condition compared to 38 percent last month. USDA will resume weekly U.S. crop progress reports in April.

A decrease in carryover stocks is expected to offset increased production, and the total U.S. wheat supply is expected to fall in 2018/19. USDA forecasts 2018/19 U.S. supplies at 77.5 MMT, down 2 percent from 2017/18, if realized, in part because USDA anticipates a slight increase in domestic use, from 30.4 to 30.7 MMT.

Price competition and large supplies in other wheat exporting countries will continue to pressure demand for U.S. wheat. USDA expects U.S. exports to fall to 25.2 MMT, down 3 percent from the forecasted 2017/18 U.S. wheat export level of 25.9 MMT.

To read more from the USDA Outlook Forum or to download presentations, please visit https://www.usda.gov/oce/forum/.

To see the latest Drought Monitor, please visit https://droughtmonitor.unl.edu/

thumbnail

By Stephanie Bryant-Erdmann, USW Market Analyst

In the Nov. 2, 2017, issue of “Wheat Letter,” we analyzed the tight supply of high protein U.S. wheat (minimum of 13.0 percent protein at 12 percent moisture basis (mb)) and its effects on pricing. The latest production and quality analysis suggests that global high protein wheat production in marketing year 2017/18 is down as much as 39 percent from average. That strengthens the conclusion that price premiums will continue at least into the first quarter of marketing year 2018/19 (June to May).

Based on available data, U.S. Wheat Associates (USW) has estimated that the world’s wheat suppliers produce about 50 million metric tons (MMT) of high protein wheat in an “average” year. Of that total, USW estimated that about 27 MMT on average are available to export markets, including:

  • 0 MMT of hard red spring (HRS) from the United States;
  • 0 MMT of Canadian Western Red Spring (CWRS);
  • 0 MMT from Kazakhstan, Russia and Ukraine; and
  • 0 MMT of Australian Prime Hard (APH) and Australian Hard (AH).

Looking at 2017/18, high protein wheat production was well below average.

USDA data showed that total U.S. HRS production was down 26 percent year over year at 10.5 MMT, with about 9.0 MMT having at least 13.0 percent protein (12 percent mb). Roughly half of U.S. HRS is exported annually, putting U.S. high protein HRS exports at 4.5 MMT. Carry-in stocks from 2016/17 totaling 6.4 MMT push total HRS supply higher, and potentially also enlarge the supply of high protein HRS. In 2016/17, the average protein was 14.6 percent (12 percent mb), but the protein content of the remaining stocks carried into 2017/18 is unknown. Year to date, the Federal Grain Inspection Service has inspected 3.94 MMT of HRS, 98 percent of which had at least 13.0 percent protein (12 percent mb), and USDA reported an additional 1.26 MMT of HRS sales that have not yet shipped as of Jan. 25. To meet that demand, high protein HRS stocks will need to be pulled out of storage, indicating premiums for HRS are unlikely to shrink in 2017/18.

Of the 19.2 MMT of CWRS produced in 2017/18, about 78 percent, or 15.0 MMT, graded #1 CWRS according to Canadian International Grains Institute (CIGI) data. The average protein for #1 CWRS is 13 percent (12 percent mb), with roughly 75 percent of #1 CWRS samples averaging above 13.0 percent (12 percent mb). If production values match sampling ratios, then Canada produced roughly 11.0 MMT of high protein wheat in 2017/18. On average, Canada exports roughly 70 percent of total wheat production putting total high protein wheat exports at an estimated 8.0 MMT. Weber Commodities, a Canadian-based analyst firm, believes Canada carried in just 1.0 MMT of high protein stocks, putting the estimated total Canadian high protein wheat exportable supply at 9.0 MMT.

Black Sea high protein exports are expected to fall to 3.0 MMT — all from Kazakhstan — due to above average rainfall that significantly lowered protein levels in Russian and Ukrainian wheat.

Australian Prime Hard is only produced in Queensland and New South Wales where La Niña-related drought conditions have sharply cut yields. Generally dry conditions are also expected to hurt Australian Hard wheat yields. USW estimates that Aussie high protein exportable supplies will only reach about 1.5 MMT.

The shrinking supply of high protein wheat can be seen in the prices of the top suppliers. According to the International Grains Council (IGC), the average price for 13.5 percent protein (12 percent mb) HRS exported from the Pacific Northwest (PNW) is up 16 percent year over year. IGC uses the Canadian designation of CWRS as 13.5 percent protein (13.5 percent mb). It reports CWRS prices from both Vancouver and St. Lawrence show an increase of 24 percent year over year. Meanwhile, lower protein wheat producers, such as Argentina, have seen prices fall 4 percent year over year due to the large supply of lower protein wheat.

Here is a table summarizing USW’s estimate of the big cut in global high protein wheat supplies in 2017/18 compared to an average, or “typical” year.

                                    Average Export Supply            2017/18 Estimated Supply

U.S. HRS                        6.0 MMT                                   4.5 MMT

CWRS                          11.0 MMT                                    8.0 MMT

Black Sea                       7.0 MMT                                   3.0 MMT

APH/AH                          3.0 MMT                                   1.5 MMT

Total                            27.0 MMT                                  17.0 MMT

thumbnail

By Stephanie Bryant-Erdmann, USW Market Analyst

Six months into marketing year 2017/18 (June to May), total U.S. export sales of 19.5 million metric tons (MMT) are 8 percent behind last year’s pace according to USDA Export Sales data through Jan. 4. However, the estimated total value of U.S. wheat export sales is 4 percent greater than last year on the same date at $4.72 billion, due to slightly higher export prices according to USDA Export Sales data and USW Price Report data.

A deeper analysis of USDA data shows total sales to six of the top 10 U.S. export markets in 2016/17 are ahead of last year’s pace, demonstrating strong demand for U.S. wheat. Sales of soft red winter (SRW) and soft white (SW) are both ahead of last year’s pace. USDA projects total 2017/18 exports will fall slightly to 26.5 MMT, which, if realized, would be 8 percent below 2016/17 but 1 percent above the 5-year average pace.

USDA reported hard red winter (HRW) year-to-date exports at 7.79 MMT, down 10 percent from the prior year. Still, 2017/18 export sales are 10 percent ahead of the 5-year average due to competitive prices for medium protein HRW and the good, overall quality of this year’s crop. The estimated value of year-to-date HRW export sales is 6 percent above 2016/17 due to a 14 percent increase in the average U.S. HRW free-on-board (FOB) price that is supported by the increased premiums for HRW with higher protein. Mexico is currently the number one HRW purchaser. As of Jan. 4, HRW sales to Mexico totaled 1.58 MMT, up 28 percent from last year’s pace. Sales to Indonesia are also up 28 percent year over year at 430,000 metric tons (MT). HRW purchases by Algeria total 456,000 MT, more than double last year’s sales on this date. To date, HRW sales to Venezuela totaling 120,000 MT are nearly four times great than the 2016/17 pace.

Both export sales volume and value of SRW for 2017/18 are up due to the excellent quality of this year’s crop and relatively competitive pricing. Export sales are up 7 percent year over year at 2.02 MMT, boosting estimated export sales value to $400 million, or 12 percent more so far this year. As of Jan. 4, total sales to 11 of the top 20 U.S. SRW export markets from 2016/17 are higher than last year. Sales to Colombia are 12 percent ahead of 2016/17 at 198,000 MT. Nigerian SRW purchases total 234,000 MT, up 12 percent from last year. Sales to other Central and South American countries, including Brazil, Peru, Panama, Venezuela and El Salvador, are also ahead of the 2016/17 pace.

Hard red spring (HRS) sales of 5.15 MMT are down 25 percent year over year and 7 percent below the 5-year average. Higher prices due to smaller 2017/18 production have slowed HRS exports thus far in 2017/18, but global demand for HRS is strong. Year-to-date in 2017/18, the average FOB price of HRS is $293 per metric ton ($7.97 per bushel), compared to $241 per metric ton ($6.55/bu) in 2016/17, according to USW Price Report data. As of Jan. 4, buyers in Japan purchased 878,000 MT, up 20 percent from 2016/17. Sales to Taiwan of 518,000 MT are up 17 percent from last year’s sales on the same date. The Philippines continues to import the largest volume of HRS, though at a 6 percent slower pace so far.

As of Jan. 4, exports of soft white (SW) wheat are up 22 percent year over year at 4.30 MMT. That is 28 percent greater than the 5-year average. Sales to the top 10 SW customers are ahead of last year’s pace, supporting an estimated export value of $896 million, up 25 percent from the prior year. Philippine millers purchased 946,000 MT, up 16 percent compared to last year’s sales on the same date. South Korean sales are up 43 percent at 674,000 MT. U.S. SW sales to China, Thailand and Indonesia are also up. Year-to-date, Indonesia has purchased 515,000 MT, compared to total 2016/17 purchases of 270,000 MT. Thailand sales are up 18 percent year over year at 217,000 MT. Chinese purchases of 306,000 MT are already greater than 2016/17 total SW sales.

Year to date durum exports total 272,000 MT, down 32 percent from the same time last year, and below the 5-year average, with tighter supplies and resulting higher prices. The average export price for U.S. durum is up 5 percent over last year at this time according to USW Price Report data. To date, Nigeria, the European Union (EU), Algeria and Guatemala are the top durum buyers. A significant portion of the first quarter 2017/18 sales is designated as “sales to unknown designations.

thumbnail

By Stephanie Bryant-Erdmann, USW Market Analyst

As the Dec. 12 World Agricultural Supply and Demand Estimate (WASDE) confirms, global wheat supplies are at a record high this year. USDA increased its estimate for 2017/18 global wheat production to 755 million metric tons (MMT), up slightly from 2016/17 and a new record high. If realized, it would be the fifth consecutive year of increased global wheat production.

The record large global wheat production has pressured U.S. wheat futures to six and twelve-month lows. Since the beginning of the 2017/18 marketing year, the Chicago Board of Trade (CBOT) soft red winter (SRW) wheat futures and the Kansas City Board of Trade (KCBT) hard red winter (HRW) wheat futures have fallen 37 cents and 32 cents, respectively to levels not seen since last December. The Minneapolis Grain Exchange (MGEX) hard red spring (HRS) wheat futures climbed in July, supported by concerns over severe drought in the U.S. Northern Plains, but has since fallen to within 14 cents of the June 2 price. This decline in wheat futures prices represents a significant opportunity for customers to lock in low futures values to hedge the risk of growing protein premiums due to the tight global supply of high protein wheat.

The USDA report also noted that lower year over year wheat production for 2017/18 was reported in Canada, Kazakhstan, Ukraine and the United States, and is also expected in Australia. This is important for customers needing high protein wheat, because nearly all the world’s high protein wheat exports (13 percent protein on a 12 percent moisture basis (mb) or higher) originate from those five countries plus Russia.

While Russian wheat yields exceeded expectations and boosted total production, high protein wheat supplies are very limited according to the Federal Centre of Grain Quality and Safety Assurance for Grain and Grain Products (Centre) preliminary data for winter wheat. According to Centre data, 25 percent of samples graded as Russian 3rd class wheat (10.5 to 11.9 percent protein on a 12 percent mb); 44 percent of the samples graded as Russian 4th class wheat (8.8 to 10.5 percent protein on a 12 percent mb); and 31 percent as 5th class wheat (feed wheat). Less than 1 percent of samples graded as Russian 2nd class wheat (11.9 to 12.8 percent protein on a 12 percent mb).

With global high protein wheat supplies shrinking for the second consecutive year and demand continuing to be strong, the premium between MGEX and KCBT wheat futures has continued to widen. In 2016/17, the inter-market spread between MGEX and KCBT averaged $1.05 compared to just 40 cents the prior marketing year. Year to date in 2017/18, the MGEX to KCBT spread averages $2.09.

The demand for higher protein wheat also supports HRW protein export basis spreads, which have widened significantly this year at both Gulf and Pacific Northwest (PNW) ports. Over the past 15 years, the average premium for 12 percent protein (12 percent mb) at the Gulf has been 14 cents per bushel. This year that premium is $1.96 per bushel. The 15-year average premium for 12 percent protein HRW at the PNW is $1.09 per bushel. Since the beginning of the 2016/17 marketing year on June 1, that average premium is $1.94 per bushel.

Despite the increased premiums for high protein HRW and HRS, a review of USDA Federal Grain Inspection Service (FGIS) data reveals an increased percentage of high protein exports. Seventy-seven percent of 2017/18 HRS exports have at least 14 percent protein (12 percent mb), compared to the 5-year average of 70 percent. The percentage of HRW exports of 13 percent protein and above (12 percent mb) is double the 5-year average.

With six months left in the marketing year, many customers are securing their high protein wheat demands for the year. While premiums for high protein continue to grow, U.S. wheat futures markets have fallen for four straight weeks, which offers a good opportunity for customers to lock in the lowest HRS futures prices seen since June and the lowest SRW and HRW futures prices since last December.

Please call your local U.S. Wheat Associates (USW) representative if you have any questions about the U.S. wheat marketing system or U.S. wheat supply.