For 40 years, U.S. wheat farmers have supported U.S. Wheat Associates’ (USW) efforts to work directly with buyers and promote their six classes of wheat. Their contributions to state wheat commissions, who in turn contribute a portion of those funds to USW, qualifies USW to apply for export market development funds managed by USDA’s Foreign Agricultural Service. Currently, 17 state wheat commissions are USW members and this series highlights those partnerships and the work being done state-by-state to provide unmatched service. Behind the world’s most reliable supply of wheat are the world’s most dependable people – and that includes our state wheat commissions.
Member: Idaho Wheat Commission
Member of USW since 1980
Location: Boise, Idaho
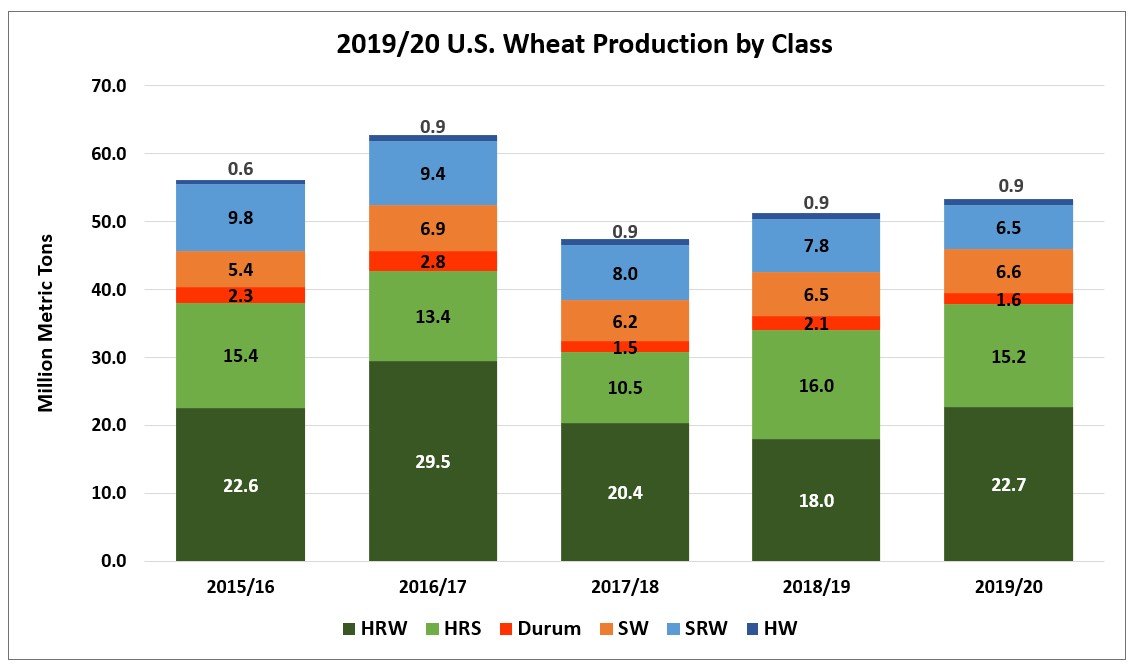
Classes of wheat grown: Hard Red Winter (HRW), Hard Red Spring (HRS), Hard White (HW), Soft White (SW), Durum
USW Leadership: Boyd Schwieder, 2005/06 Chairman; Jim McDonald, 2002/03 Chairman; Jerry Kress, 1998/99 Chairman; Dallin Reese, 1987/88 Chairman
Wheat is grown in 42 of Idaho’s 44 counties and ranks as the state’s second largest crop, behind potatoes. About half of Idaho’s crop goes to domestic mills and the other half is exported, primarily through Pacific Northwest (PNW) ports to Asian and Latin American customers. Idaho typically ranks in the top seven U.S. states for wheat production. An average of 1.2 million acres of wheat is planted each year and yields per acre are among the highest in the nation.
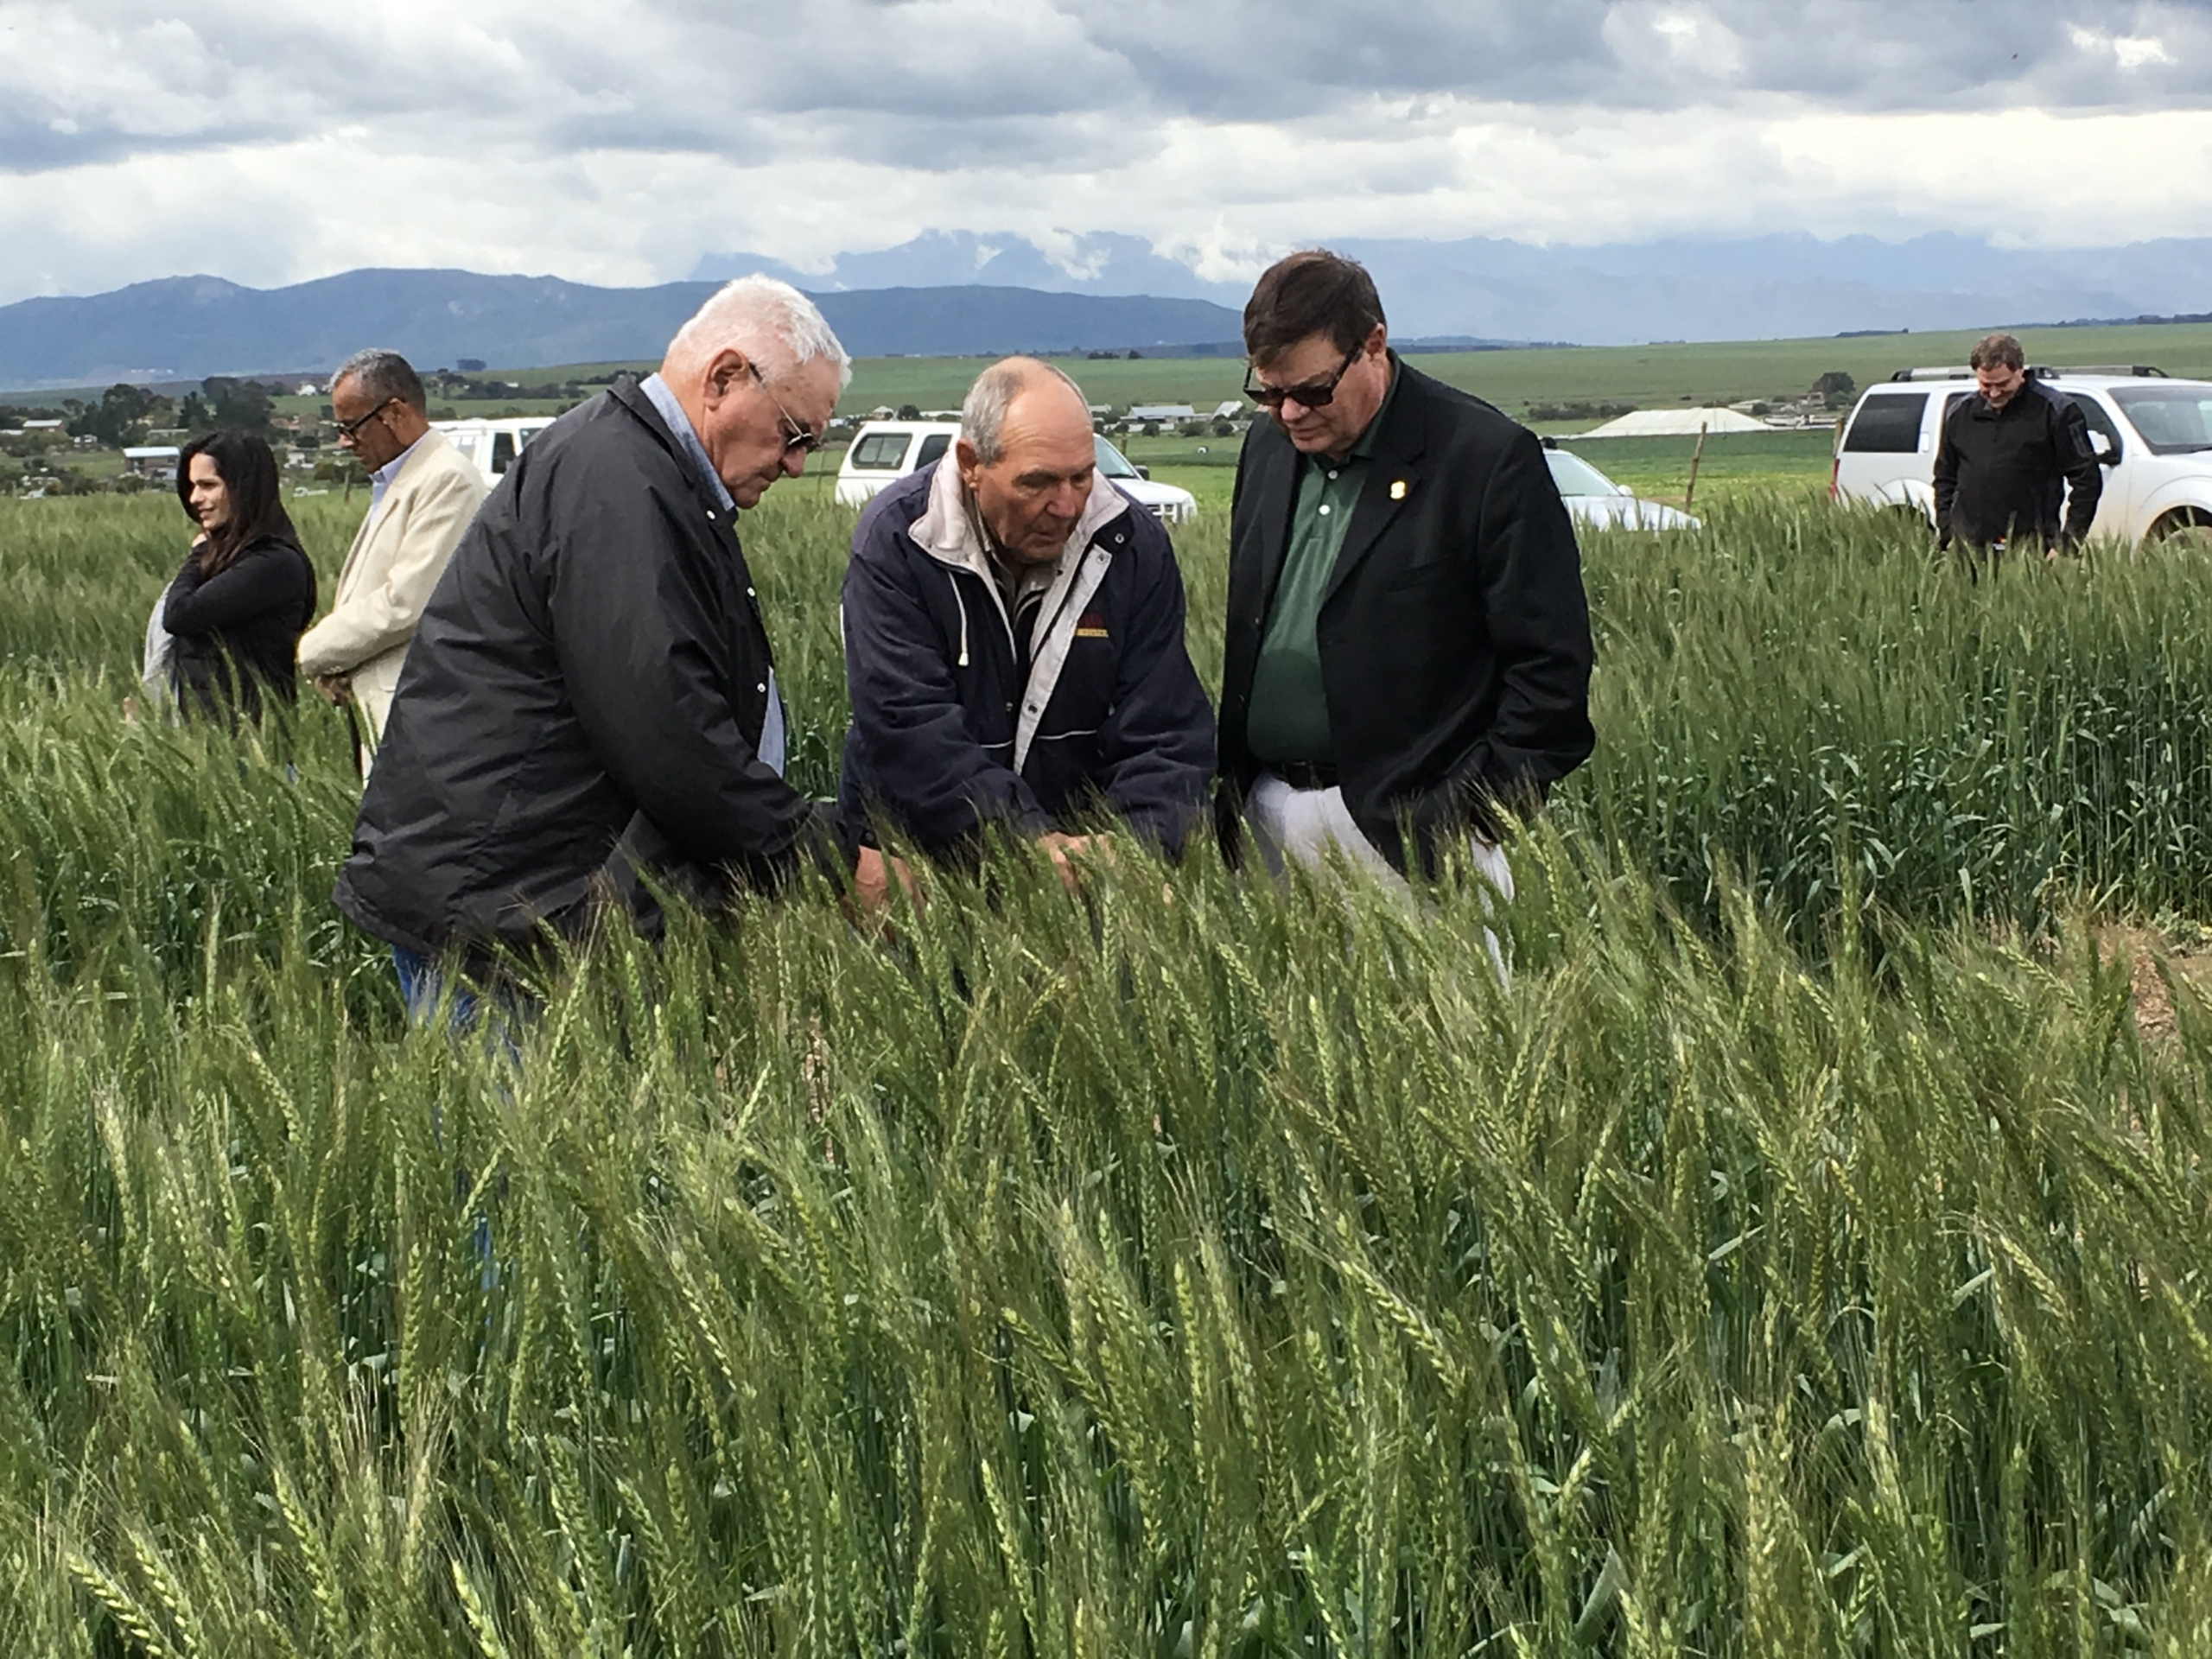
IWC Commissioner and wheat farmer Clark Hamilton was a member of the 2016 USW Board team that traveled to Japan and Korea.
Why is export market development important to Idaho wheat farmers and why do they continue to support USW and its activities?
Idaho exports about half of its wheat, but strong global demand contributes to the profitability of all Idaho growers by increasing farmgate wheat prices. Through its partnership with USW, the Idaho Wheat Commission (IWC) leverages the market intelligence and valuable customer relationships established around the world, in order to find new markets and sustain demand in established markets. USW programs bring the customers and growers together, facilitating a personal connection that is key to the continued success of the Idaho and U.S. wheat industries. We are grateful to USW for the work their team does to develop and maintain relationships for our growers with buyers in other countries and we wish for many more prosperous years to come.
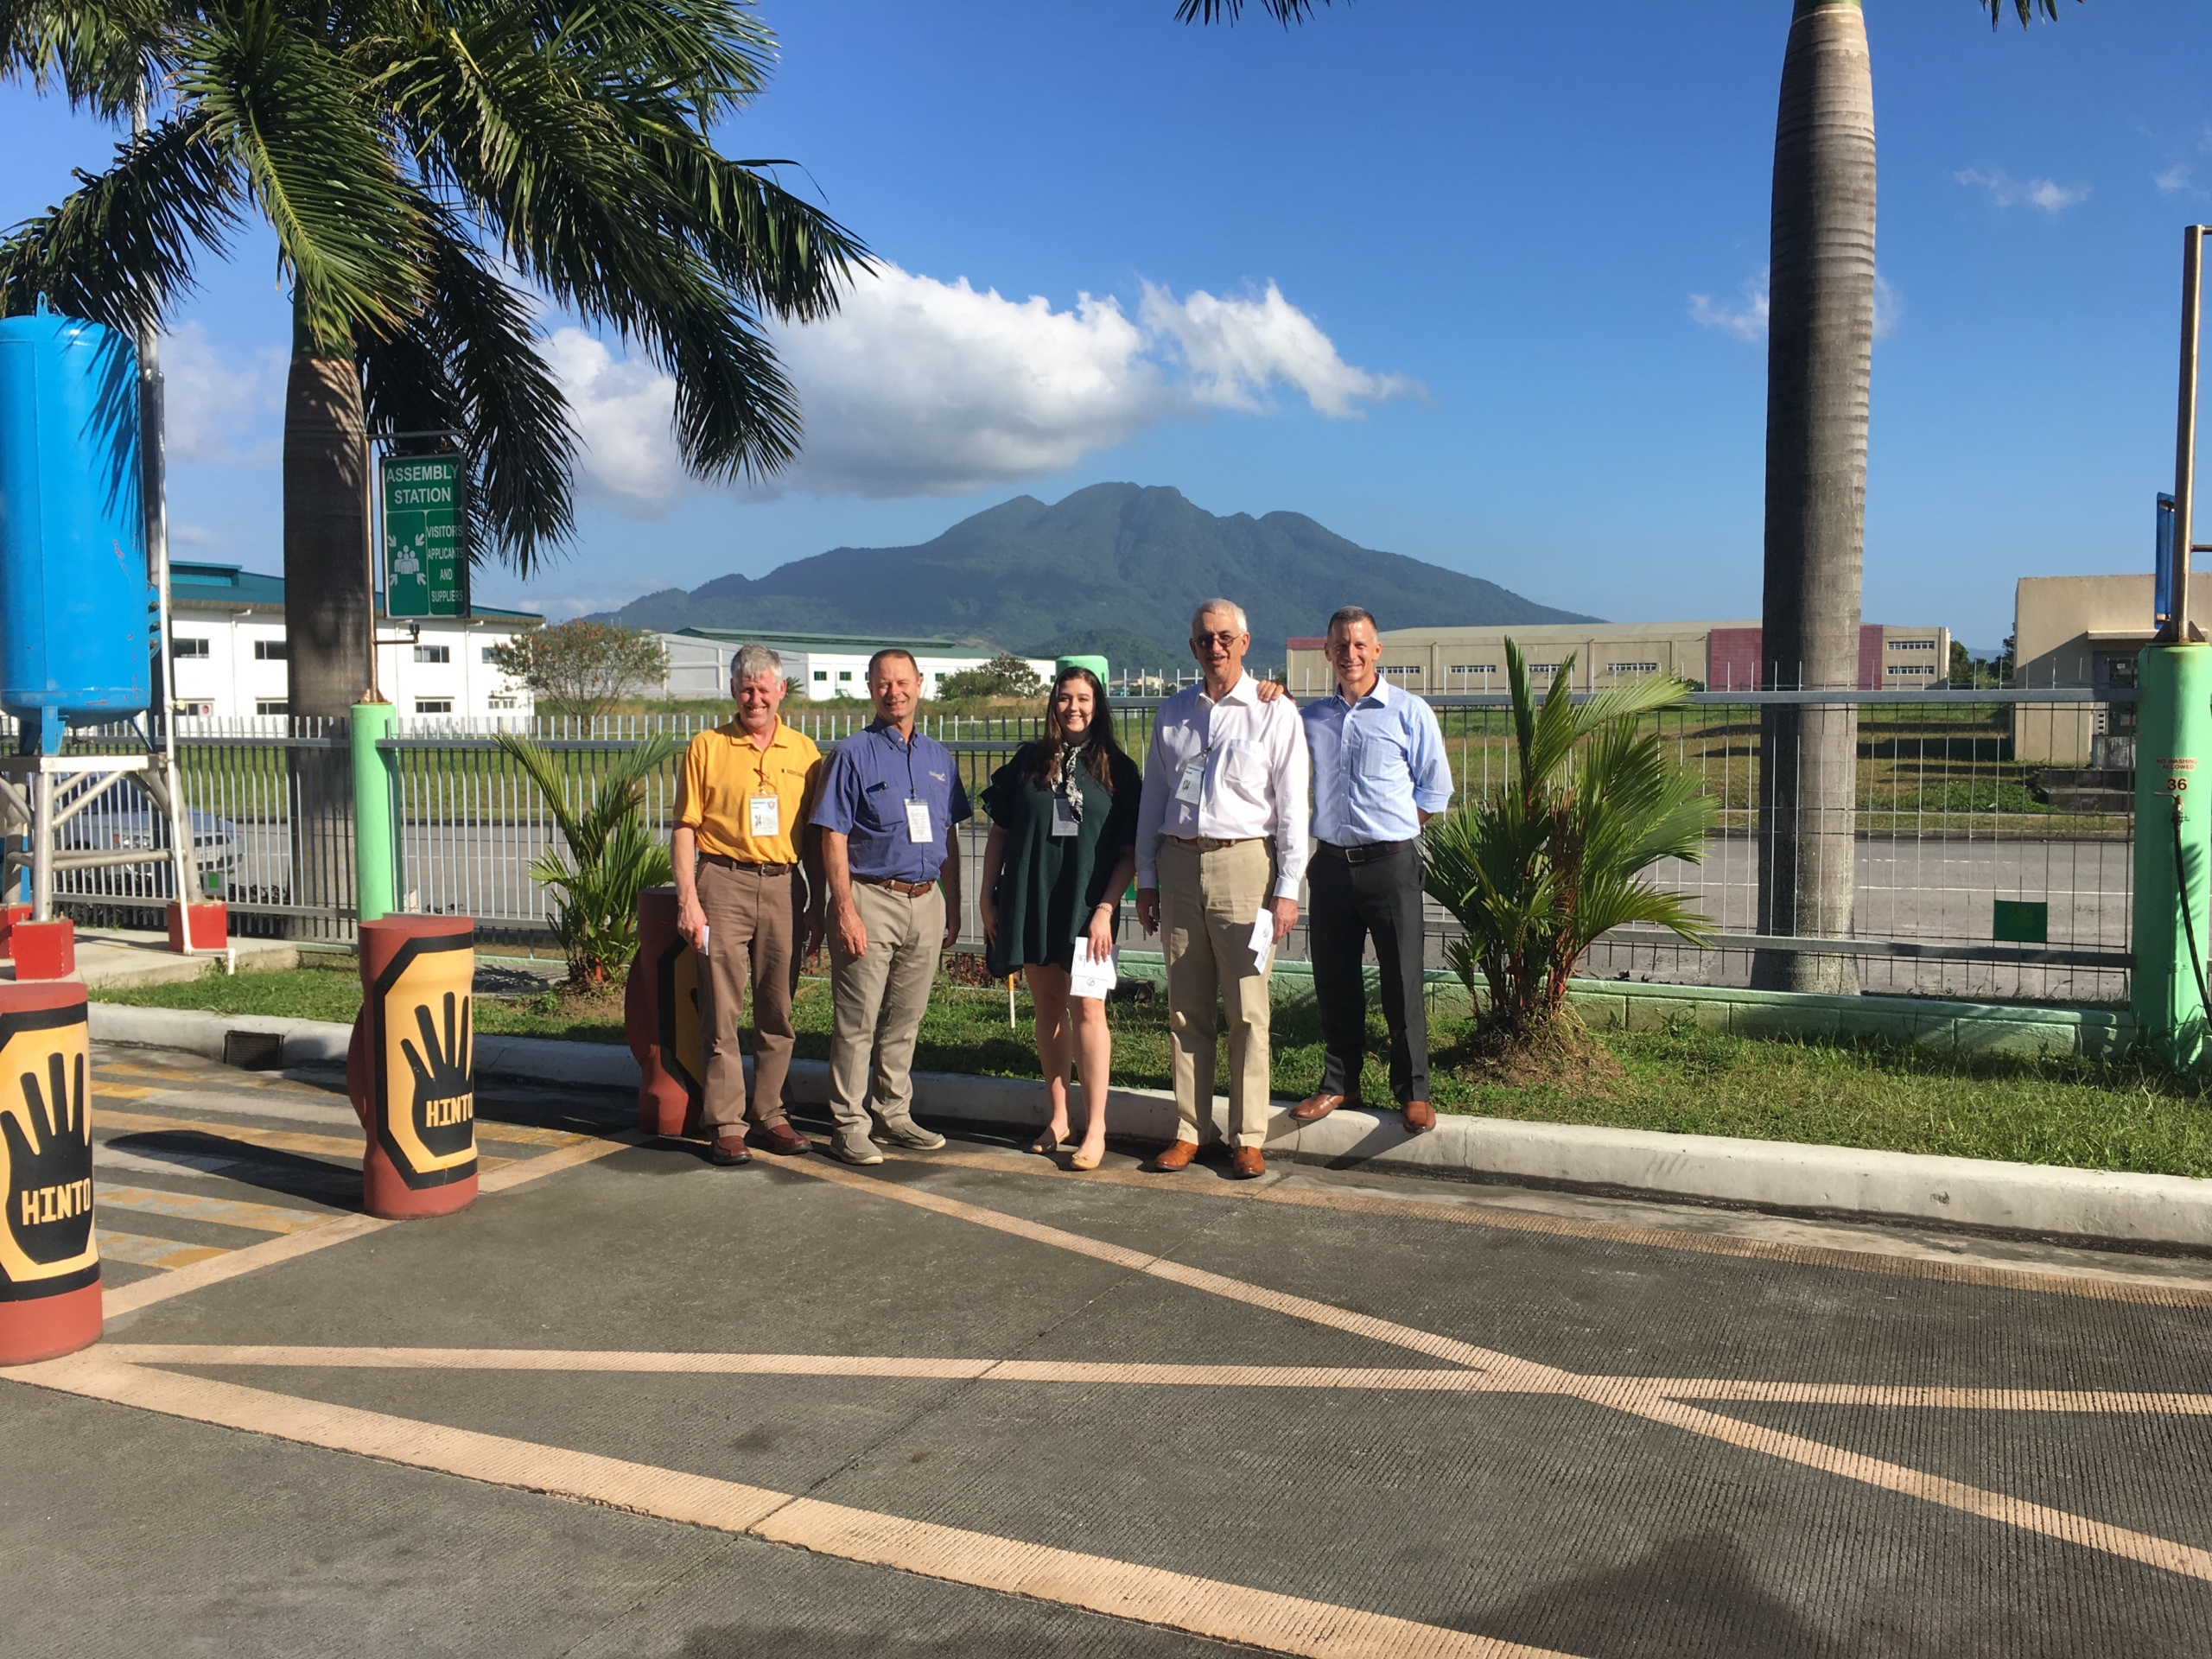
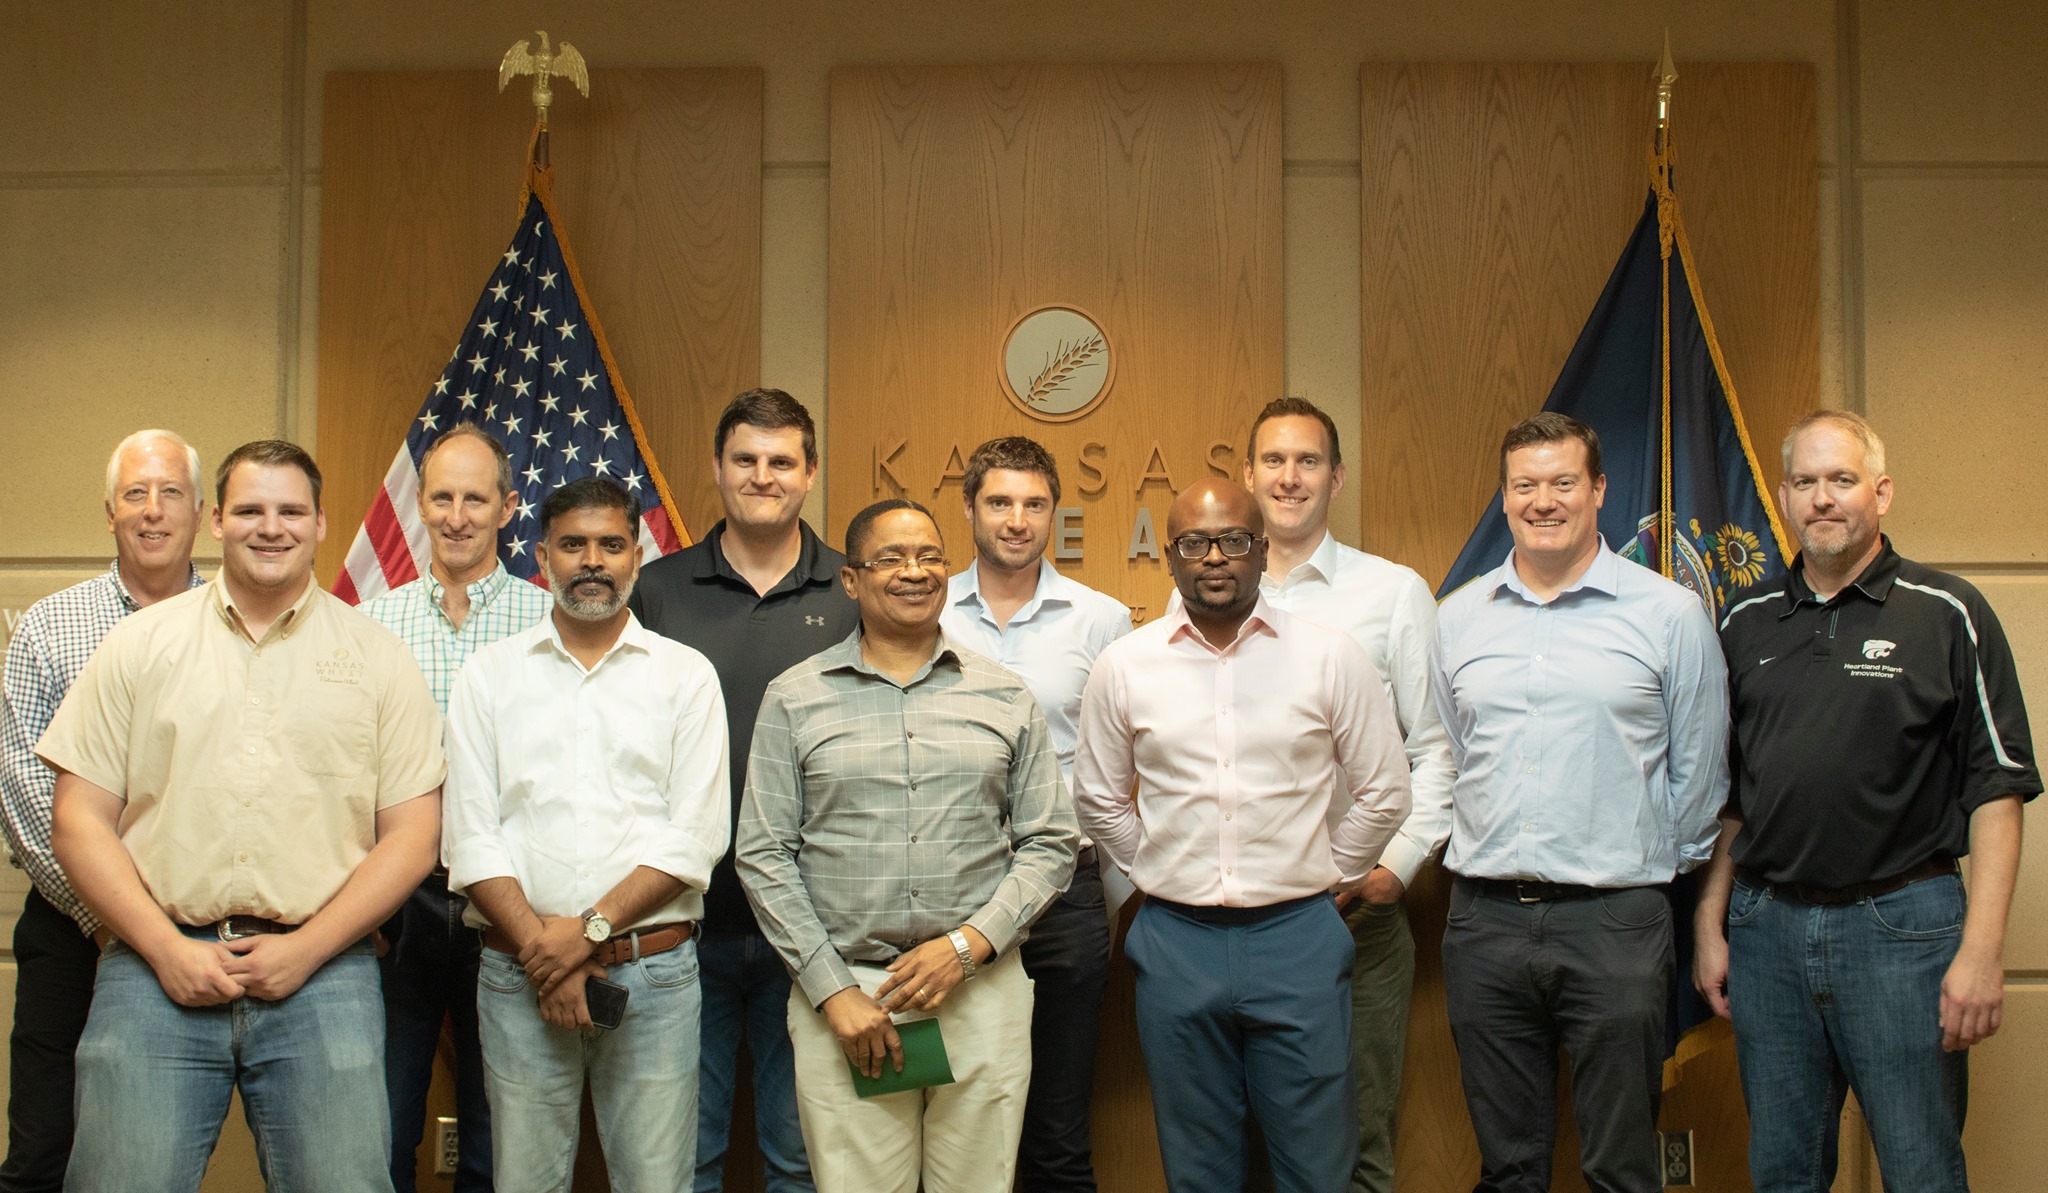
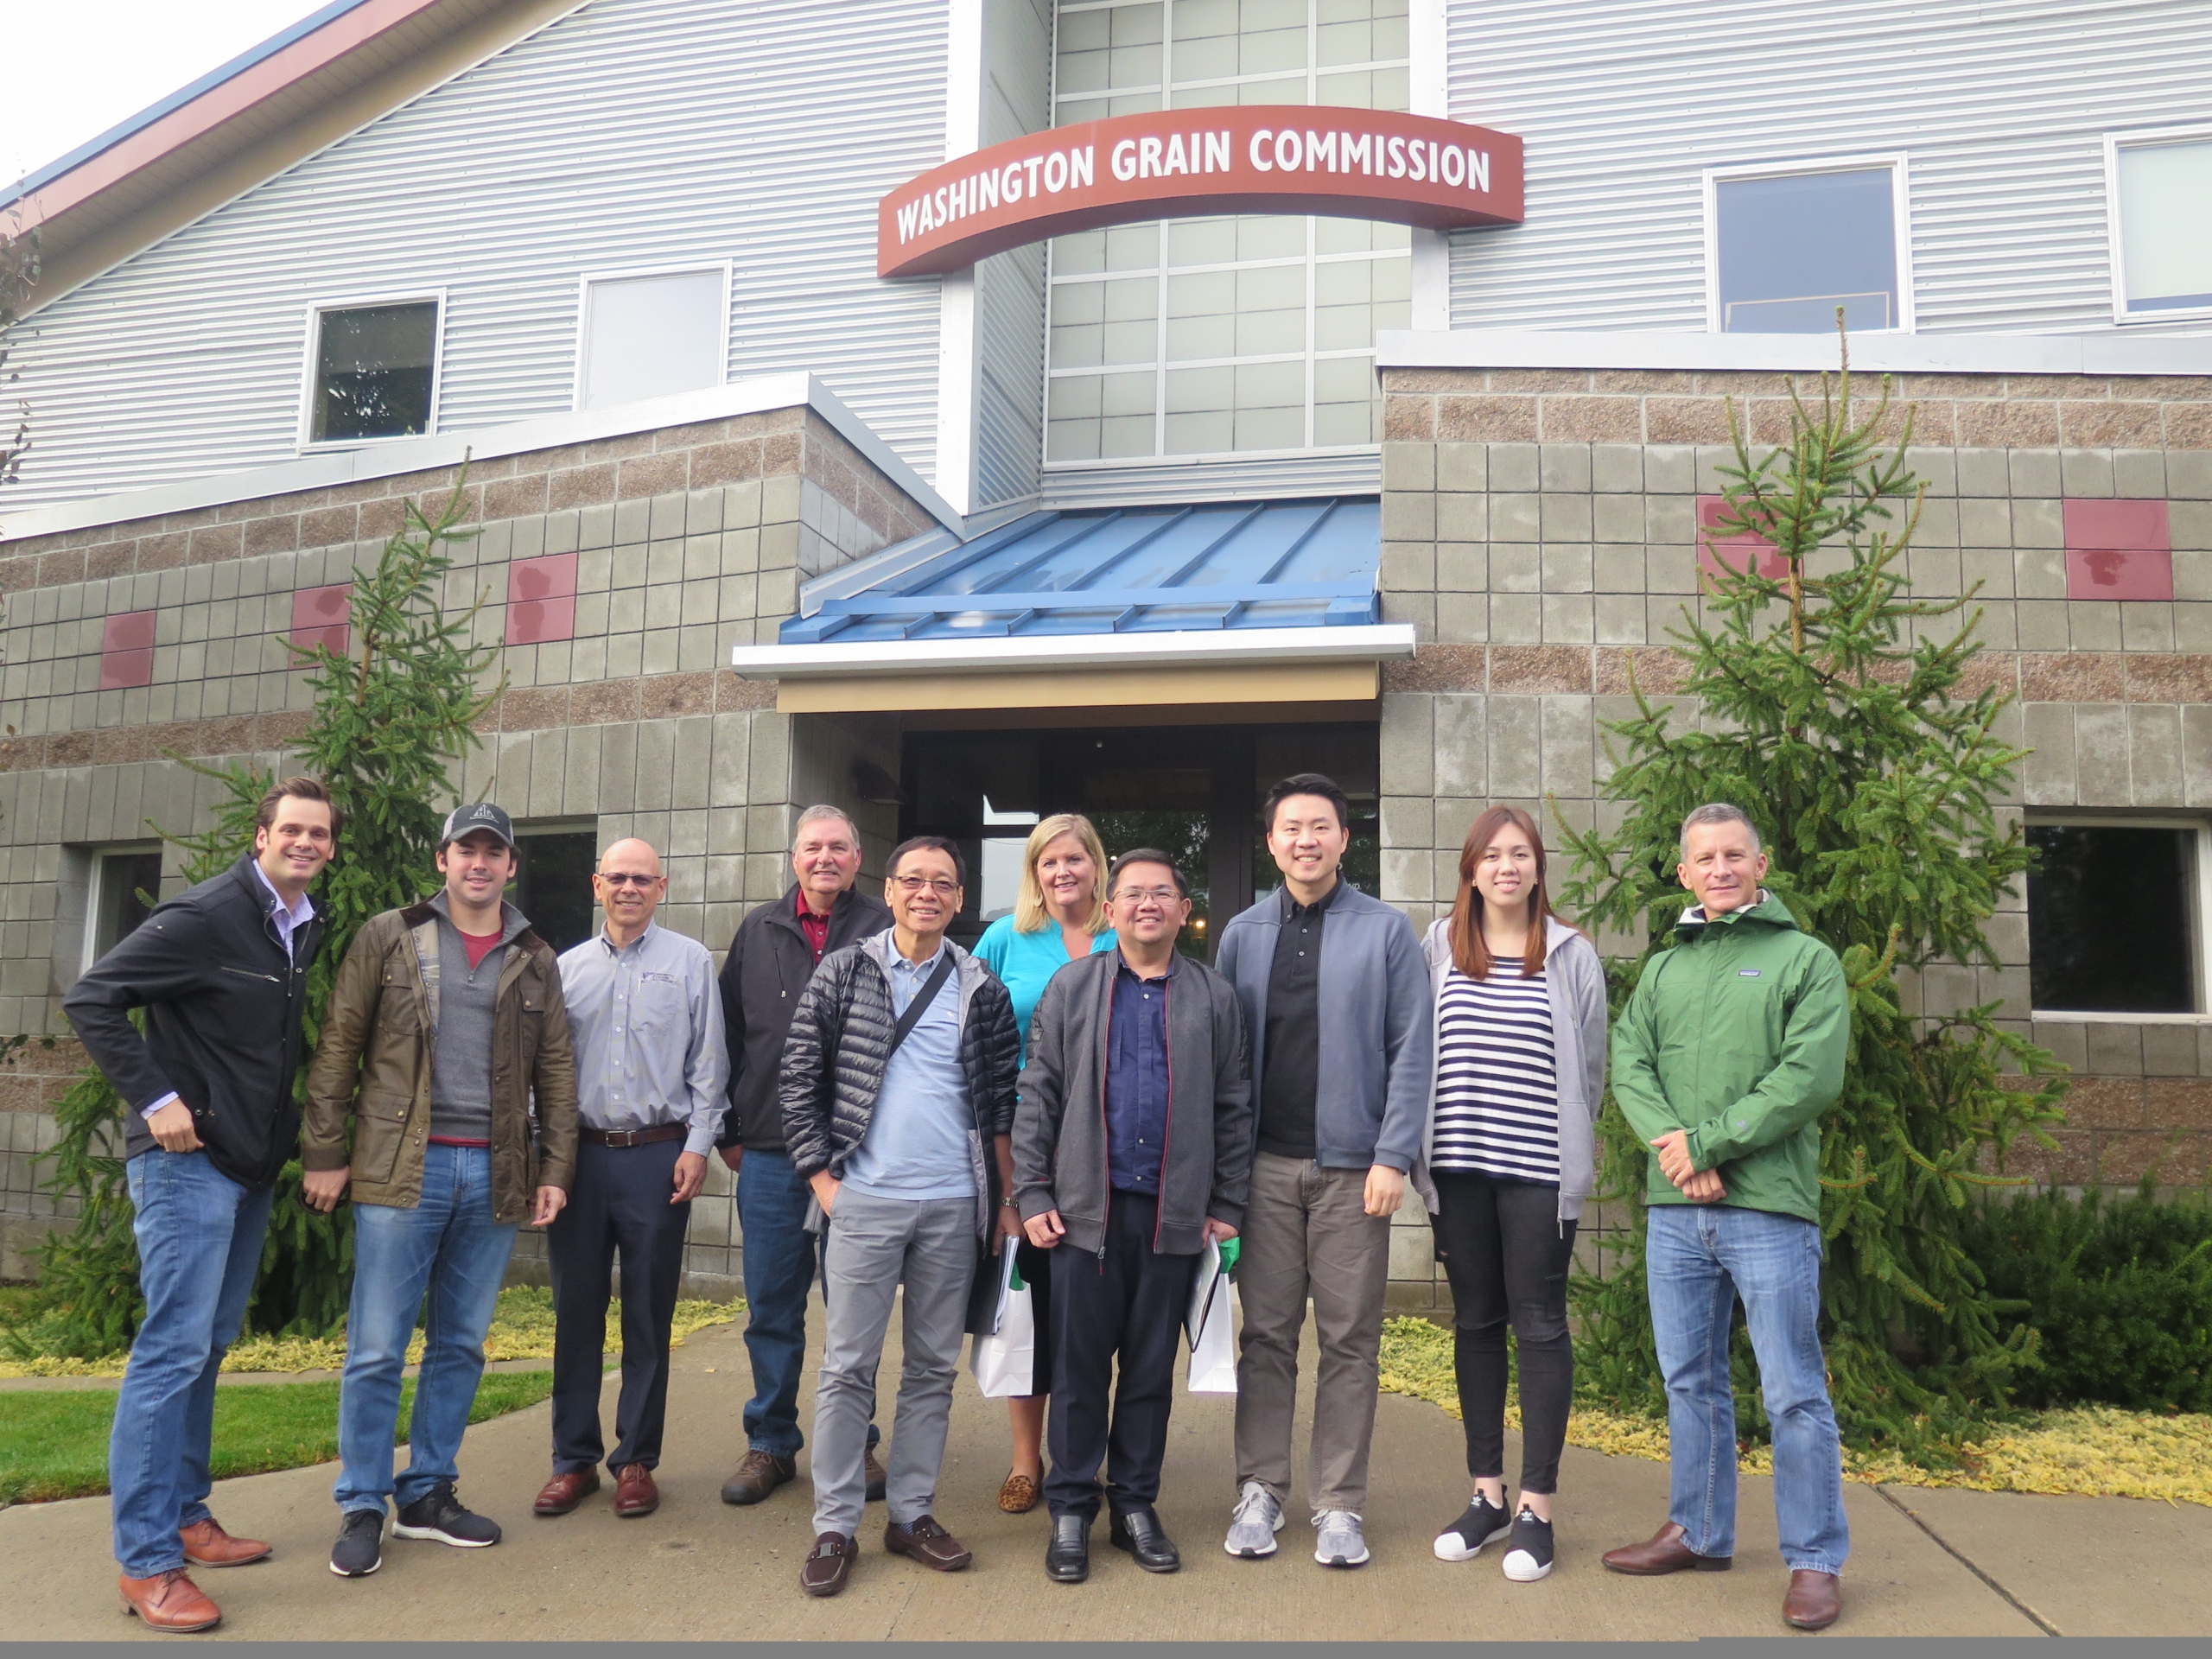
IWC Commissioner and wheat farmer Joe Anderson (second from left) participated on the 2019 USW South Asia Board Team trip to the Philippines, Singapore and Indonesia.
How have Idaho wheat farmers recently connected with overseas customers?
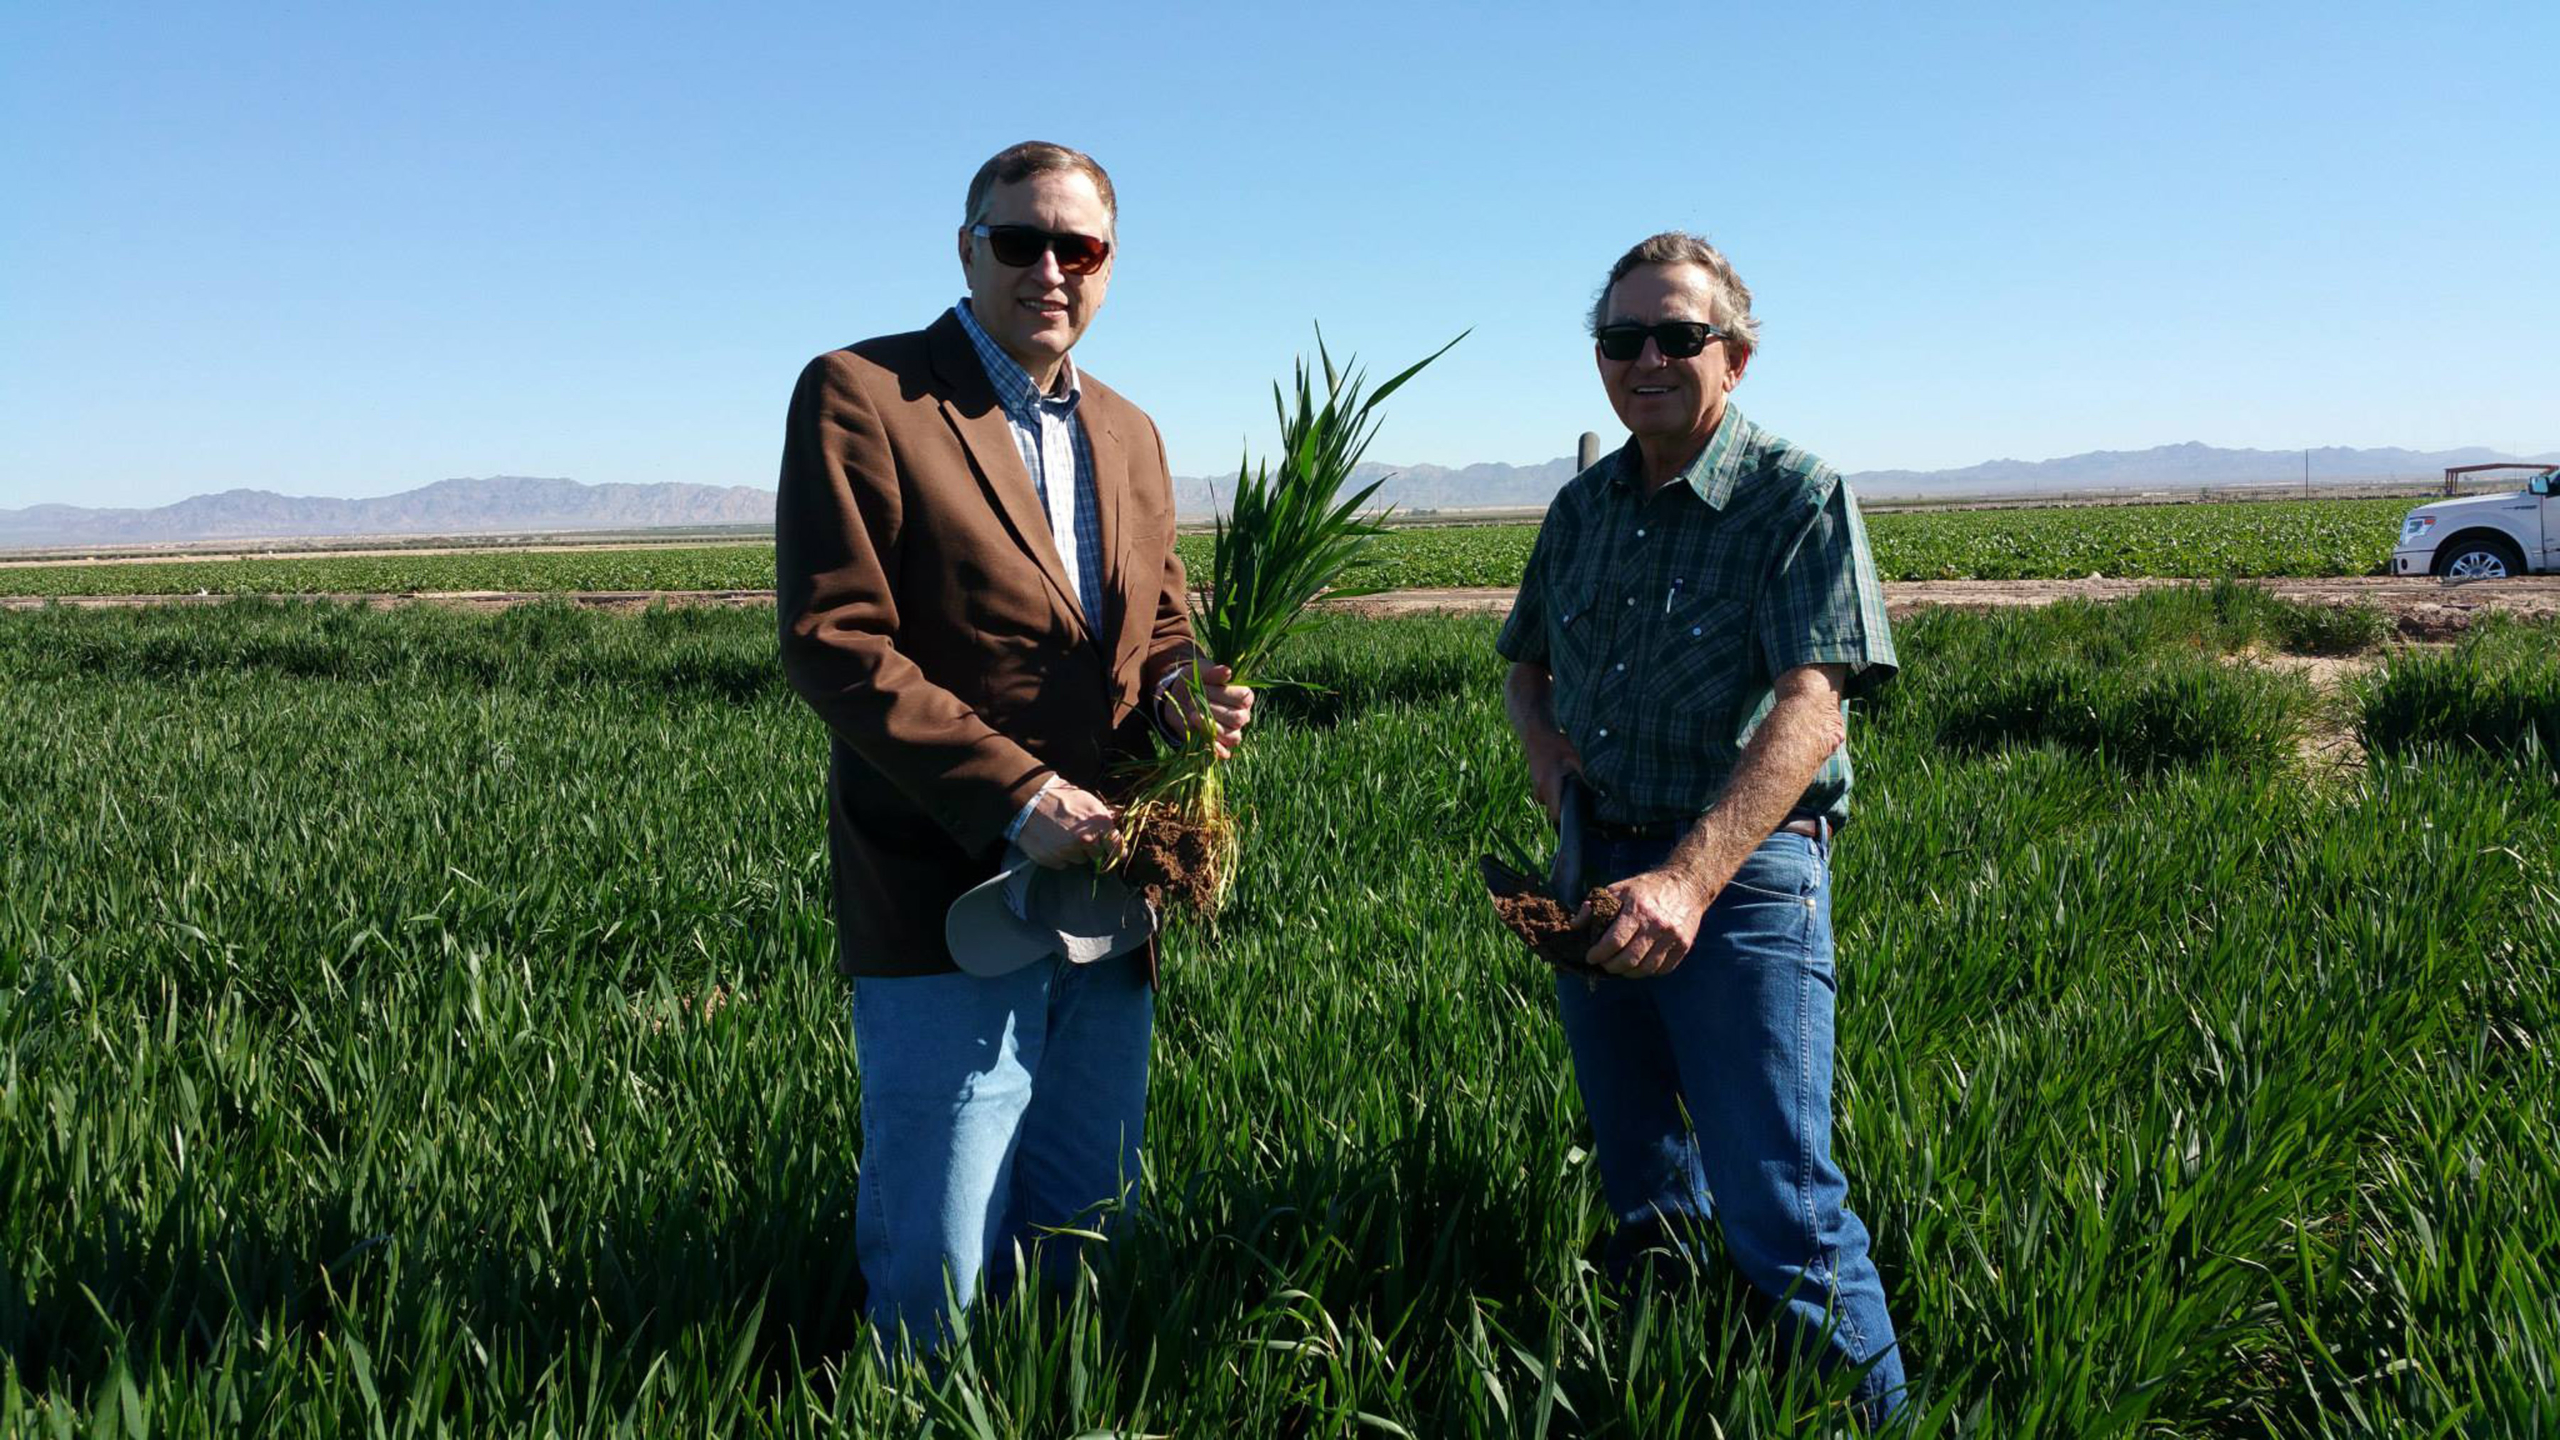
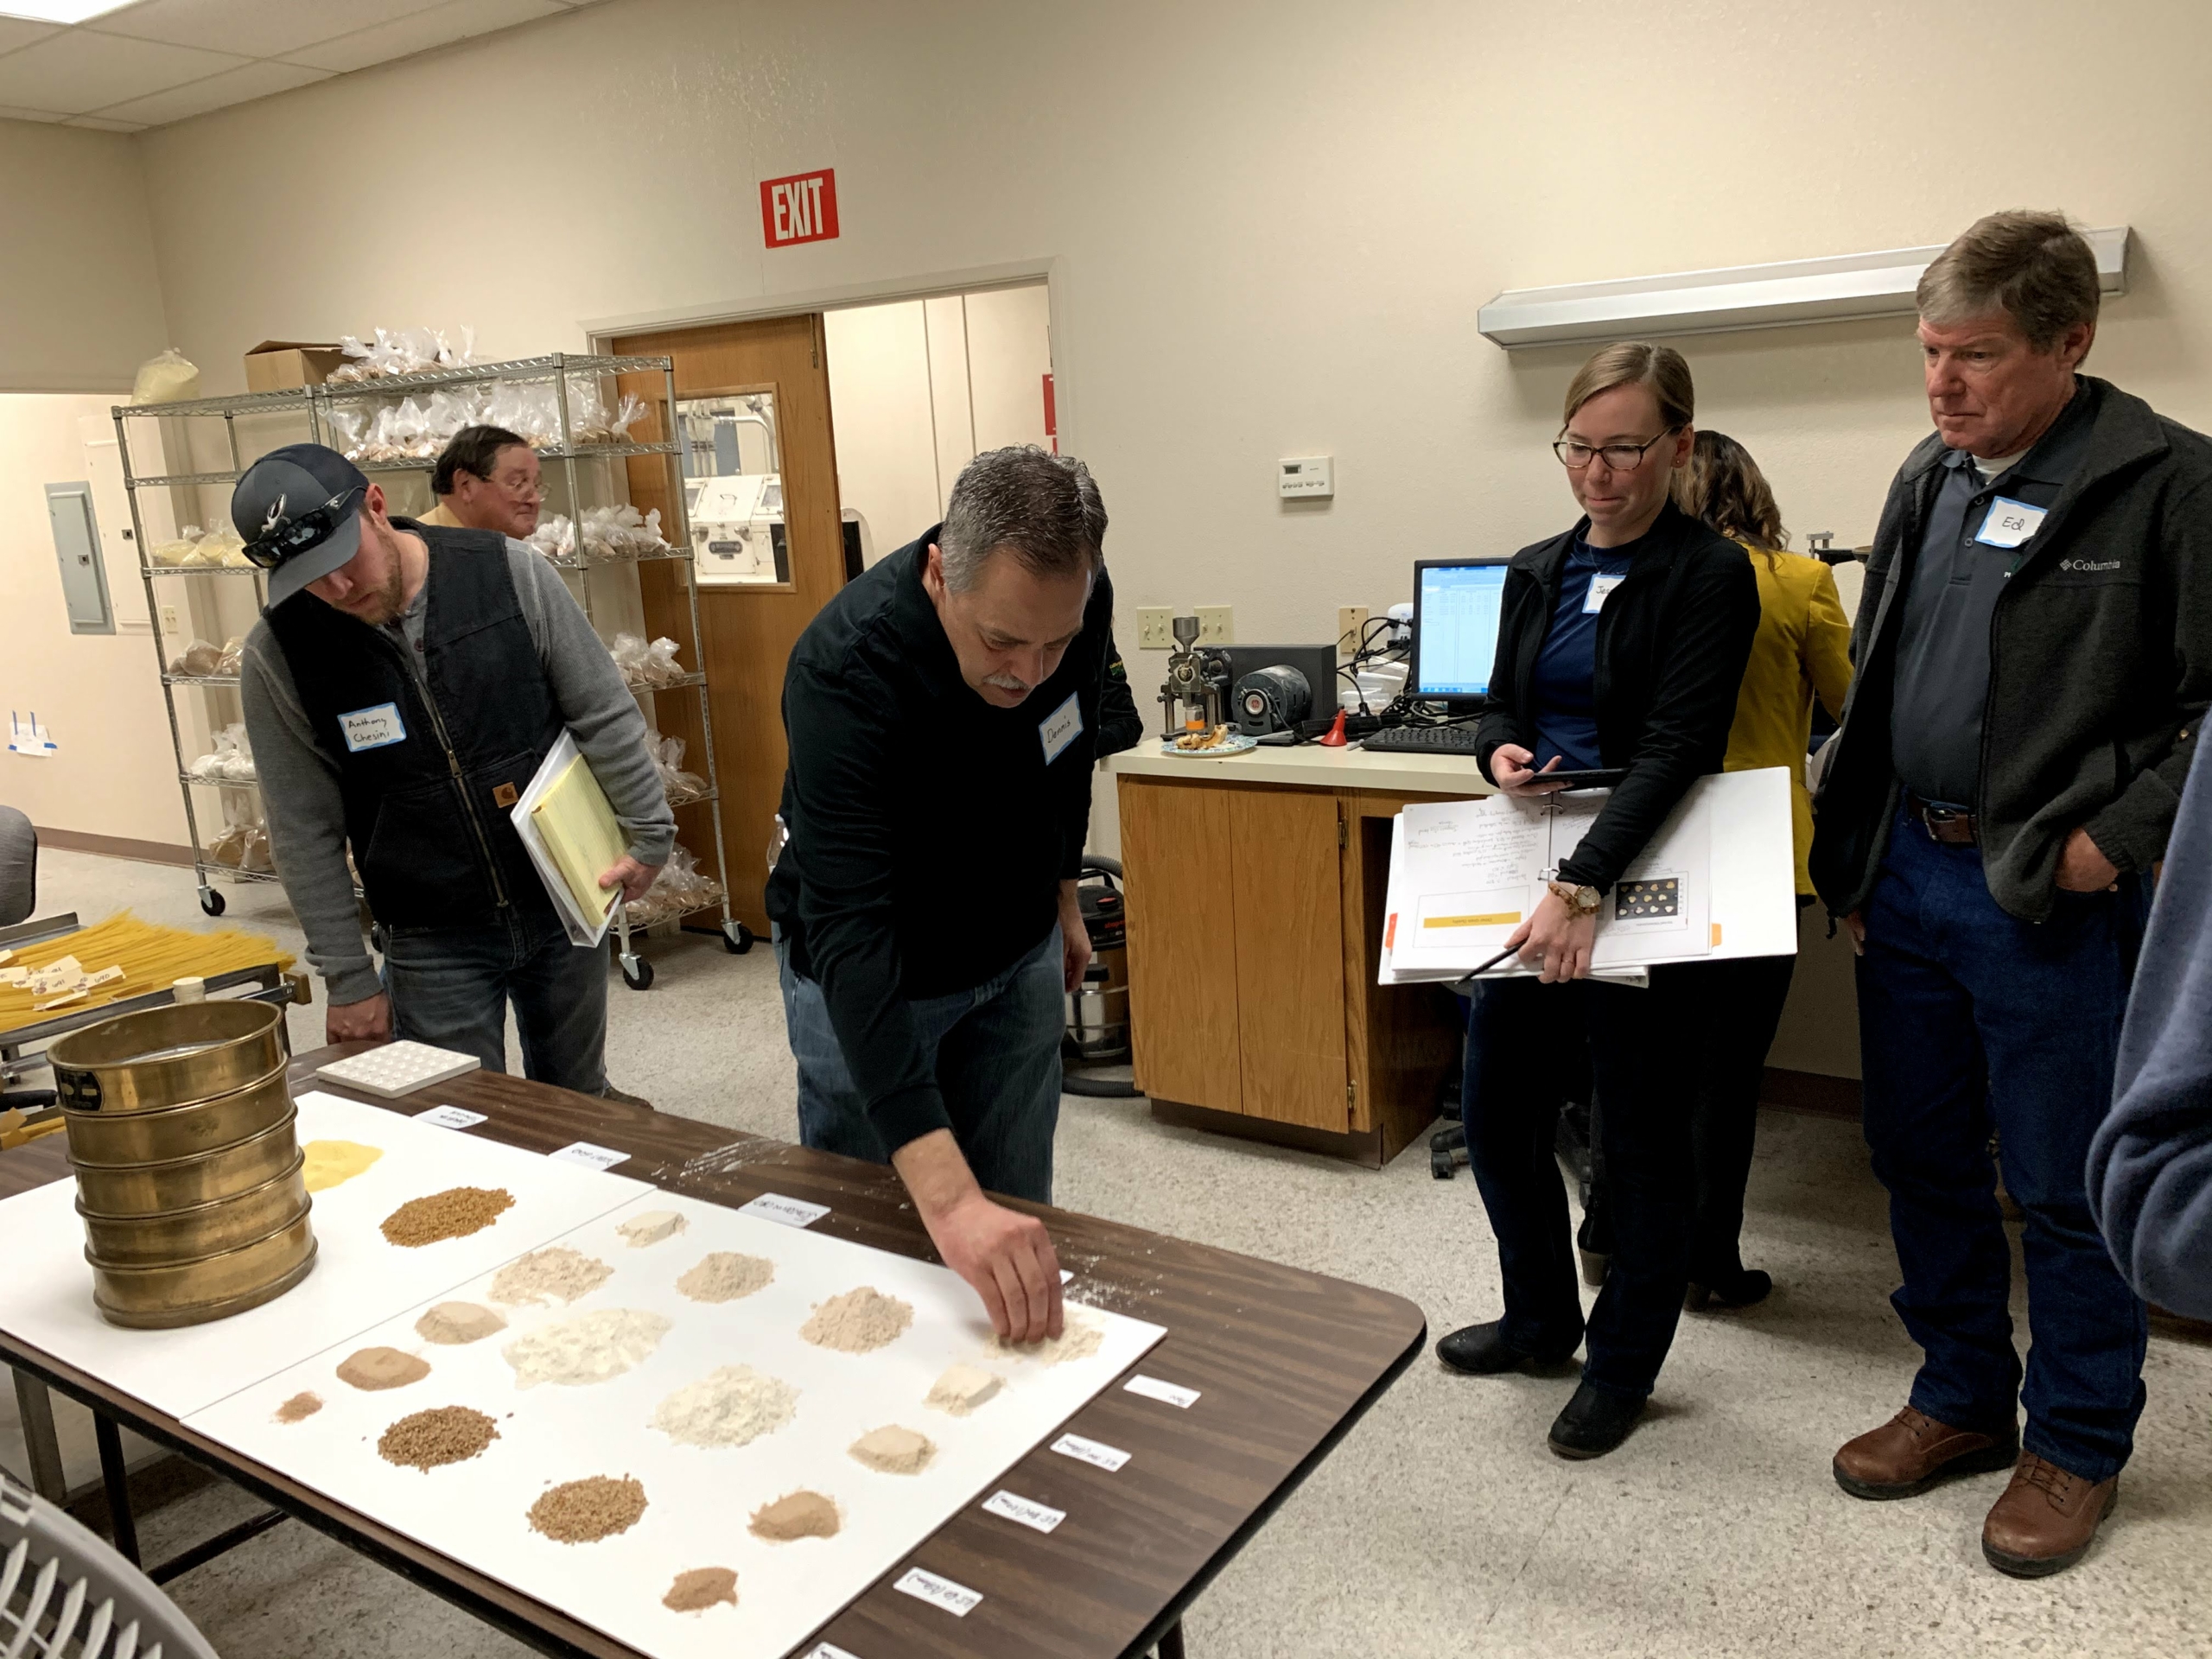
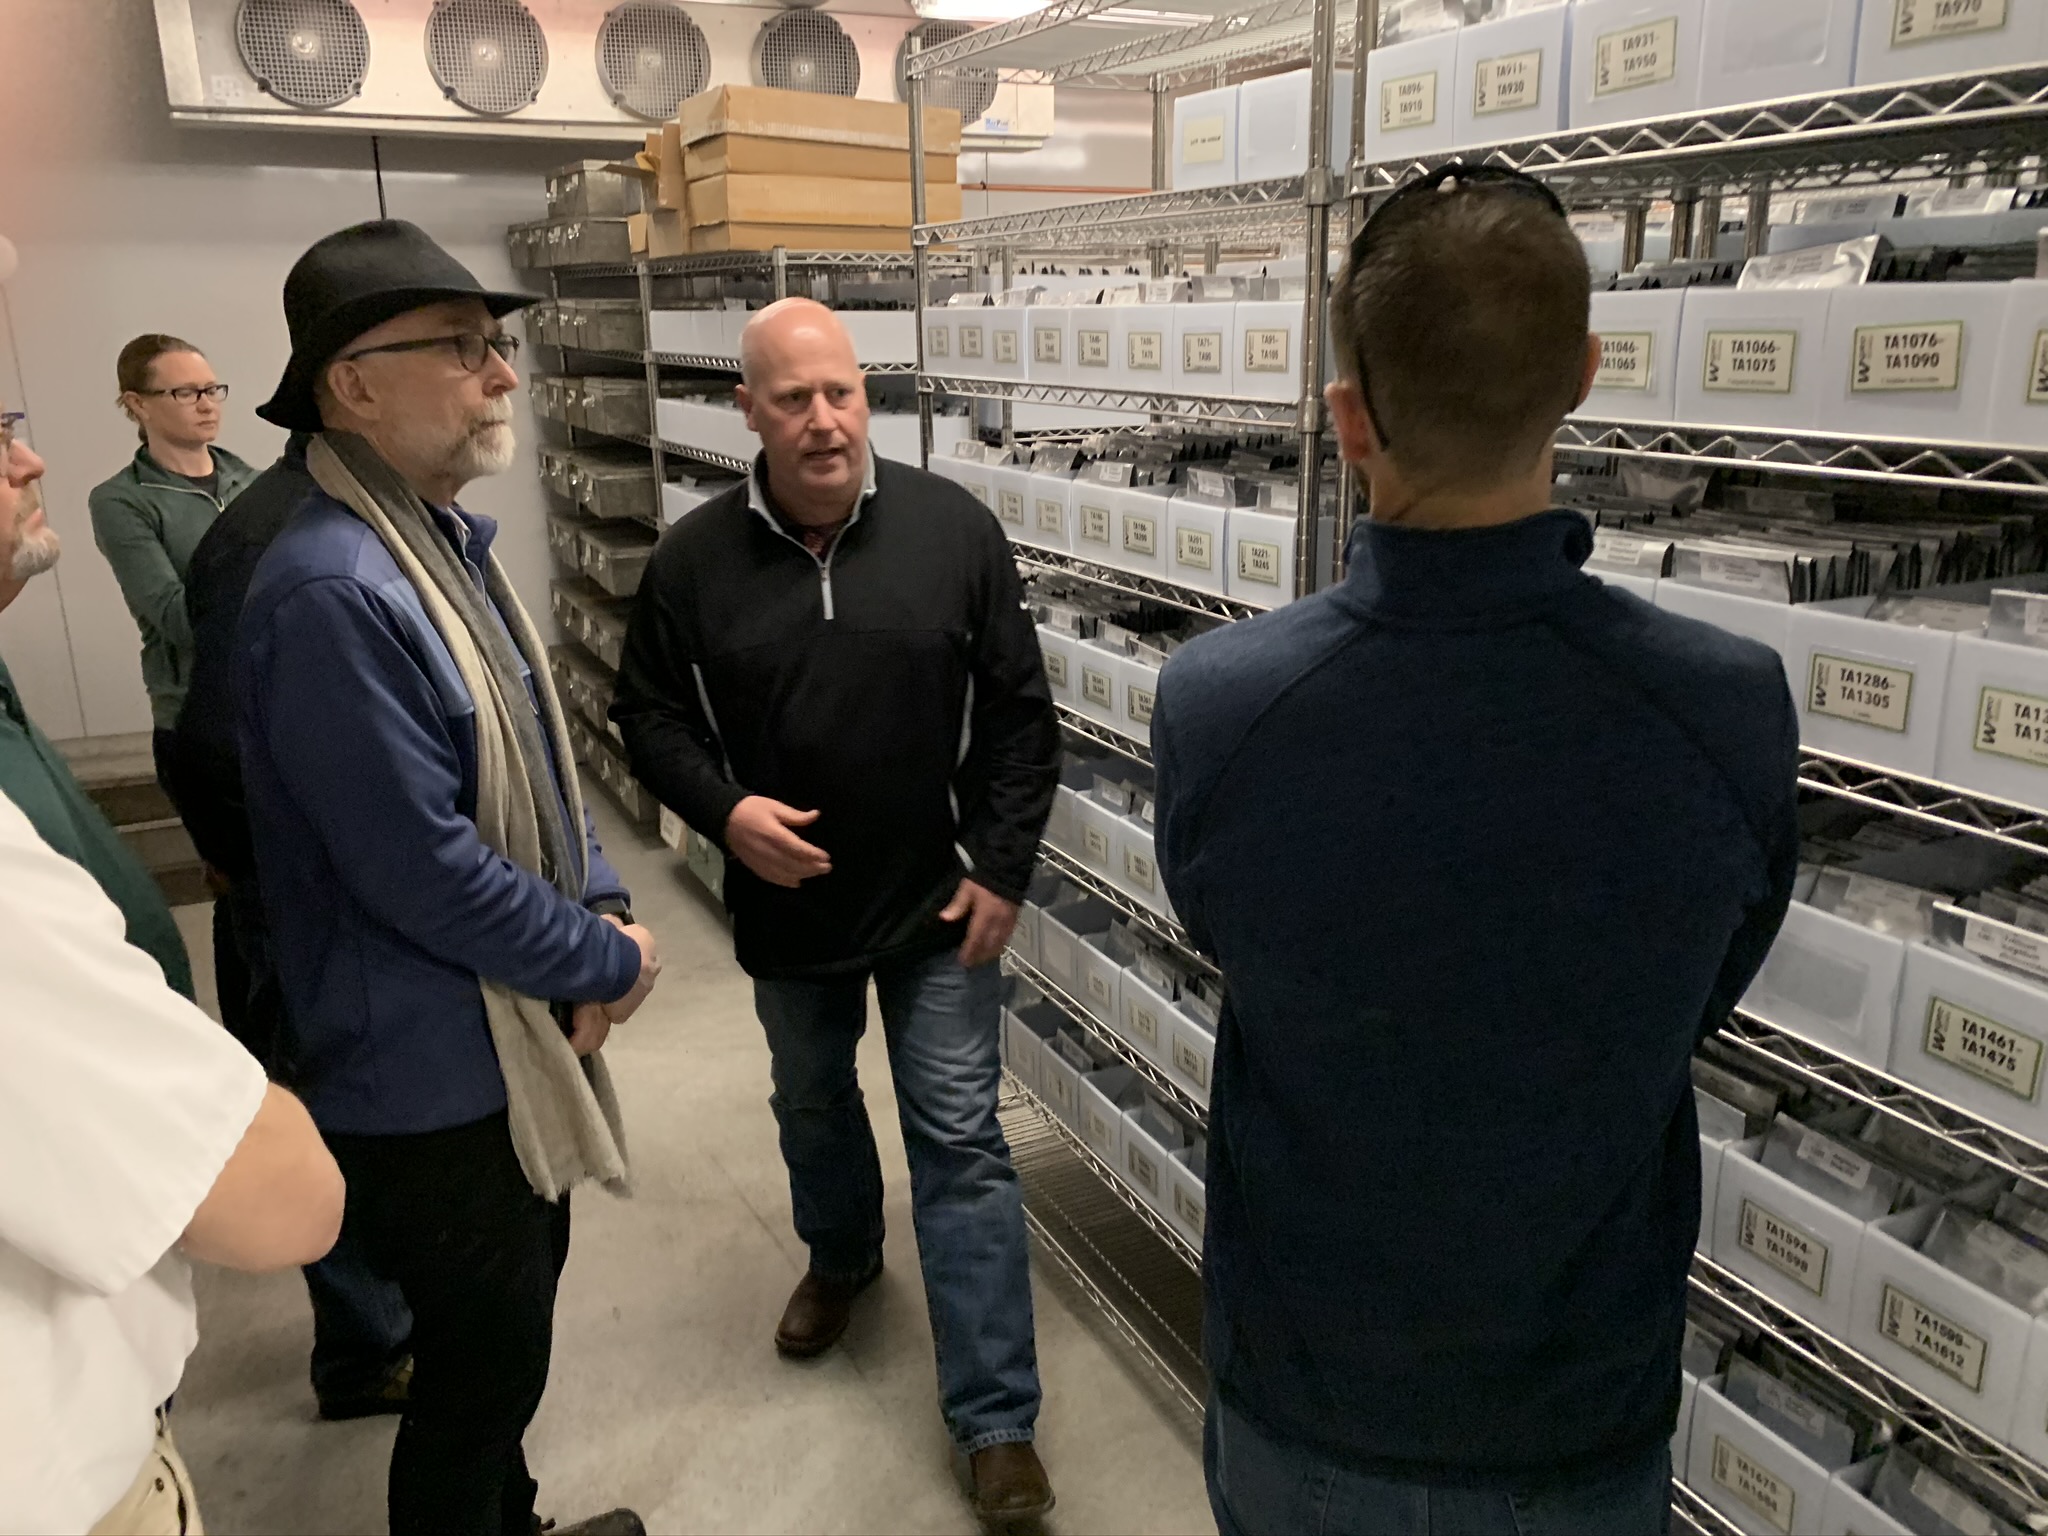
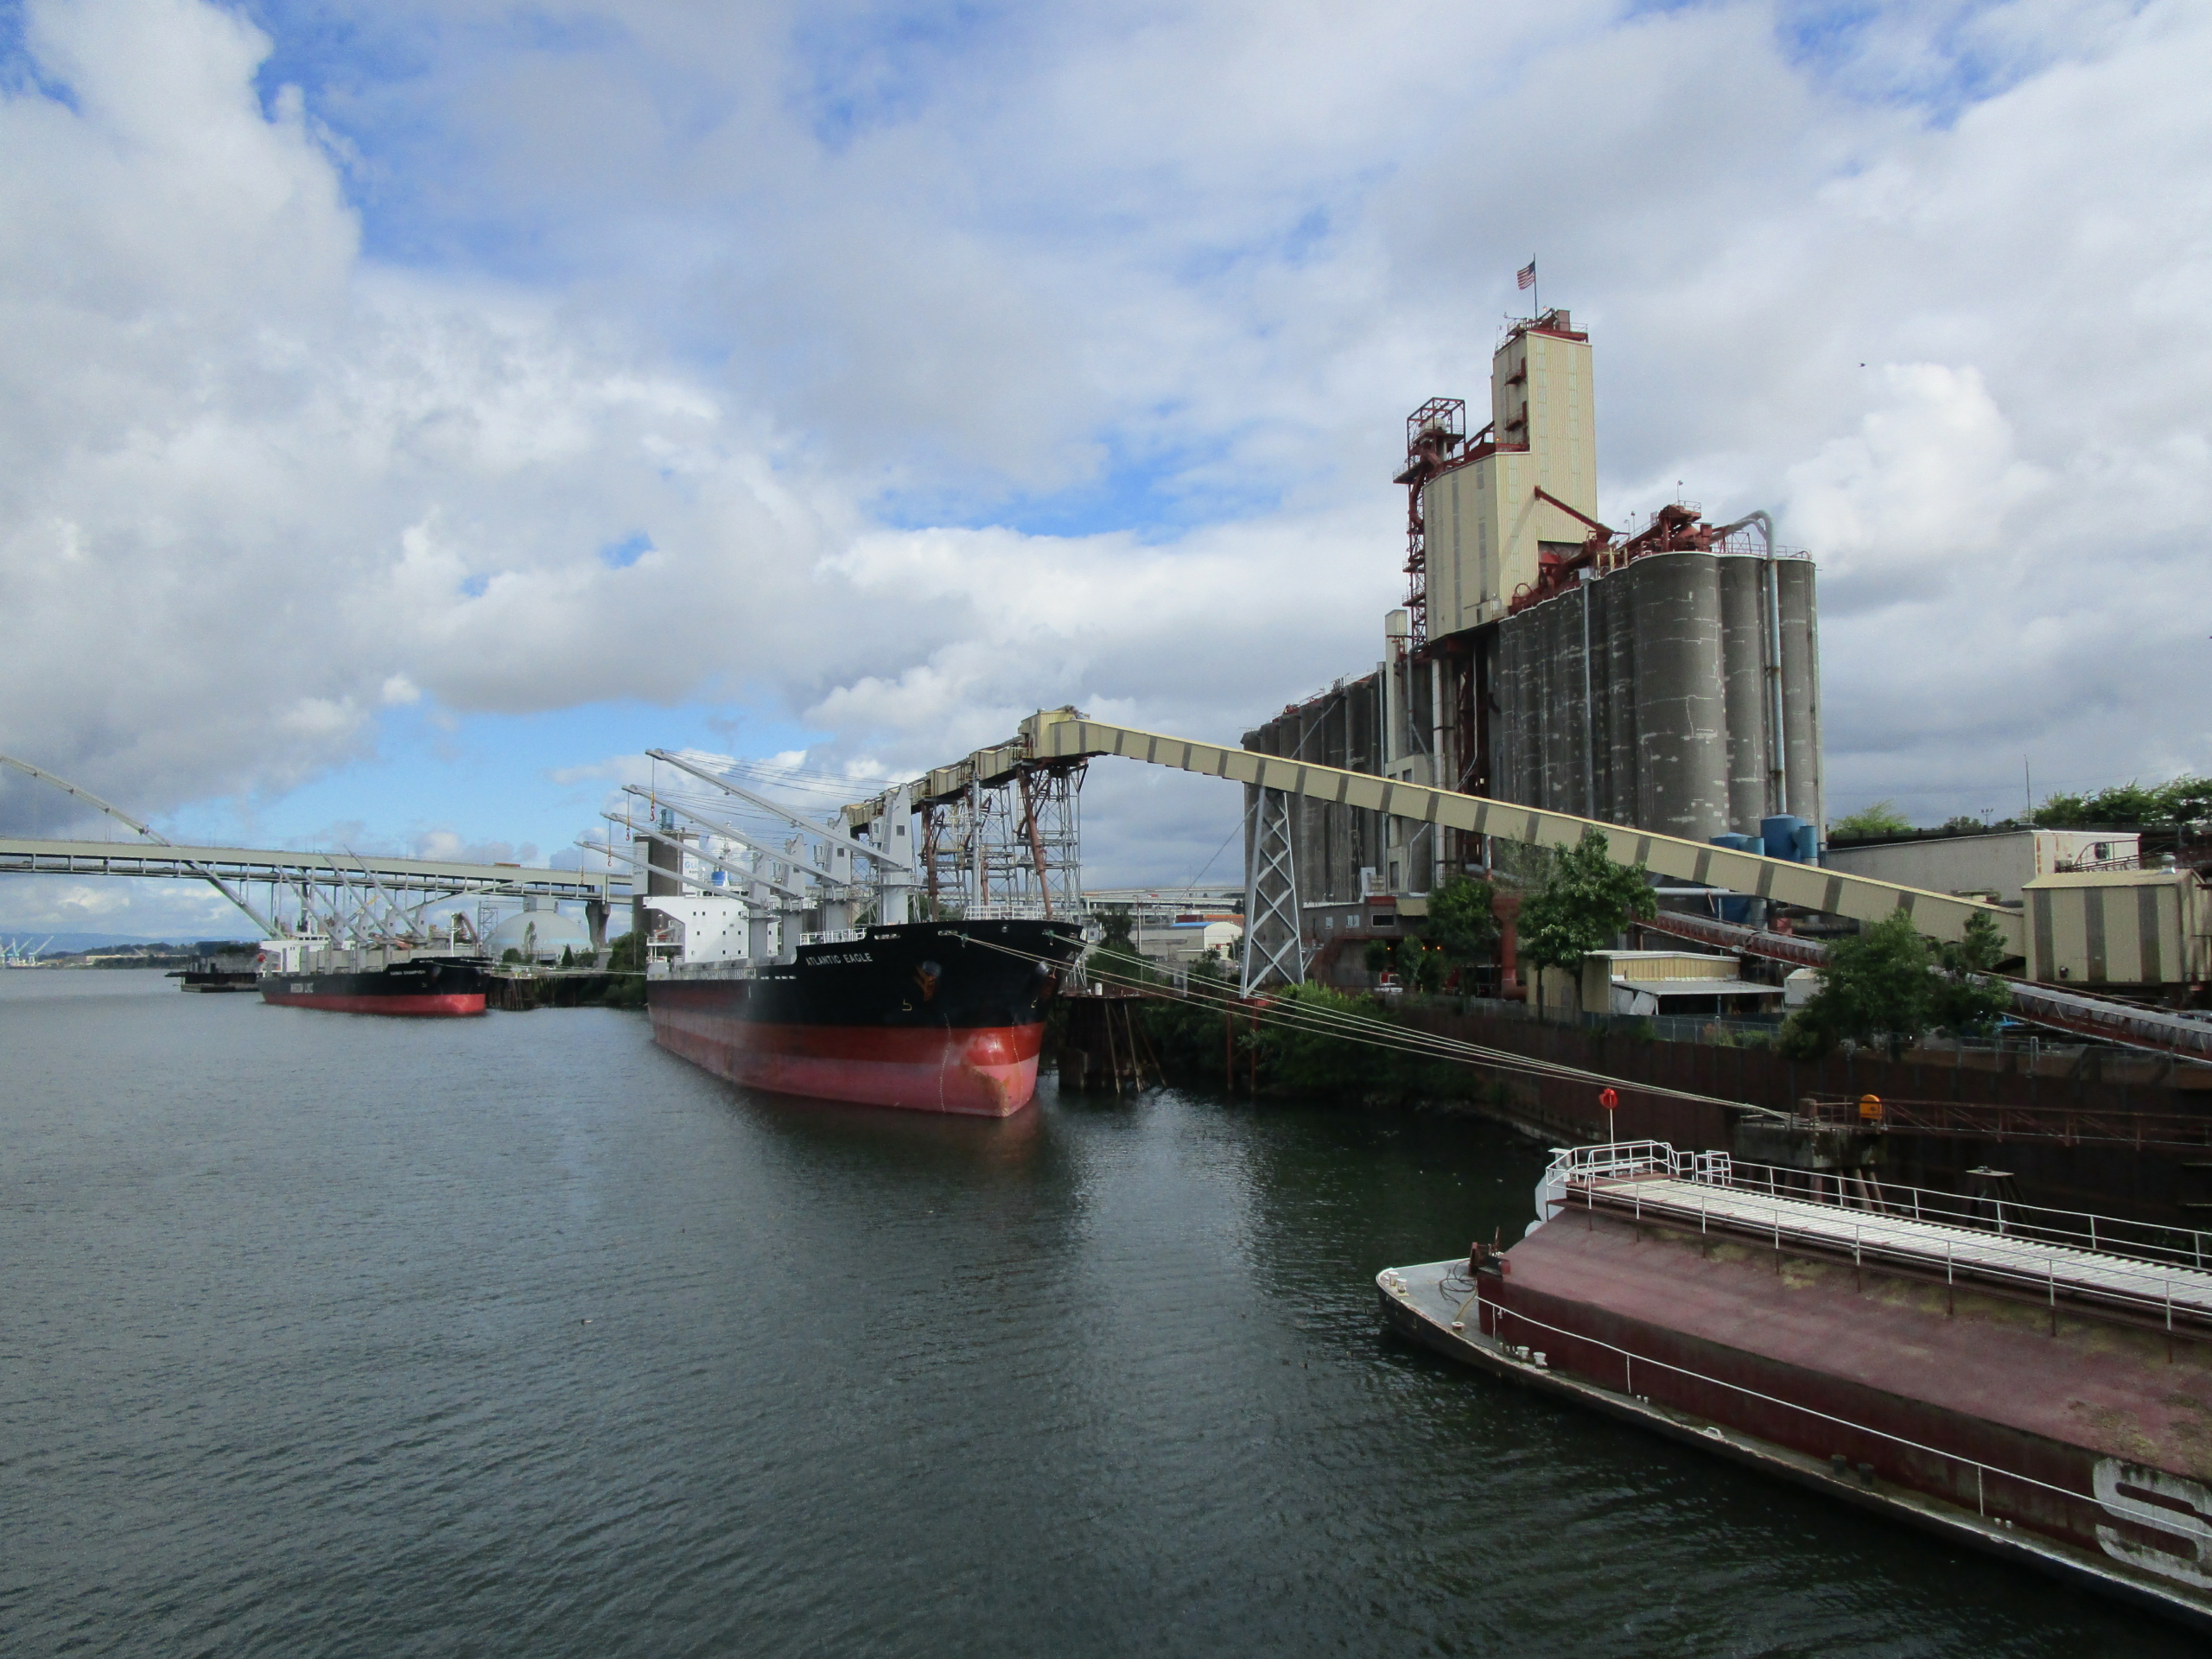
Idaho hosts multiple international trade delegations each year from many different countries. Participants follow the entire supply chain to see how wheat gets from the ground to its destination in the mill. These customers visit quality control labs and wheat breeding programs, visit farms and see how growers take care to produce high-quality wheat and then go on to visit the local grain handlers who move the wheat by rail, barge and container. Idaho is unique in that it has an inland “ocean port.” At the Lewis-Clark Terminal in Lewiston, Idaho, wheat is loaded onto barges that travel down the Columbia-Snake River System to the export facilities near Portland, Ore.
Additionally, IWC commissioners and staff regularly participate in events overseas. Recently, for example, Commissioner Clark Hamilton joined Idaho Governor Brad Little in a goodwill mission to Taiwan, a country with which IWC has a long and fruitful relationship. Commissioner Bill Flory also visited Japan with USW to meet with longtime friends of IWC and major buyers of SW, HRS and HRW wheat.
With the current travel restrictions, IWC is working to connect virtually with customers through USW online programs.

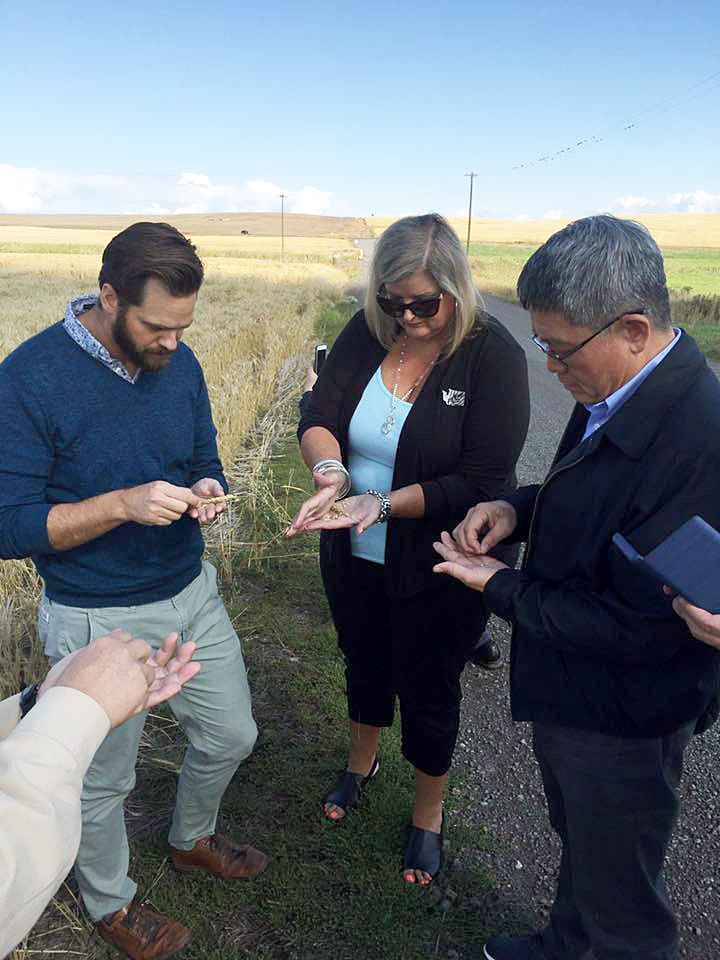
IWC Commissioner Bill Flory hosted the 2019 Philippine Trade Team on his farm.
What is happening lately in Idaho that overseas customers should know about?
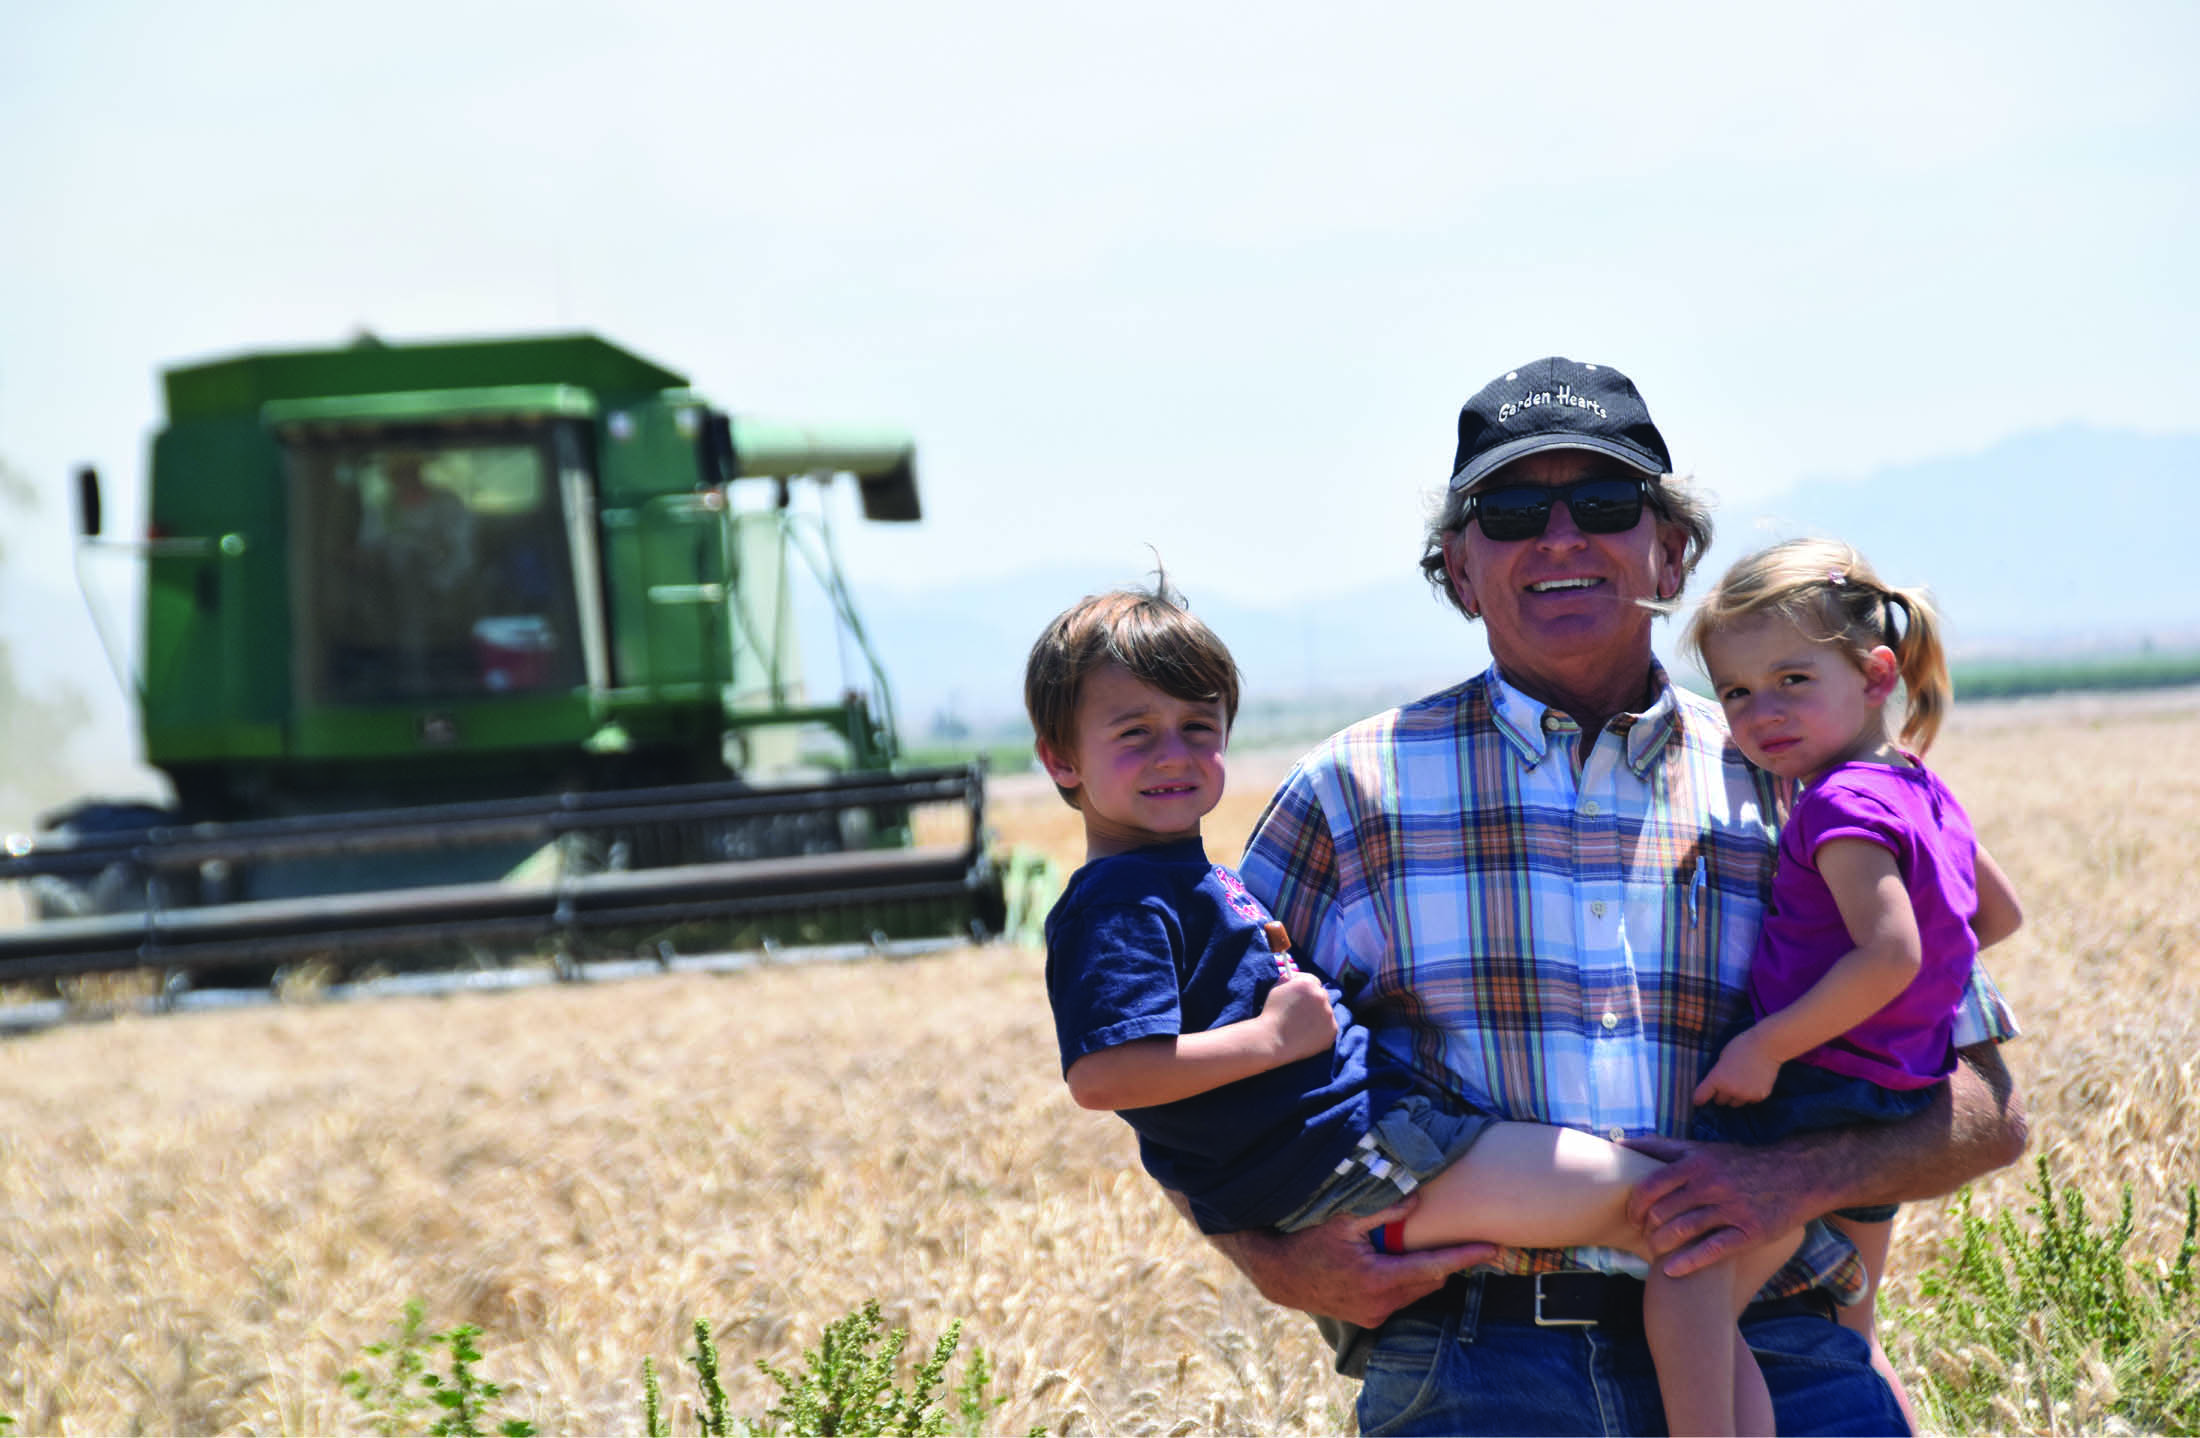
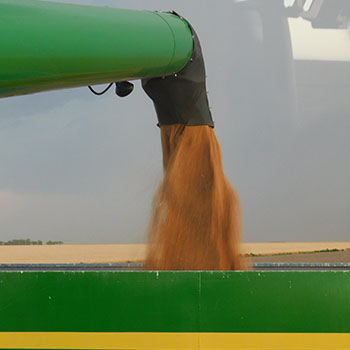
- Wheat growers in Idaho are diligently tending to their crops and working like any other year, despite the global pandemic. Favorable weather throughout the growing season has the crop in excellent condition just a few weeks from the start of harvest. The transportation system is running smoothly, and customers can expect mostly normal operations. The Columbia-Snake River System is critical for reliably and affordably shipping grains from the PNW to overseas markets.
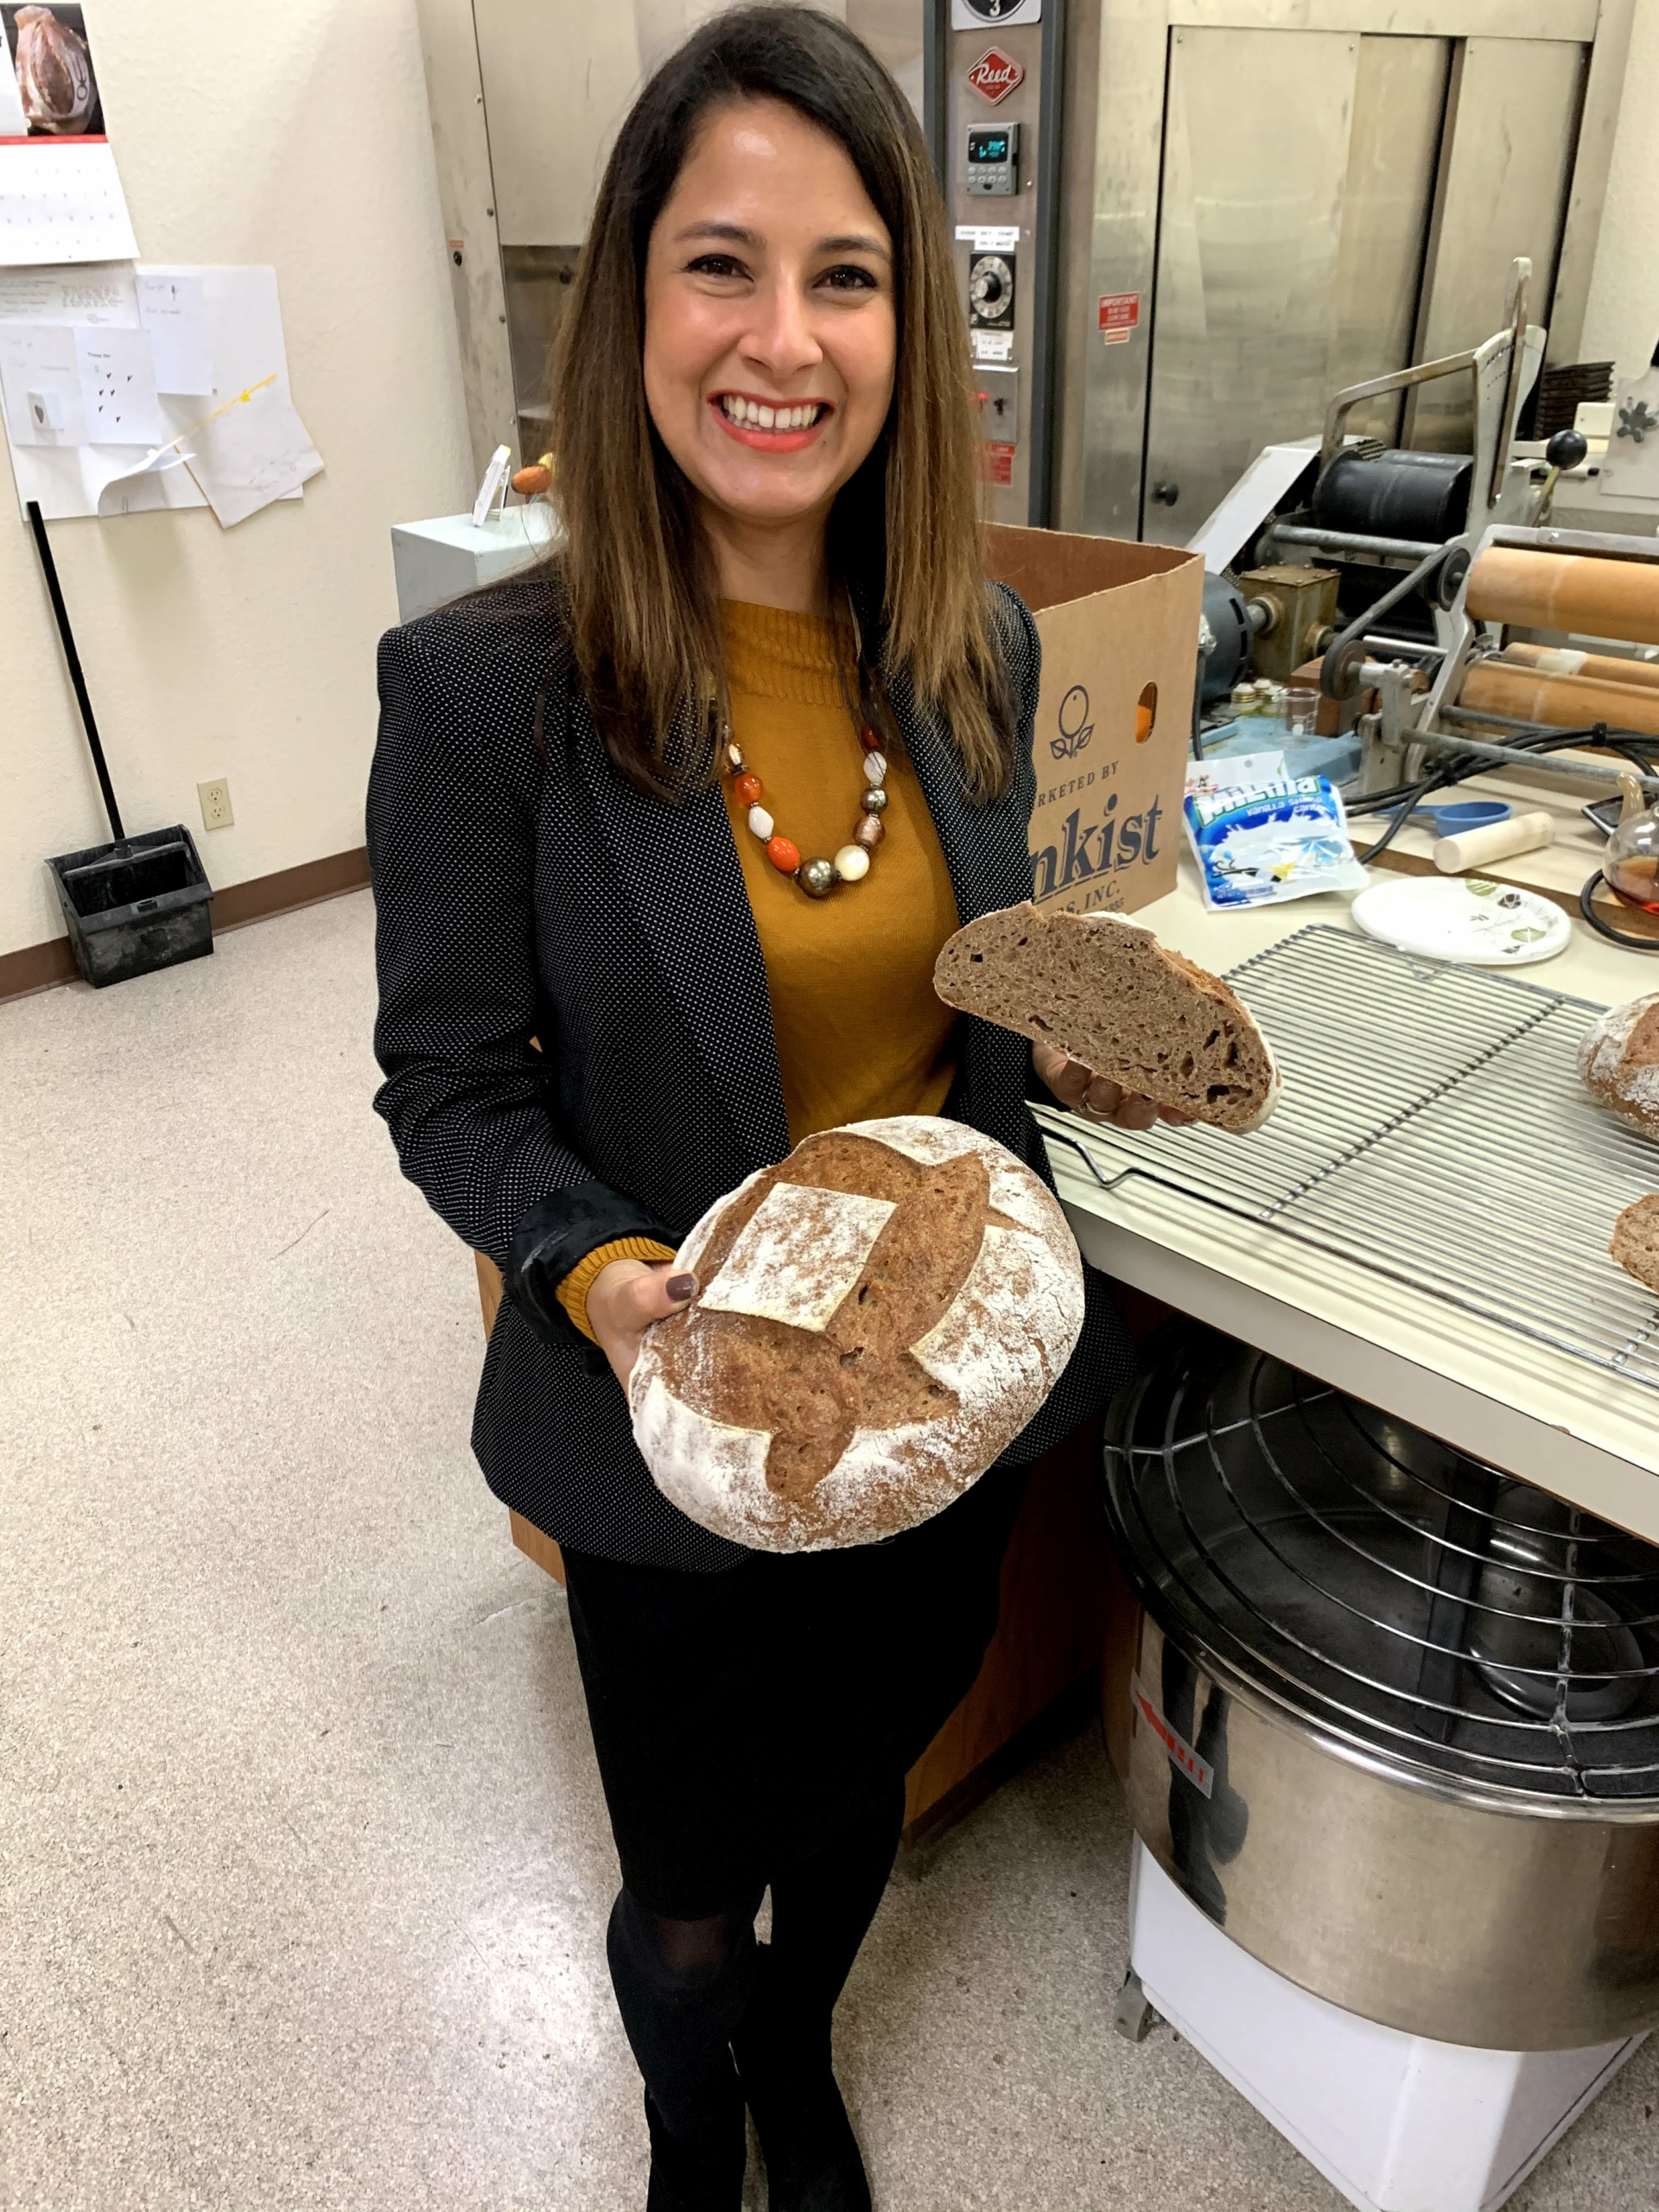
- Our new executive director, Casey Chumrau, has extensive international wheat marketing experience gained as a marketing manager for USW’s South American region, based in Santiago, Chile, and as a USW market analyst.*
- IWC invests one-third of its annual budget into research that will help Idaho growers produce high-quality wheat that customers demand. Research ranges from production practices to end-use quality.
Learn more about the Idaho Wheat Commission on its website here and on Facebook, Twitter, Instagram, Pinterest and YouTube.
*USW wants to thank Blaine Jacobson, who recently retired after many years as IWC’s executive director, for his dedicated service to wheat farmers and support for export market development.
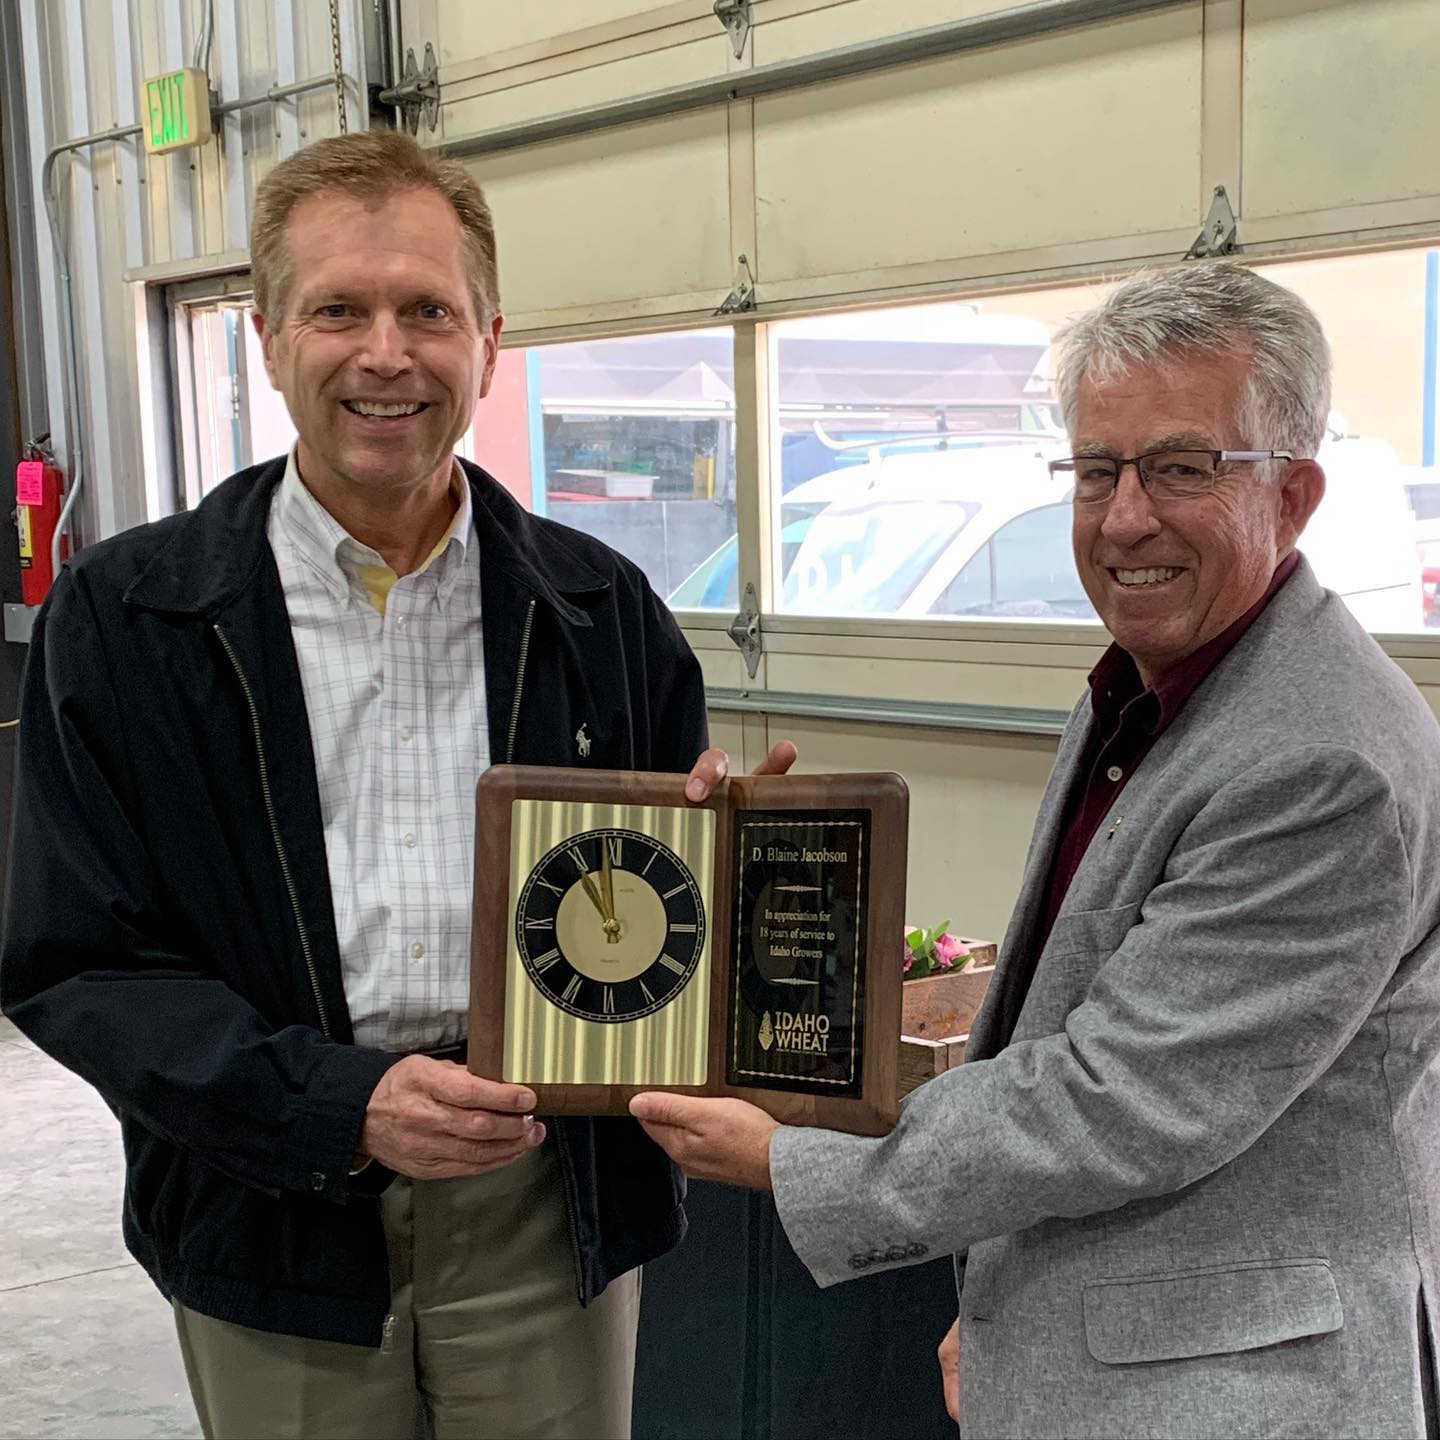
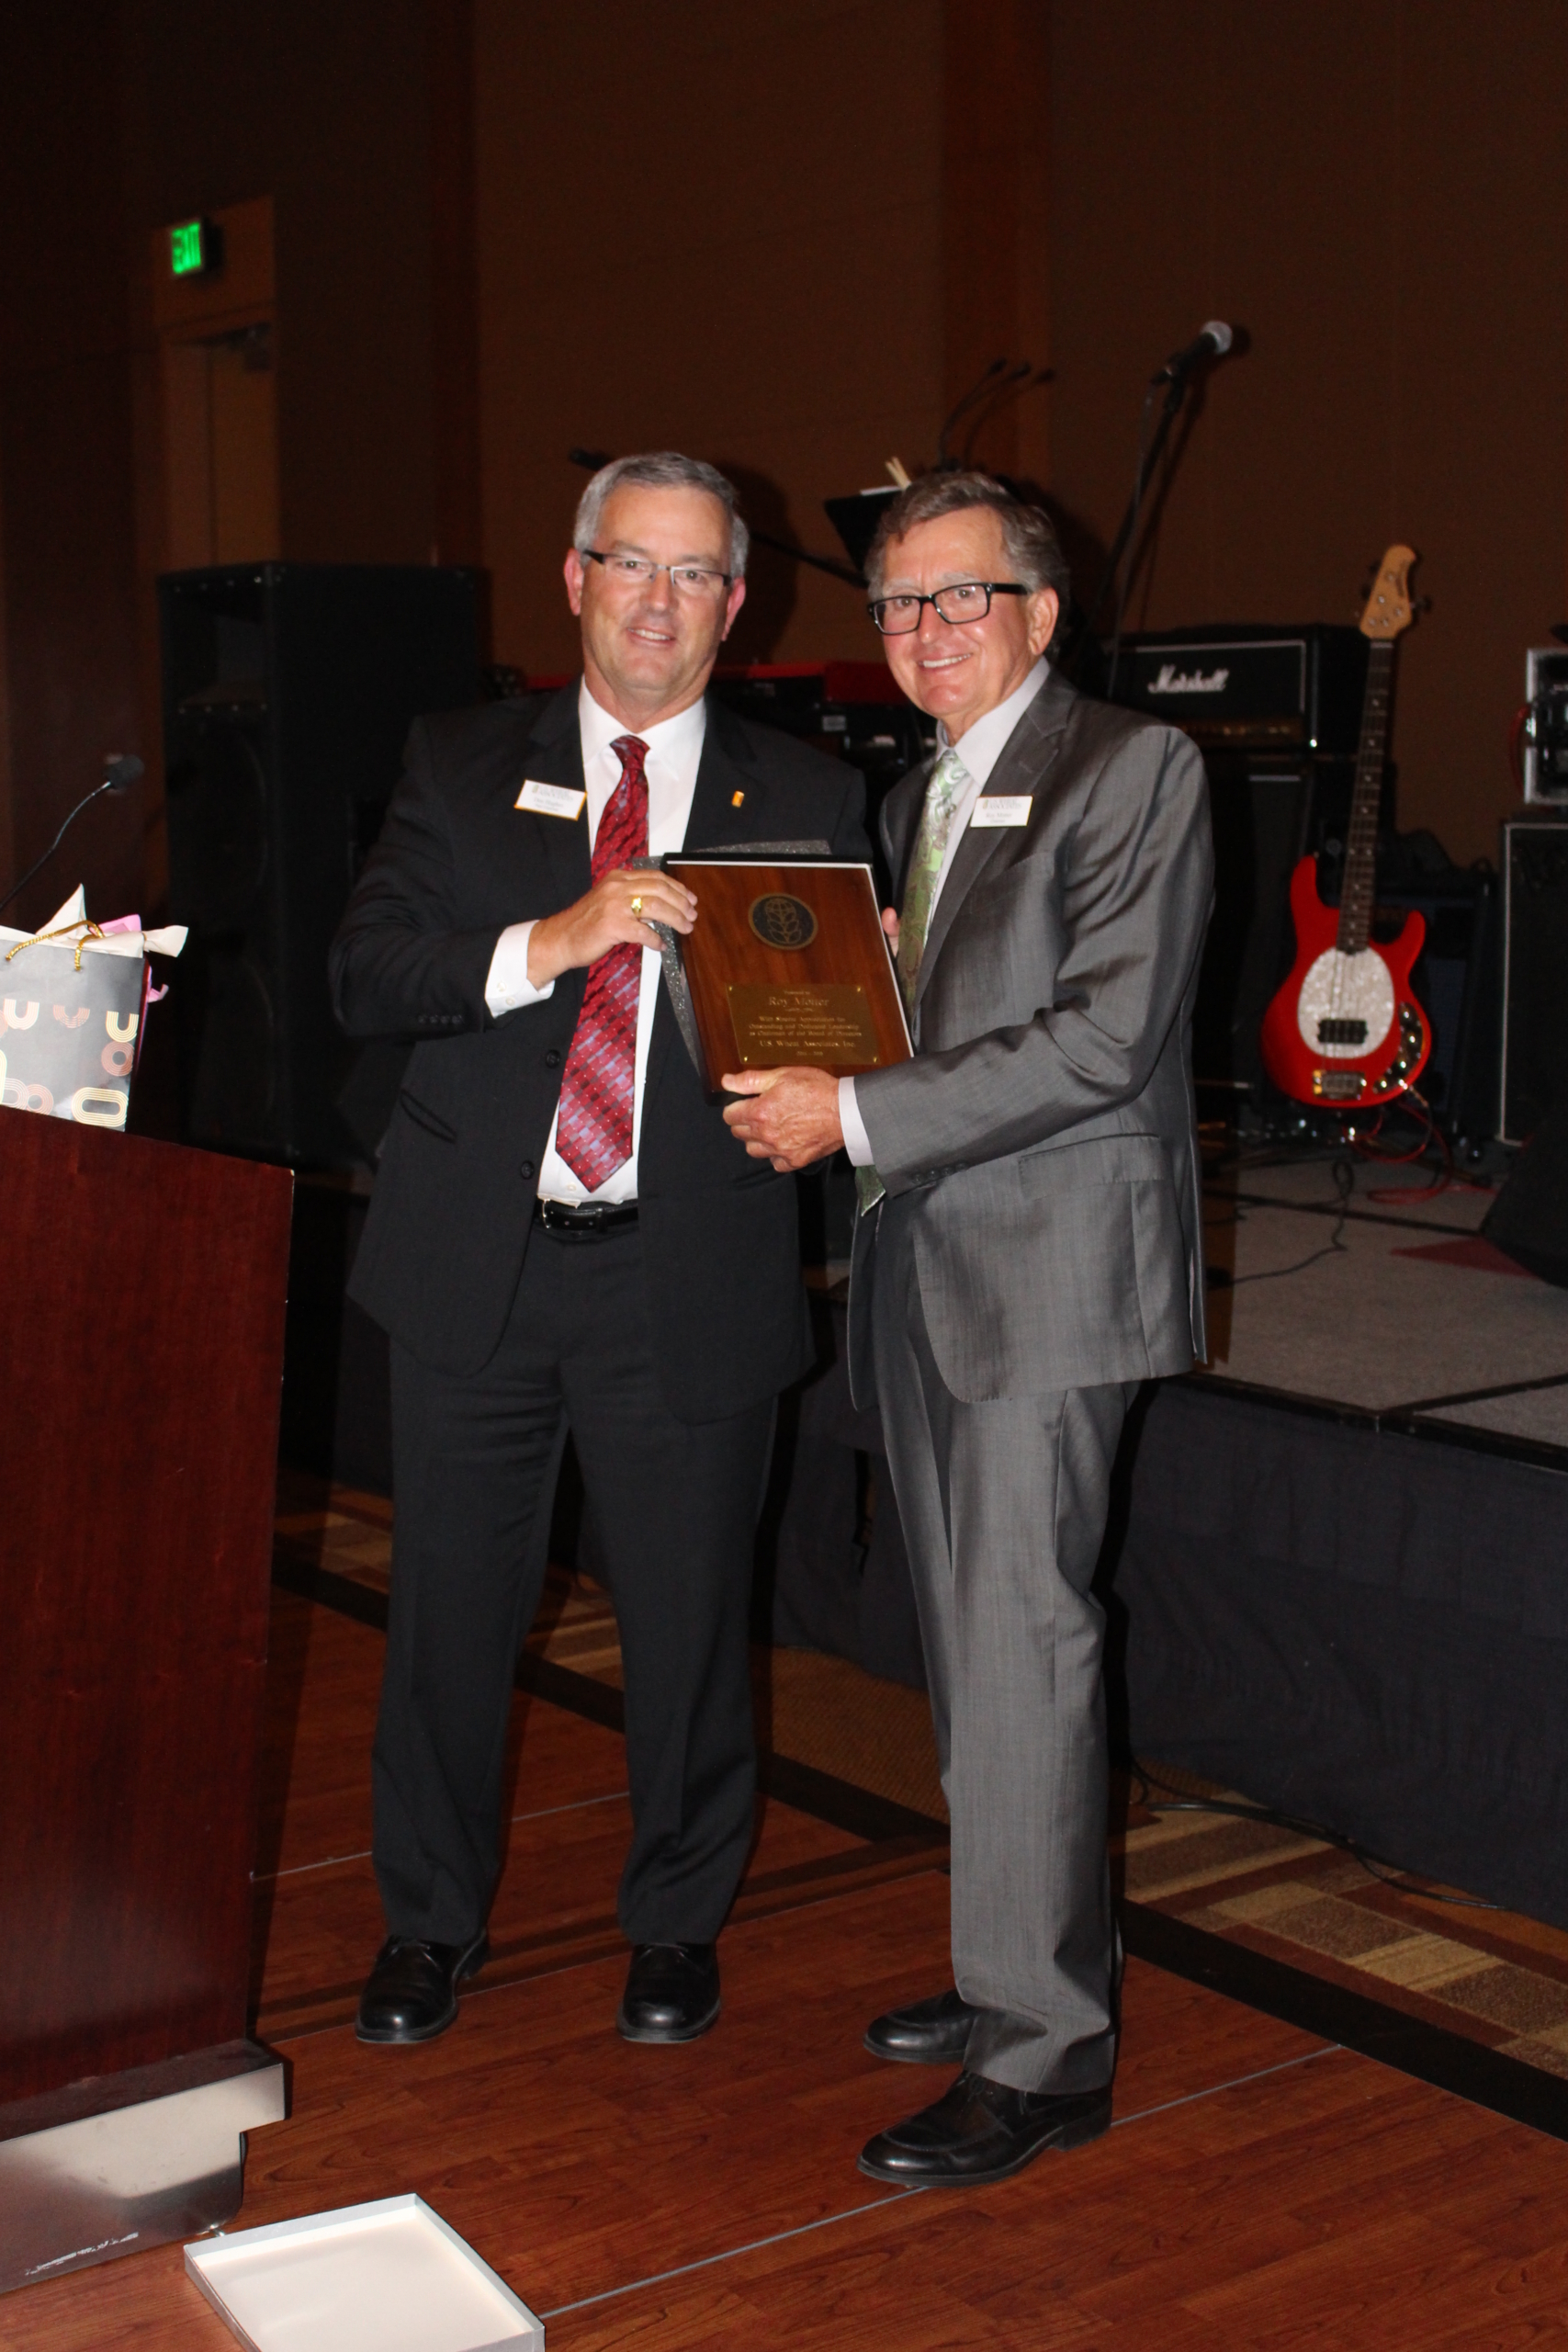
Longtime IWC Executive Director Blaine Jacobson (L) retired in June 2020 after 18 years of service. He’s show here being congratulated by IWC Chairman Ned Moon.
IWC Commissioner and wheat farmer Jerry Brown represented Idaho at the 2017 USW Crop Quality Seminars in Asia.

IWC Commissioner Clark Hamilton (directly behind photo in white), a farmer from Idaho, participated on the 2018 USW Board Team that traveled to China and Taiwan.

IWC Commissioner and Idaho wheat farmer Bill Flory traveled to Japan with USW to participate in the 2019 Japan Buyers Conference.