Inland grain elevator with grain rail cars to help demonstrate rail rates.

By Claire Hutchins, U.S. Wheat Associates Market Analyst

Gulf and Pacific Northwest (PNW) hard red spring (HRS) and hard red winter (HRW) basis values have jumped significantly in the last month due to increased domestic secondary rail rates and limited export elevation capacity, both driven by stronger-than-expected U.S. agricultural export sales to China.

It is important for overseas wheat buyers to understand the potentially significant impact of price movement in the domestic secondary rail market on export prices.

U.S. railroads auction domestic freight in the “primary railcar auction market.” Grain shippers can meet their need for rail capacity by trading this freight among themselves in the secondary railcar auction market at prices above or below the primary tariff rate, depending on national supply and demand conditions. According to the USDA Agricultural Marketing Service (AMS), the secondary railcar market evolved to enable rail movements of grain to be more responsive to market pressures, like increased commodity exports or reduced railcar availability.

This year, AMS data show the average secondary rate for shuttle trains to be delivered in October was up 36 percent between July 30 and Aug. 20 to $1,172/car, nearly three times greater than the previous 3-year average.
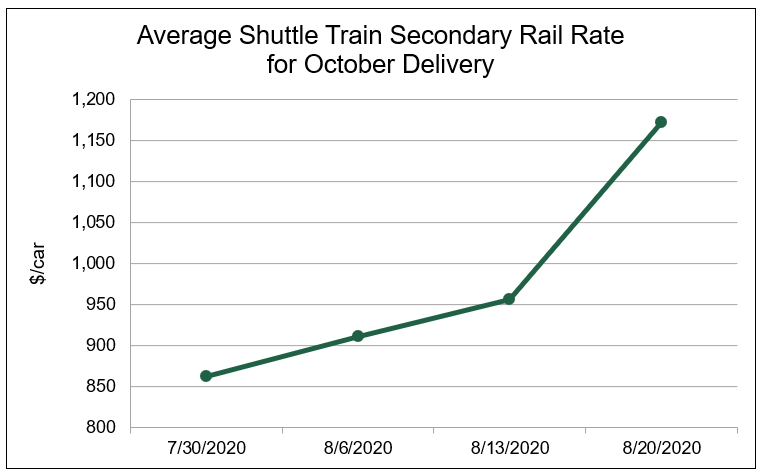
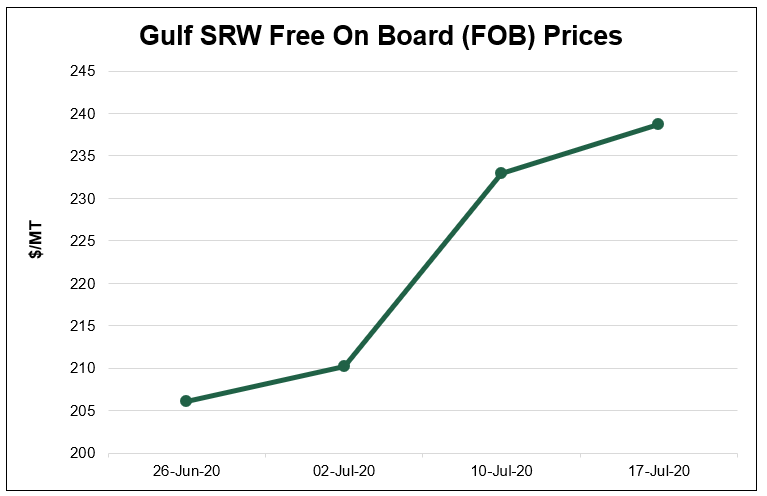
Over the same period, Gulf HRS 14.0 (12% moisture basis) export basis increased 16 percent to $2.20/bu, PNW HRS 14.0 export basis increased 21 percent to $2.00/bu. Gulf HRW 12.0 export basis increased 11 percent to $1.95/bu and PNW HRW 12.0 increased 24 percent to $2.55/bu.
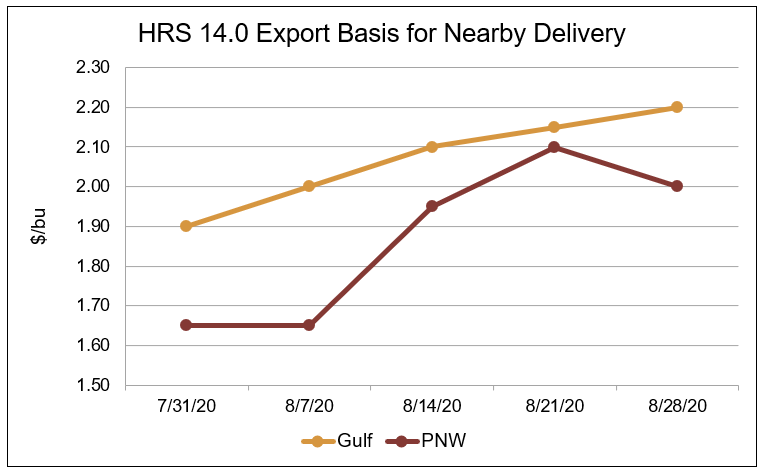
According to U.S. grain traders, the unexpectedly swift pace of agricultural commodity exports to China and rail labor shortages due to COVID-19 furloughs are supporting secondary rates and, in turn, wheat export basis levels.
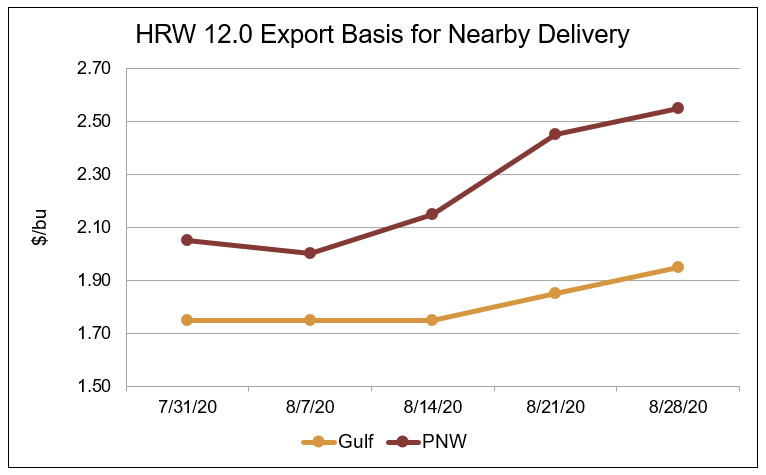
“If rail logistics through October, November and December run smoothly, we could see secondary rail rates plateau,” said one grain trader. “But if things go wrong in terms of weather or continued labor shortages, we could see more upside to secondary rail rates in the near future.”

Limited export elevation capacity out of the Gulf and PNW due to the swift uptick in Chinese demand for U.S. agricultural goods continues to add support to wheat export basis values.
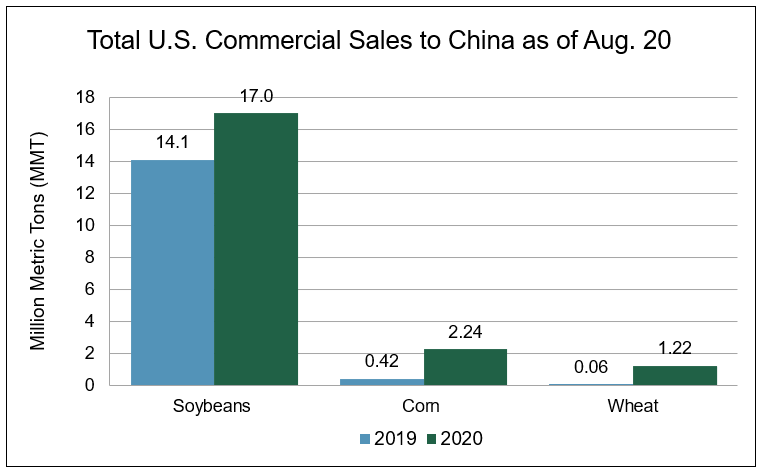
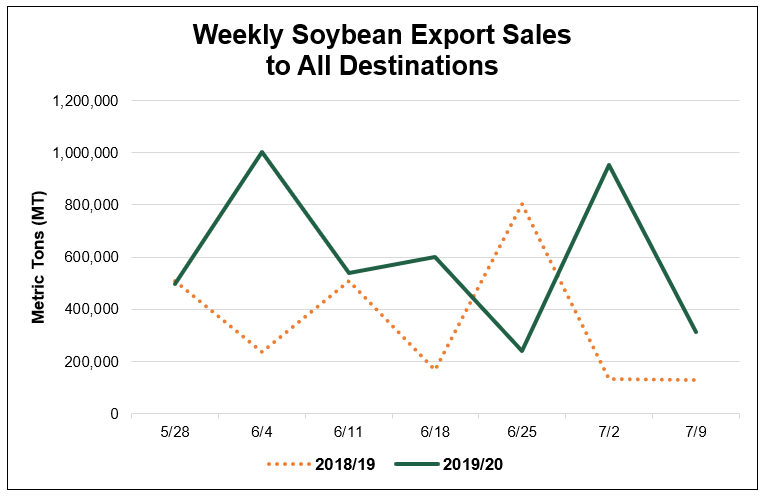
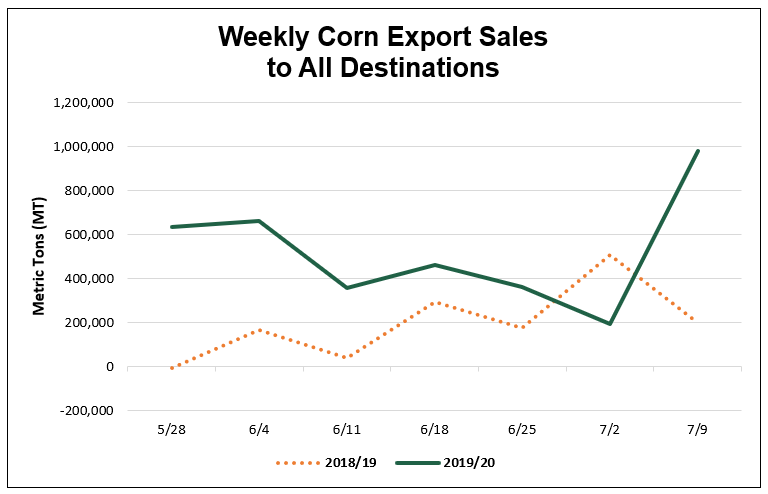
“September and October are at capacity; we can’t add a lot more business for those months. If anyone were to sell anything for delivery in those periods, it would raise elevation costs substantially,” said another grain trader. Additionally, export elevators are going to charge more to elevate wheat in the next couple of months because they expect to store more corn and beans at that time of year. It is more complex and expensive for export elevators to handle multiple commodities at the same time, said a representative from the U.S. grain trade.

Soybeans. “A lot of customers are surprised by the fact that export capacity is filling up so quickly with soybeans,” said a U.S. grain trader. The reason, however, is no surprise: China’s dramatic increase in U.S. soybean purchases this year compared to previous years. According to USDA, China bought 17.0 million metric tons (MMT) of U.S. soybeans for delivery in the soybean marketing year 2019/20, which ended Aug. 31. That is 21 percent more than the 14.1 MMT China purchased for delivery in marketing year 2018/19.

Corn.  Export sales to China for marketing year 2019/20, at 2.24 MMT, are more than five times greater than the amount sold in 2018/19.

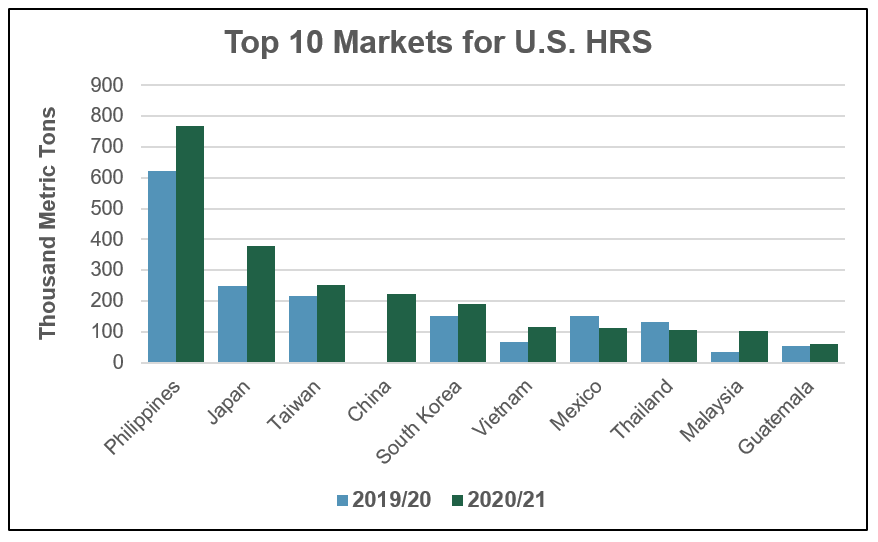
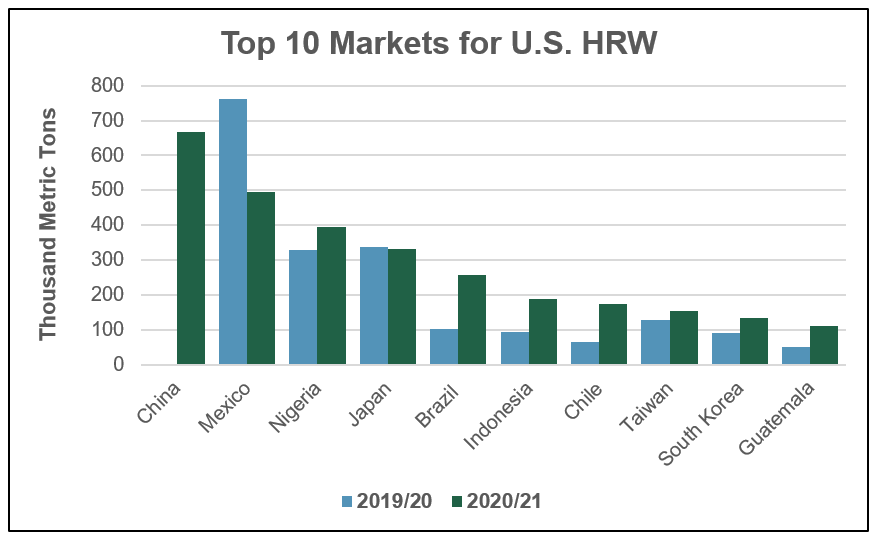
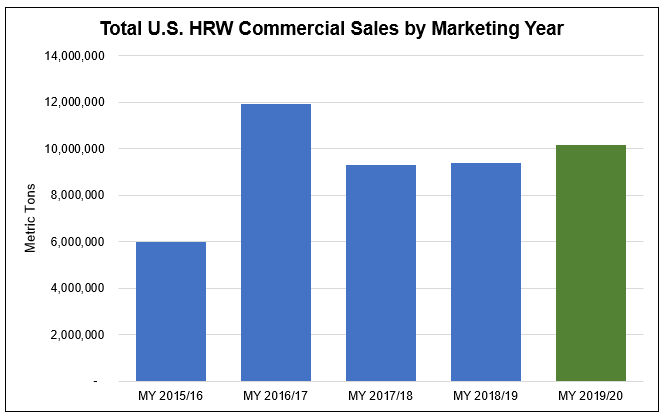
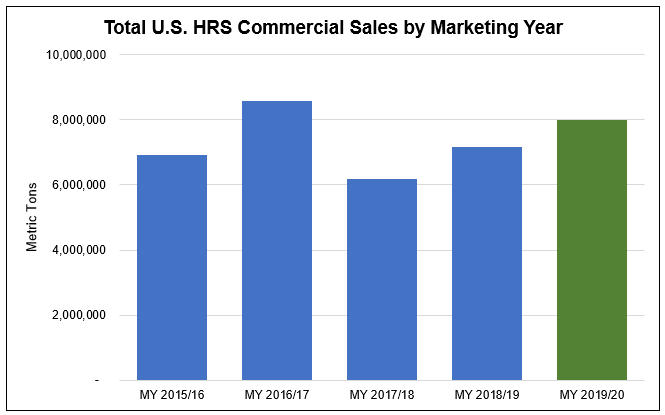
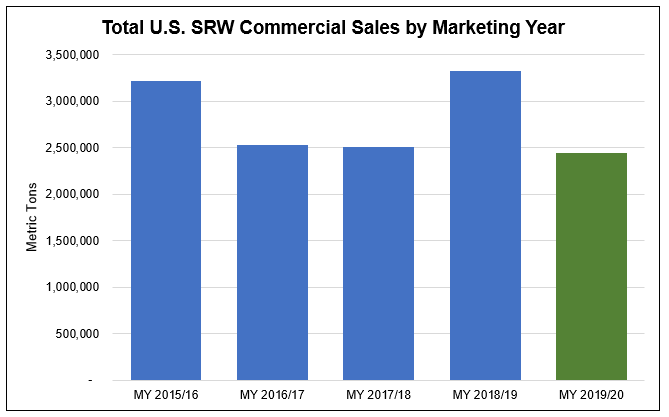
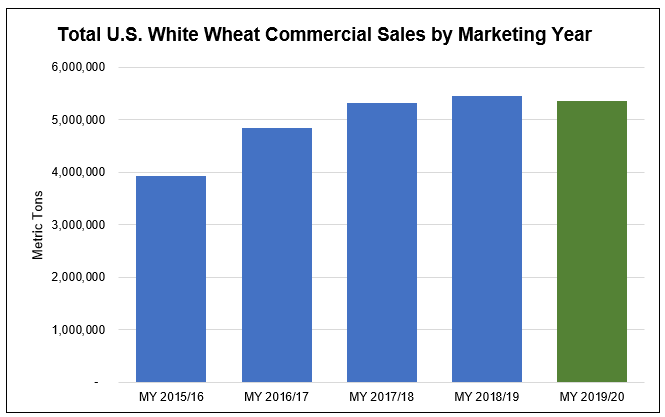
Wheat. It is no secret China has re-emerged as a buyer of U.S. wheat in a big way. According to USDA, as of Aug. 20, total U.S. wheat export sales to China total 1.22 MMT, for delivery in the current wheat marketing year. magnitudes greater than the 60,500 metric tons (MT) sold this time last year. China is currently the second largest market for U.S. wheat in marketing year 2020/21, which started June 1.

“If China wants to purchase more U.S. wheat for October, November and December deliveries, we could see export basis levels go higher in the near future,” said an industry contact.


thumbnail

By Claire Hutchins, USW Market Analyst

USDA estimates the United States will export 25.9 million metric tons (MMT) of wheat in 2020/21, 2 percent behind last year’s pace if realized. However, two months into marketing year (MY) 2020/21, total U.S. wheat commercial sales are 8 percent ahead of last year’s pace at 9.62 MMT and are 12 percent ahead of the 5-year average.

To date, export sales of hard red spring (HRS) wheat, white wheat and durum are significantly ahead of last year’s pace. Sales of hard red winter (HRW) wheat are nearly in line with last year, while sales of soft red winter (SRW) lag 2019/20. Success in individual markets such as China and Brazil due to policy changes and strong education programs by U.S. Wheat Associates (USW) are supporting overall sales. As in other markets, competitive pricing for U.S. wheat is helping fuel a faster import pace by traditionally strong U.S. wheat buyers like the Philippines, Japan and South Korea.

Here is more detail about the current factors underlying U.S. wheat export sales.

HRS. Total HRS export sales of 2.85 MMT are 28 percent ahead of this time last year and are 12 percent ahead of the 5-year average. Sales to the Philippines, the top market for HRS, are 23 percent ahead of last year at 768,000 MT and are 52 percent ahead of the 5-year average. Rising per capita consumption combined with population growth and competitive HRS prices are supporting strong sales to the Philippines early in MY 2020/21.

In Japan, the second largest market for HRS, sales of 379,000 MT are up 52 percent on the year.

“We had good start this year in the Japanese market following the U.S. and Japan trade agreement implemented on January 1,” said Rick Nakano, USW Country Director in Japan. “This gives U.S. wheat a better opportunity to be traded on equal footing with similar classes of wheat from Canada. This results in a great outcome for U.S. wheat to satisfy the needs of Japanese millers that now pay the same price mark-up as for Canadian wheat. Additionally, the relative price increase for Canadian spring wheat has also supported HRS demand in the Japanese market.”

Source: USDA ERS export sales data as of July 23, 2020

White. Total U.S. white wheat sales are 23 percent ahead of last year at 1.93 MMT, 12 percent ahead of the 5-year average. In South Korea, the second largest market for U.S. soft white wheat, export sales are up 27 percent on the year and are 4 percent ahead of the 5-year average.

“The price of U.S. white wheat has been much more competitive than comparable Australian classes during the first and second quarter of 2020,” said C.Y. Kang, USW Country Director in South Korea. Kang added that HRS and U.S. white wheat sales to South Korea are up on the year in part because South Korean instant noodle production is up on increased demand during the COVID-19 pandemic.

Sales to Japan, the third largest market for U.S. white wheat are 3 percent ahead of this time last year at 235,000 MT.

“The demand for U.S. Western White (WW) wheat, a blend of U.S. soft white wheat and U.S. club wheat, has been stable in Japan with strong consumption for confectionery products including sponge cake and biscuits. U.S. WW is a unique product and cannot be substituted by Australian, Canadian or domestically grown Japanese wheat,” said Nakano.

Source: USDA ERS export sales data as of July 23, 2020; about 99% of white wheat sales are soft white and soft white sub-classes

HRW. Total HRW sales are slightly below last year at 3.52 MMT, but 21 percent ahead of the 5-year average. Strong export programs to China and Brazil are supporting HRW sales in the first few months of 2020/21.

As of July 23, China has purchased 669,000 metric tons (MT) of HRW after no purchases in 2019/20. Strong HRW export sales so far in 2020/21 can be attributed to the Phase One agreement between the United States and China and HRW’s competitive prices compared to other classes of U.S. wheat. So far in marketing year 2020/21, China is the largest market for HRW.

HRW export sales to Brazil are more than double this time last year at 257,000 MT and are 85 percent ahead of the 5-year average. According to Miguel Galdos, USW Regional Director in South America, increased sales to Brazil can be attributed to the Brazilian government opening a tariff rate quota (TRQ) which allows up to 750,000 MT of non-Mercosur (South America’s free trade bloc) wheat to enter the country tariff-free. Strong educational programs in Brazil by USW are encouraging millers to take advantage of the high quality and competitive prices of U.S. wheat. To date, Brazil is the fifth largest market for HRW.

“USW provides the best trade and technical service to our customers and we are here for Brazilian mills for any need they have,” said Galdos.

Source: USDA ERS export sales data as of July 23, 2020

Durum. Total durum export sales are 6 percent ahead of this time last year at 385,000 MT and are 57 percent ahead of the 5-year average. Export sales to Italy, the largest market for U.S. durum, are more than double this time last year and are significantly higher than the 5-year average.

“Italy needs the high protein content of durum from North America, because it does not produce enough high protein durum locally,” said Rutger Koekoek, USW Regional Marketing Director for the European Region.

It is expected that Italy will produce an average volume of durum this year and will need to import large volumes of North American durum wheat again in MY 2020/21.

“I am still expecting an above average export volume of U.S. durum to Italy this marketing year,” said Koekoek.

SRW export sales are a different story. Total SRW export sales are down 21 percent on the year to 927,000 MT, 17 percent behind the 5-year average.

“It is a price story,” said one grain trader, “we’re priced out of the world market, especially to our buyers in Latin America and Nigeria.” Between early January and late July, the average export price for SRW was $234/MT, 8 percent higher than the same period last year and 12 percent higher than the 5-year average.

In Colombia, the second largest market for SRW, export sale of 73,000 MT are 18 percent behind last year’s pace and 22 percent behind the 5-year average.

“Colombian mills bought more wheat than they needed between March and May due to demand uncertainty around COVID-19. They are now covered for the next couple of months. Higher prices are also impacting 2020/21 SRW sales to Colombia,” said Galdos.

High SRW export prices early in 2020, which continued into late July, are also having a significant impact on SRW demand in Nigeria, which has imported no SRW yet in 2020/21.

Source: USDA ERS export sales data as of July 23, 2020

thumbnail

By Claire Hutchins, USW Market Analyst

The inverted spread in export prices for U.S. soft red winter (SRW) and hard red winter (HRW) that has appeared occasionally recently settled into the market in early July. What is happening to fuel this situation?

First, there are limited exportable supplies of SRW along the Mississippi River due to lower planted area in key states. That lower supply of SRW is also competing for export elevation capacity in the Center Gulf with increased export demand for soybeans and corn. U.S. Wheat Associates (USW) believes these two factors could continue to support Gulf SRW export prices in the coming weeks.

Source: USW weekly Price Report

Between June 26 and July 17, Gulf SRW free on board (FOB) prices increased 16 percent to $239/MT.

With planted area down 13 percent and 12 percent in two key SRW-producing states, Illinois and Missouri, respectively, the recent harvest did little to improve exportable supplies of SRW. The SRW harvest in states tributary to the Mississippi River feeding into Center Gulf export terminals, was “a flash in the pan” said one grain exporter.

“We don’t have abundant supplies up and down the Mississippi River and rail rates are just too high for it to make sense to pull SRW supplies inland from the Midwestern states,” said another trader.

A swift uptick in export demand for U.S. soybeans and corn is limiting export elevation capacity out of the Center Gulf, which adds support to nearby Gulf SRW export prices. According to U.S. grain traders, customers may have difficulty finding export capacity for “grocery boats” (vessels containing multiple commodities or multiple classes of wheat) out of the Center Gulf for nearby deliveries which supports SRW export prices.

Soybeans. “A lot of customers are surprised by the fact that export capacity is filling up so quickly with soybeans,” said one industry contact. The reason, however, is no surprise: China’s dramatic increase in U.S. soybean purchases this year compared to previous years. According to USDA, China bought 1.49 million metric tons (MMT) of U.S. soybeans between May 28 and July 9 for delivery in 2019/20. That is nearly 35 percent more than the 959,000 metric tons (MT) China purchased over the same period in 2019. U.S. soybean sales to all destinations, between May 28 and July 9, reached 4.15 MMT, nearly double the volume over the same period in 2019.

Source: USDA FAS Export Sales data as of July 9, 2020

Corn. Between May 28 and July 9, total U.S. corn export sales, to all destinations, reached 3.65 MMT, more than double the volume sold over the same period in 2019. Export sales to Mexico, the largest market for U.S. corn, reached 815,000 MT during the previously noted 2020 period, nearly quadruple the total volume sold in 2019. Between July 2 and July 9, USDA reported China bought 768,000 MT of U.S. corn, its largest weekly purchase since October 2011.

Source: USDA FAS Export Sales data as of July 9, 2020

It is interesting to note that Gulf SRW FOB prices for August delivery are currently more than all HRW prices from the Texas Gulf. As of July 17, USW reported that HRW ordinary FOB for August delivery was $216/MT and HRW 11 percent protein (on a 12 percent moisture basis) was $220/MT compared to $239/MT for SRW.

Photo above: A grain barge headed downstream on the Mississippi River.


thumbnail

By Claire Hutchins, USW Market Analyst

Despite challenging market factors, U.S. wheat exports for marketing year (MY) 2019/20, which ended May 31, totaled 26.9 million metric tons* (MMT) (988 million bushels), ahead of USDA’s export volume estimate of 26.4 MMT (970 million bushels). That is 4 percent ahead of MY 2018/19 and 10 percent greater than the 5-year average of 24.4 MMT (897 million bushels).

Commercial sales of all classes of wheat in MY 2019/20 exceeded 2018/19 levels in part from favorable market factors including abundant exportable supplies, strong harvest qualities, and competitive export prices at the beginning of the marketing year.

This offset such bearish factors as a strong U.S. dollar, competitor’s advantages, difficult winter wheat planting conditions, significant delays to the spring wheat and durum harvests, uncertainty about U.S. trade policies, and recent challenges during the COVID-19 pandemic.

Throughout the year, even in the face of the pandemic restrictions on meetings and travel, U.S. Wheat Associates (USW) representatives were able to sustain a strong level of service and information flow to its customers, with support from its state commissions members and USDA’s Foreign Agriculture Service export market development programs.

Hard Red Winter. Significantly greater production and attractive export prices buoyed hard red winter (HRW) exports year-over-year. Total 2019/20 HRW exports came in at 10.2 MMT (375 million bushels), 9 percent ahead of last year. According to USDA, higher yields due to cool, moist conditions during the 2019 growing season more than offset decreased planted area. HRW production increased 26 percent in 2019/20 to 22.7 MMT (834 million bushels). The average HRW export price in the first two months of MY 2019/20 fell 4 percent from the year prior to $233/MT. Increased exports to Mexico, the largest market for HRW, Taiwan, Indonesia, Brazil and Colombia more than offset reduced exports to Nigeria, Japan, Iraq and Egypt. Sales to Mexico totaled 2.61 MMT (95.9 million bushels), the highest on record and 22 percent more than last year. Sales to Nigeria, the second largest market for HRW, fell 11 percent from last year to 1.01 MMT (37.1 million bushels). HRW sales to China picked up in 2019/20 to 302,000 MT (11.1 million bushels) compared to the zero metric tons sold in 2018/19.

Hard Red Spring. Total hard red spring (HRS) commercial sales of 8.0 MMT (294 million bushels) were 12 percent greater than last year and 36 percent greater than the 5-year average of 1.45 MMT (53.3 million bushels). Exportable supplies were relatively stable year-over-year as higher beginning stocks in 2019/20 cushioned reduced production. Commercial sales to the Philippines, Japan, Taiwan, South Korea and Vietnam, the top five export markets for HRS, all outpaced 2018/19 sales. HRS sales to China for delivery in 2019/20 at 146,000 MT (5.36 million bushels) were more than 4 times greater than the quantity sold for delivery in 2018/19.

Soft Red Winter. Soft red winter (SRW) sales fell 27 percent on the year to 2.45 MMT (90.0 million bushels) as reduced exportable supplies supported export prices. USDA estimates 2019/20 SRW production fell 17 percent from last year to 6.50 MMT (239 million bushels). The average SRW export price for 2018/19 was $217/MT, but for almost the entire second half of the marketing year, SRW futures prices were higher than HRW futures. Exports to 8 out of the top 10 SRW markets fell below 2018/19. Sales to Mexico, the top market for SRW, fell 11 percent from last year to 815,000 MT (29.9 million bushels). Price sensitive buyer Egypt made no SRW purchases in MY 2019/20. Sales to Colombia, the fourth largest market for SRW, increased 11 percent year-over-year to 288,000 MT (10.6 million bushels).

White Wheat. Total commercial sales of soft white (SW) and hard white (HW) wheat of 5.37 MMT (197 million bushels) were slightly less than last year but still 14 percent ahead of the 5-year average of 4.69 MMT (172 million bushels). HW sales represent about 4 percent of the total. Sales to 3 of the top 5 white wheat markets fell below 2018/19. Sales to Japan, the second largest market for white wheat, fell 21 percent from last year to 701,000 MT (25.8 million bushels). Sales to the Philippines, the top market for white wheat, increased 14 percent from last year to 1.51 MMT (55.5 million bushels).

White Wheat Sales

Note that USDA reports both SW and hard white (HW) in its U.S. White Wheat commercial sales. HW represents about 4% of total White Wheat sales.

Durum. USDA reported 2019/20 durum sales at 965,000 MT (35.5 million bushels), nearly double last year’s figure and 70 percent greater than the 5-year average on significantly increased European Union (EU) imports. EU durum production fell 14 percent year-over-year on sharply lower harvested area, prompting greater imports from the United States. Italian imports of U.S. durum nearly tripled last year’s import volume at 672,000 MT (24.7 million bushels).

*Slight adjustments will be made when final commercial sales data is published on June 11.

thumbnail

By Claire Hutchins, USW Market Analyst

Each year in May, the Wheat Quality Council (WQC) hosts a three-day winter wheat tour across Kansas and parts of surrounding states to assess hard red winter (HRW) wheat conditions and yield potential. For the past 50 years, caravans of industry stakeholders including farmers, journalists, economists, millers, traders and agronomists have joined together to report on the crop.

This year, with the uncertainty of the COVID-19 pandemic, WQC could not conduct the traditional tour. Instead, Kansas Wheat and K-State Research and Extension (KSRE), in conjunction with the Kansas Department of Agriculture, and other industry partners held a virtual wheat tour.

Instead of the traditional process, a small group of crop scouts surveyed hundreds of fields in Kansas between May 18 and May 21, and estimated environmental, disease and pest pressures and yield potential by region and for the whole state. These estimates represent a snapshot in time and are subject to change with environmental developments.

Stakeholders followed the tour closely through social media (#wheattour20) and in summaries conducted on the Zoom conference service at the end of each day. The event started with some trepidation as drought in the western third of the state, dryness in the state’s central corridor and broad freeze damage in April had raised concerns about what scouts would find.

“Overall, the crop was in better condition than I personally was expecting,” said Justin Gilpin, CEO, Kansas Wheat. “The last two weeks of moisture have really aided secondary tillers emerging in the central corridor and heads are filling with the added moisture.”

After three days of sampling, the state’s 2020/21 wheat crop potential (planted 2019) was estimated at 7.73 million metric tons (MMT), 7 percent below USDA’s May 12 estimate of 8.33 MMT and 16 percent below last year’s output of 9.20 MMT. The state’s average estimated wheat yield came in at 44.5 bu/acre (2.99 MT/ha), 14 percent below last year’s realized yield average of 52.0 bu/ acre (3.50 MT/ha).

According to Kansas Wheat, the state’s north-central district has been plagued by spring drought, and stripe rust and barley yellow dwarf are starting to emerge. The spring freeze also had a significant effect on the crop in that area. The tour estimated the average yield potential for north central Kansas at 41.1 bu/acre (2.76 MT/ha).

“Quality-wise, good rains will help with yield and test weights in the central corridor,” said Gilpin.

Image courtesy of KSU Wheat and Forage Extension Pathology.  

The crop looked better in northwest Kansas but was still variable. Jeanne Falk Jones, Multi-County Extension Agronomist, KSRE said, “April took a toll on the wheat crop this year with all the cold temperatures.”

She reported cosmetic leaf burn from cold temperatures on April 2 and 3, and again April 12 to 15. The area has suffered from drought stress, weed pressure due to thin stands, low pressure wheat streak mosaic virus, tan spot and stripe rust. The average yield potential was 51.7 bushels per acre (3.48 MT/ha).

In west-central and southwest Kansas, the driest parts of the state, the wheat is thin and short. Gary Millershaski, Kansas Wheat Commissioner from Lakin, Kan., reported that many acres of wheat had been abandoned due to extreme drought conditions in the spring and fall. In addition, planted acres were already down significantly in the area. He said only 30 percent to 40 percent of wheat in the area emerged before winter, which had a negative effect on yield potential.

Severe drought stress in the eastern part of Seward County, Kan. Photo courtesy of Romulo Lollato.

Buyers should keep in mind that crop yield and grain protein content are generally inversely related. Fields that were fertilized for 50.0 bu/acre (3.36 MT/ha) that end up with lower yields should produce a crop with higher protein levels.

Millershaski said, “I believe our quantity is going to be down a little bit, but I feel like our quality is going to be unbelievable.”

Calculated yield potential for west-central Kansas was 42.5 bu/acre (2.86 MT/ha), and the southwest Kansas estimate came in at 32.4 bushels per acre (2.18 MT/ha).

“It is amazing how the crop was still holding on, holding out hope for just one shot of rain. Cool night temperatures have helped the wheat from burning up. In those areas of 20 to 25-bushel wheat, if it catches a rain, it may run up to 35 bushel wheat, which is an amazing testament to the wheat varieties,” said Gilpin.

To see more information about the 2020 virtual wheat tour, click here.

Header Photo: Evidence of freeze damage in central Kansas. Photo courtesy of KSU Wheat and Forage Specialist, Romulo Lollato.

thumbnail

The new crop U.S. wheat harvest is underway in south Texas and U.S. Wheat Associates (USW) will publish its first “Harvest Report” for marketing year 2020/21 on Friday, May 29.

USW Harvest Reports are published every Friday afternoon, Eastern Daylight Time, throughout the season with updates and comments on harvest progress, crop conditions and current crop quality for hard red winter (HRW), soft red winter (SRW), hard red spring (HRS), soft white (SW) and durum wheat.

Anyone may subscribe to an email version of the “Harvest Report” at this link. USW includes links in the email to additional wheat condition and grading information, including the U.S. Drought Monitor, USDA/NASS Crop Progress and National Wheat Statistics, the official FGIS wheat grade standards and USDA’s World Agricultural Supply and Demand Estimates report. Harvest Reports are also posted online on the USW website here.

The weekly Harvest Report is a key component of USW’s international technical and marketing programs. It is a resource that helps customers understand how the crop situation may affect basis values and export prices.

USW’s overseas offices share the report with their market contacts and use it as a key resource for answering inquiries and meeting with customers. USW/Mexico City also publishes the report in Spanish.

USW wants to thank and acknowledge the organizations that make “Harvest Reports” possible, including:

  • California Wheat Commission Laboratory;
  • Durum Wheat Quality and Pasta Processing Laboratory, North Dakota State University (NDSU)
  • Great Plains Analytical Laboratory;
  • Plains Grains, Inc.;
  • State Wheat Commissions;
  • USDA/Federal Grain Inspection Service;
  • USDA/Foreign Agricultural Service;
  • USDA/Agricultural Research Service Hard Winter Wheat Quality Laboratory;
  • USDA/National Agricultural Statistics Service;
  • Wheat Marketing Center;
  • Wheat Quality & Carbohydrate Research, Department of Plant Sciences, NDSU;
  • Wheat Quality Council.


thumbnail

By Claire Hutchins, USW Market Analyst

U.S. wheat farmers across the Northern Plains are hard at work trying to plant spring wheat for the 2020 harvest. Their efforts depend on widely varying regional conditions so many producers are behind schedule while some have pulled ahead.

USDA’s most recent crop progress report shows total U.S. spring wheat planting at 42 percent complete, slightly ahead of last year but well behind the 5-year average of 63 percent. Cool temperatures, overly wet field conditions and delayed field work from the 2019 harvest are slowing farmers down in northwestern Minnesota, eastern North Dakota and northeastern South Dakota. More favorable conditions are helping farmers progress across other parts of the Northern Plains.

According to USDA, only 40 percent of Minnesota spring wheat is planted, compared to the 5-year average of 67 percent. Most delays are in the northwestern part of the state.

“We’re only 15 to 20 percent planted in northwestern Minnesota where wetter conditions are slowing field work,” said Charlie Vogel, Executive Director of the Minnesota Wheat Research and Promotion Council.

Conditions are similar in eastern North Dakota.

According to Dr. Frayne Olson, Crop Economist and Marketing Specialist at North Dakota State University, eastern North Dakota had a very wet fall and not all of the region’s wheat, canola, corn and soybeans were harvested on time which pushed fall field work into spring 2020.

“Spring weather has remained cool and wet with very few days suitable for field work,” he said.

As of May 10, North Dakota spring wheat is only 27 planted compared to the 5-year average of 63 percent. Overly wet field conditions could drive farmers to opt for “Prevent Plant,” or fallow out, spring wheat acres. Farmers are eligible for crop insurance payments on fields when extreme conditions prevent them from planting the crop by a final, prescribed planting date.

“Even if some fields will be planted past the optimum seeding dates, there is still good yield potential,” Dr. Olson said. “Weather during the growing season will have a major impact on final yields and quality.”

In northeastern South Dakota, wet weather and colder soil temperatures are also delaying farmers’ ability to do spring field work. In this part of the state, farmers are also likely to Prevent Plant a portion of spring wheat acres. USDA estimates South Dakota producers will plant 850,000 acres (about 344,000 hectares) of spring wheat this year.

“At the beginning of the season, I thought we would come in a lot lower than USDA’s number due to overly wet field conditions, but recently, in the central part of the state, dealers sold of out spring wheat seed,” said Reid Christopherson, Executive Director of the South Dakota Wheat Commission. “Overall, we could end up close to USDA’s numbers.”

According to Christopherson, farmers are closely watching the decline in corn and ethanol demand and its impact on corn prices compared to spring wheat.

“Early in the planting window, producers may choose spring wheat over corn. Late in the planting window, they may choose soybeans,” said Christopherson.

Despite challenges in the eastern Northern Plains, spring wheat producers further west and south are making strong progress in the 2020 planting season.

“Warmer, drier weather, better harvest progress in fall 2019 and an earlier start are giving farmers a boost in central-western and southwestern Minnesota,” said Vogel.

About 85 percent of intended spring wheat acres are planted in that part of the state. Vogel estimates Minnesota’s southwestern region could add 50,000 “new” spring wheat acres this year (acres that would traditionally would have gone to either corn or soybeans) as producers explore spring wheat and cover cropping rotational opportunities that could add value to overall farm profitability.

“In the north, we saw record seed corn sales in January, but we have recently seen record seed corn returns so some of those acres will go to spring wheat,” said Vogel.

In late March, USDA estimated Minnesota producers would plant 1.35 million acres (about 546,000 hectares) of spring wheat, down 7 percent year-over-year, if realized. Given recent marketing and price challenges with corn and the interest in new crop rotation systems, Vogel estimates Minnesota producers could actually plant up to 1.44 million acres (about 583,000 hectares) of spring wheat this year, in line with 2019.

In western North Dakota, “Producers are seeing better progress due to warmer, drier conditions,” said Erica Olson, the North Dakota Wheat Commission’s Market Development and Research Manager. Despite the possibility for more Prevent Plant acres in the eastern part of the state, she believes North Dakota spring wheat acres could still reach USDA’s estimate of 6.10 million acres (about 2.5 million hectares) in 2020.

Favorable planting weather in central South Dakota is helping farmers get into the fields and plant more quickly than their peers in the northeastern part of the state. According to USDA, 75 percent of the state’s spring wheat is planted compared to 38 percent last year and the 5-year average of 78 percent.

Dry weather is helping Montana producers work through their spring wheat planting efforts. Though only 50 percent of the state’s spring wheat is in the ground compared to the 5-year average of 62 percent, progress is right in line with last year. Additionally, according to Cassidy Marn, Executive Vice President of the Montana Wheat and Barley Committee, Montana could see more spring wheat planted area than USDA’s initial estimate of 3.30 million acres (about 1.34 million hectares) due to potentially less acres planted to barley in 2020.

“We could easily reach 3.30 million acres this year, and I wouldn’t be surprised if we reached 3.40 to 3.50 million acres,” said Marn, which would be up to 1.42 million hectares.

thumbnail

By Claire Hutchins, USW Market Analyst

The condition of the U.S. hard red winter (HRW) wheat crop is not improving. Farmers – and the markets – are concerned about the threats to yield potential from wide-spread April freezes and increasing dryness across a significant portion of the Central and Southern Great Plains.

USDA’s most recent crop condition ratings reflect the weather effects on the 2020-21 winter wheat crop, reducing the total crop rated good to excellent from 62 percent to 57 percent. According to Romulo Lollato, Kansas State University Wheat and Forages Specialist, drought weakens winter wheat’s ability to recover from freeze damage and both conditions challenge winter wheat yield potential. So the change in ratings is focused on the HRW crop, based on the worsening dryness in north central and southwestern Kansas, eastern Colorado and south central Nebraska. And this week, the extent of freeze damage is being monitored carefully in the following states.

Kansas.  Between April 20 and April 27, USDA reduced its Kansas winter wheat rating from 46 good to excellent to 40 percent as localized freezes and expanding dryness threaten crop progress.

“About 50 to 60 percent of the state’s wheat was impacted to varying degrees by freeze damage,” said Lollato. In north-central Kansas, several counties showed varying but considerable freeze damage. According to researchers at Kansas State University, the crop in that region needs moisture soon to help with freeze damage recovery. In parts of central Kansas, late-sown fields, following a soybean crop, showed severe leaf and tiller damage from recent freeze events. In parts of northwestern Kansas, dry soil conditions predisposed plants to freeze damage and in some cases severely damaged fields turned yellow and brown as plant tissue deteriorated. Southwest Kansas is still extremely dry and could impact the crop’s ability to recover from freeze damage. Looking ahead, hot, dry temperatures across the state could further challenge the crop’s ability to recover from freeze damage.

Late-sown fields in north central Kansas showed severe leaf and tiller damage from recent freeze events. Photos courtesy of Romulo Lollato.

Colorado. “Our story is dryness – we need rain,” said Brad Erker, Executive Director of the Colorado Wheat Administrative Committee.

Several weeks ago, USDA rated 54 percent of Colorado’s winter wheat in good to excellent condition. As of April 27, only 37 percent of the state’s crop is in top condition. Moderate to severe drought plagues the eastern third of the state, where the winter wheat is grown. There is little evidence yet that freeze damage has impacted the crop, but reports are still developing. Looking ahead, high temperatures and no moisture in eastern Colorado could continue to pressure the state’s yield potential.

The April 23 UNL Drought Monitor showed a significant expansion of abnormal dryness and severe drought across the Central and Southern Plains, with dry conditions expanding in North Dakota and the Pacific Northwest.

Nebraska. HRW conditions in Nebraska are better than in Kansas and Colorado, with 69 percent of the crop rated good to excellent. However, freezing temperatures impacted wheat across the state. According to Sarah Morton, Agriculture Promotion Coordinator for the Nebraska Wheat Board, temperatures close to 10 degrees Fahrenheit (-12 degrees Celsius) in Nebraska’s southern Panhandle “knocked the wheat back and turned it brown,” slowing growth. Freezing temperatures in southwest Nebraska also burned back the wheat. Adequate soil moisture levels and warmer temperatures in the western part of the state are expected to help the crop recover from recent freezes. On April 23, the University of Nebraska – Lincoln Drought Monitor introduced abnormal dryness into the south-central portion of the state.

Oklahoma. Reports from Oklahoma show significant freeze damage in some of the state’s southwest and south-central counties. Some counties in southwestern Oklahoma reported freeze damage across 40 to 70 percent of the crop. In several extreme cases, some areas in south-central Oklahoma showed freeze damage in virtually every field. The April 23 Drought Monitor expanded areas under abnormal dryness and severe drought in the Oklahoma Panhandle. As of April 27, 62 percent of the state’s HRW is in good to excellent condition, down from 65 percent the week before, with expectations that the condition will continue to deteriorate.

“It’s an extremely challenging time for southwestern Oklahoma producers,” said Mike Schulte, Executive Director of the Oklahoma Wheat Commission.

Header photo courtesy of Romulo Lollato.

thumbnail

By Claire Hutchins, USW Market Analyst

It is no secret that these are uncertain times. As countries across the world work to contain and combat the novel coronavirus (COVID-19) outbreak, U.S. Wheat Associates (USW) is closely monitoring the effects of the outbreak on global wheat trade dynamics. Over the past several weeks, several major wheat exporters have implemented measures to curb 2019/20 wheat exports to stabilize domestic prices amidst greater demand uncertainty—spurring upward price movement across the world. In its April World Agricultural Supply and Demand report, USDA updated its global wheat trade estimates to reflect new policy and price dynamics.

Russia. Between March and April, USDA reduced its total Russian wheat export forecast for 2019/20 by 4 percent to 33.5 million metric tons (MMT), 7 percent less than last year, if realized, on the news of potential grain export restrictions for the remainder of the marketing year. In late March, Russia’s Agriculture Ministry proposed a 7.0 MMT quota on the country’s grain exports between April and June to stabilize prices and protect food security during the COVID-19 pandemic. Despite USDA’s reduced Russian wheat export estimate, members of the grain trade believe the quota will not have a serious impact on the country’s grain exports. During the same period last year, Russia exported a total 4.90 MMT of all grain, well below the quota threshold. According to a Russian grain trader interviewed by AgriCensus, “I think some 4.5 to 5.0 MMT of wheat exports between April and June were expected … so a 7.0 MMT quota is not dramatic.” Between March 19 and April 12, according to AgriCensus, Russian FOB prices for 12.5% protein wheat (on a dry moisture basis) increased 10 percent from $208/MT to $229/MT.

Ukraine. During the week of March 27, Ukrainian millers and bakers asked the government to limit grain exports and related products to maintain domestic bread prices during the coronavirus pandemic. According to Reuters, Ukraine’s economy ministry said it would control wheat exports, sell flour on the domestic market and agree with traders on a maximum volume of exportable wheat. UGA, Ukraine’s major trader’s union agreed with an economy ministry proposal to limit the country’s 2019/20 wheat exports to 20.2 MMT, 26% higher than last year, if realized. USDA’s total 2019/20 Ukrainian wheat export forecast is unchanged month-over-month at 20.5 MMT. By April 8, Ukraine’s total grain exports reached a record 47.0 MMT, 18.1 MMT of which is wheat, up 21% on the year.

Romania. On April 10, Romania’s government issued a military decree banning cereal and other food exports including wheat to non-European Union destinations during a state of emergency, expected to last until mid-May, in response to the COVID-19 pandemic. Romania is a key origin for Egypt’s General Authority for Supply Commodities (GASC) and the unexpected absence of Romania from the global market supported prices between GASC’s February and April tenders. On April 14, GASC bought 120,000 metric tons (MT) of Russian wheat at $240/MT FOB, 5 percent more expensive per metric ton than its February 11 tender when it bought 180,000 MT of Romanian wheat at $228/MT FOB. According to a European grain trader interviewed by Reuters, “There is not much 11.5% or 12% protein (dry matter basis) left in big volumes of 60,000 MT in Russia and Ukraine while Romania is temporarily out of the game.”

European Union, Other. To date, besides Romania, other countries in the EU have not implemented wheat export restrictions. According to USDA, European Union (EU) wheat exports have surged in the past month on ample supplies and competitive prices. In France, the EUs’ top wheat-producing country, total wheat exports in 2019/20 now stand at 8.0 MMT, 12% greater than this time last year. USDA expects total EU wheat exports will reach 31.0 MMT this marketing year, 25% greater than last year and 7% greater than the 5-year average.


United States. The U.S. grain export industry and the government agencies that protect and promote U.S. agriculture are working to ensure continuous trade flows despite market uncertainty during COVID-19. As of April 2, U.S. wheat export sales to date total 25.0 MMT, up 2 percent from last year. On April 9, USDA reduced its 2019/20 U.S. wheat export estimate from 27.2 MMT to 26.8 MMT, still 5% greater than last year and 9% above the 5-year average, if realized. Seasonally slower export sales and higher U.S. wheat export prices through the last half of March pressured USDA’s total U.S. wheat export forecast month-over-month. Heightened domestic demand and large hard red winter (HRW) sales to China supported U.S. export prices between mid-March and early April.

Under these unprecedented circumstances, USW is doing everything it can to continue to promote the reliability, quality and value of all six U.S. wheat classes to our overseas customers. USW encourages our customers and stakeholders to reach out to our colleagues by telephone or email. We are ready to provide the information our customers need about U.S. wheat supplies or market factors, or to answer any marketing and processing questions that may arise. Another option is to submit a question to our “Ask the Expert” page on our website at https://www.uswheat.org/market-and-crop-information/ask-the-expert/.

thumbnail

By Claire Hutchins, USW Market Analyst

According to the March 31 USDA Prospective Plantings report, U.S. total spring-planted wheat area is expected to fall to 12.6 million acres (5.1 million hectares), down 1 percent from 2019/20, if realized. This estimate includes 11.9 million acres (4.82 million hectares) of hard red spring (HRS), down slightly from last year. USDA expects U.S. durum planted area to total 1.29 million acres (522,000 hectares), down 4 percent from 2019/20. For all U.S. wheat, USDA now expects all wheat planted area for harvest in 2020 to total 44.7 million acres (18.1 million hectares), down 1 percent from 2019 and the lowest all wheat planted area since records began in 1919.

North Dakota farmers are expected to plant 6.10 million acres (2.47 million hectares) of HRS, 9% below last year. Last year’s overly wet field conditions affected HRS quality and led to significant cash price discounts at country elevators. According to Dr. Frayne Olson, Crop Economist and Marketing Specialist at North Dakota State University, farmers are “getting very frustrated with HRS quality discounts and the net price they receive at the elevator,” which he says is a disincentive for farmers to plant more HRS.

“I think the North Dakota HRS acreage number is a little low, but it may also reflect USDA concerns about Prevented Planting this spring,” said Dr. Olson. Farmers are eligible for crop insurance payments on fields when extreme conditions prevent them from planting a crop by a final, prescribed planting date, “There are areas in eastern North Dakota and western Minnesota that are going to have potential problems with Prevented Planting. However, that should not be an issue from central North Dakota to eastern Montana.”

The risk of quality challenges with HRS and more favorable marketing opportunities for soybeans compared to HRS also adds pressure to North Dakota HRS planted area. North Dakota producers are expected to plant 6.60 million acres (2.67 million hectares) of soybeans for harvest in 2020, up 18 percent from last year.

Of USDA’s prediction of reduced durum planted area, North Dakota Wheat Commission’s Market Development and Research Manager Erica Olson said, “North Dakota’s durum numbers surprised us a little bit, they were very low last year and we expected to see an increase this year.” USDA expects durum planted area in North Dakota to fall 11 percent on the year to 674,000 acres (273,000 hectares) as producers recoil from last year’s difficult, delayed harvest and cash price quality discounting.

Similar to the situation with HRS, North Dakota farmers are getting “very frustrated with durum quality cash price discounts” at North Dakota elevators, Dr. Olson said, “Farmers look at net income versus risk for growing each crop when deciding what to plant. If a farmer can raise Choice durum, net income is good. However, if you raise Ordinary durum, the math does not work. The risk to reward tradeoff has not been good the past several years.” Stable to slightly higher durum planted area in Canada adds pressure to U.S. durum prices which also discourages U.S. durum planted area.

In Minnesota, USDA predicts HRS planted area will fall 7 percent to 1.35 million acres (550,000 hectares), while soybean planted area will increase 8 percent to 7.40 million acres (3.0 million hectares) and corn planted area will increase 8 percent to 8.40 million acres (3.40 million hectares).

Charlie Vogel, Executive Director of the Minnesota Wheat Research and Promotion Council, has a slightly different opinion about the outlook for HRS.

“We expected HRS planted area to go down in Minnesota—two weeks ago, but it’s a different world now,” he said, citing the recent strong HRS futures rally attributed mainly to increased nearby domestic demand for bulk products.

“Given the futures rally, I now expect Minnesota HRS planted area could be in line with or slightly above last year’s acreage, if we get warm, dry planting conditions through spring,” said Vogel. However, if western Minnesota receives too much precipitation in the coming weeks, he does think farmers in certain areas may also be expected to make Prevented Planting claims for HRS.

Montana producers are expected to plant 3.30 million acres (1.34 million hectares) of HRS this spring, up 14% from last year and the highest since 2002.

According to Sam Anderson, Industry Analyst and Outreach Coordinator at the Montana Wheat and Barley Committee, “It is important to think about harvest and planting conditions last autumn: with lots of moisture, it was hard to get in the field and snow came very early. Those conditions explain most of the changes in this year’s prospective plantings estimate. Farmers were not able to get all their winter wheat in the ground last fall, resulting in the 400,000-acre (162,000-hectare) shift from winter wheat to spring wheat.”

Montana winter wheat planted area is down 20 percent on the year to 1.60 million acres (648,000 hectares).

Updated Winter Wheat Estimates

On March 31, USDA also made minor revisions to the country’s winter wheat planted area from its January forecast, which still hovers around 30.8 million acres (12.5 million hectares), down 1 percent from last year. The hard red winter (HRW) wheat planted area forecast fell slightly from January’s estimate to 21.7 million acres (8.79 million hectares). The soft red winter wheat planted area estimate increased slightly from January to 5.69 million acres (2.30 million hectares), up 9 percent from last year. The white winter wheat planted area forecast increased slightly from January to 3.42 million acres (1.38 million hectares). USDA expects total white wheat acres, planted in both winter and spring, to total 4.10 million acres (1.66 million hectares), in line with last year.