thumbnail

The U.S. durum market remains supported by tight supplies, leading to a reduction in consumption that may, or may not, hold until the 2022 harvest. That is an observation by North Dakota Wheat Commission Policy and Marketing Director Jim Peterson in a Feb. 2, 2022, webinar sponsored by the Northern Crops Institute (NCI).

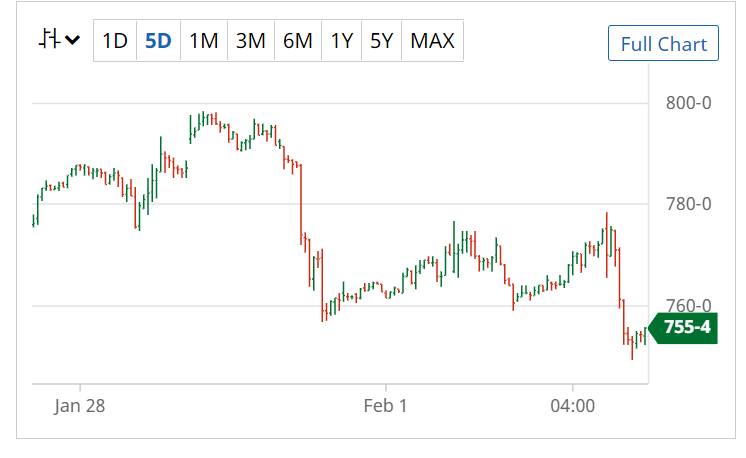
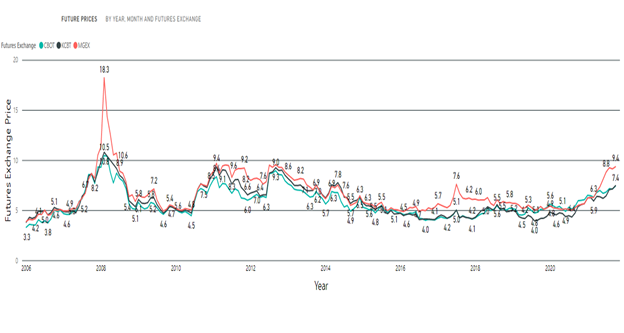
Following a run up fueled by supply issues, durum prices have “softened in values since mid-January,” Peterson said. That is reflected in what the International Grains Council estimates as a 20-year low in total durum use.

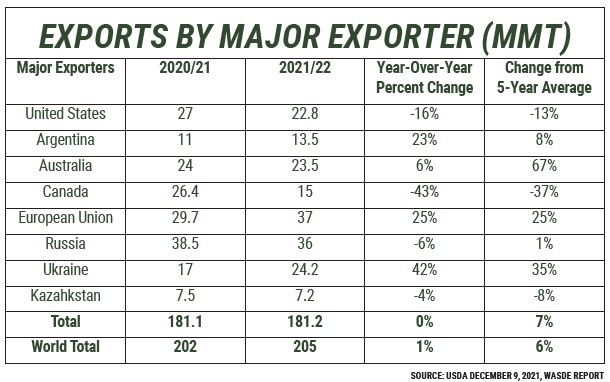
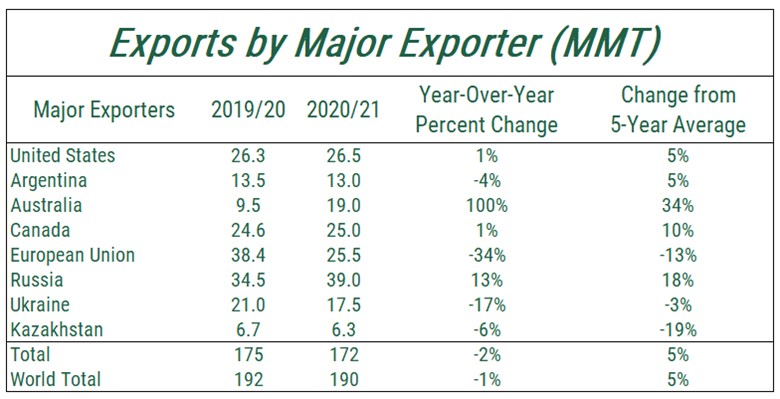
For example, USDA currently expects U.S. durum exports in 2021/22 at 410,000 metric tons (MT). U.S. Wheat Associates (USW) reports commercial U.S. durum sales at about 168,000 MT to date in marketing year 2021/22. That is down from about 658,000 MT at the same time last year. Canadian durum exports from August through December 2021 are also about half their total sales compared to the year before.

This bar chart of U.S. durum market supply and demand for the past six years shows lower production and demand in 2021/22.

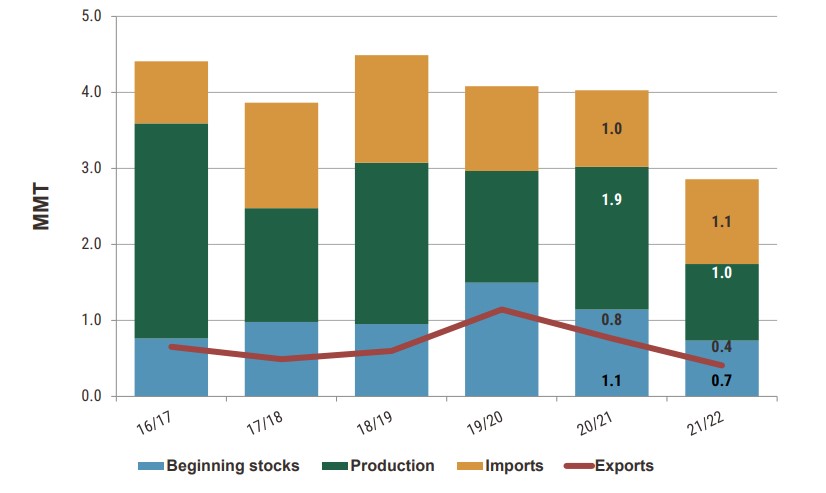
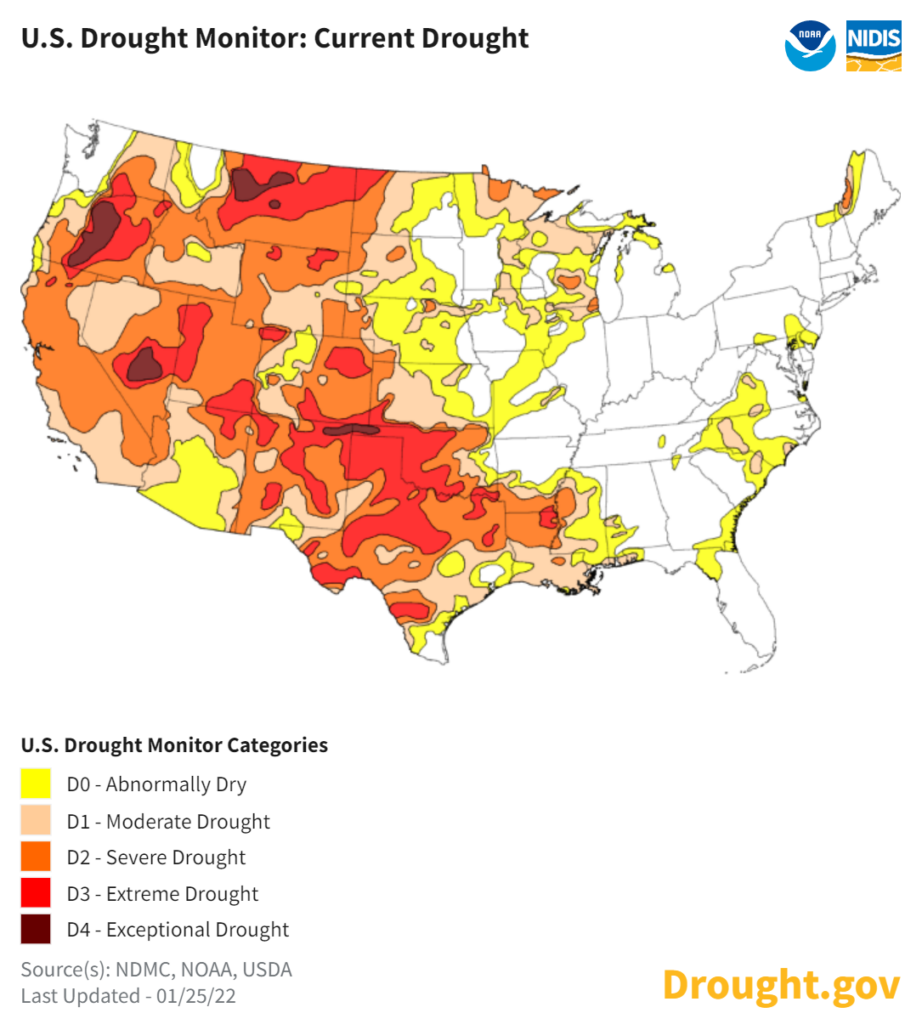
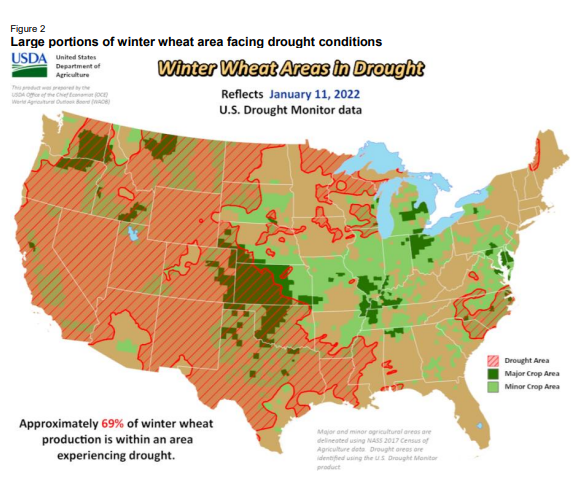
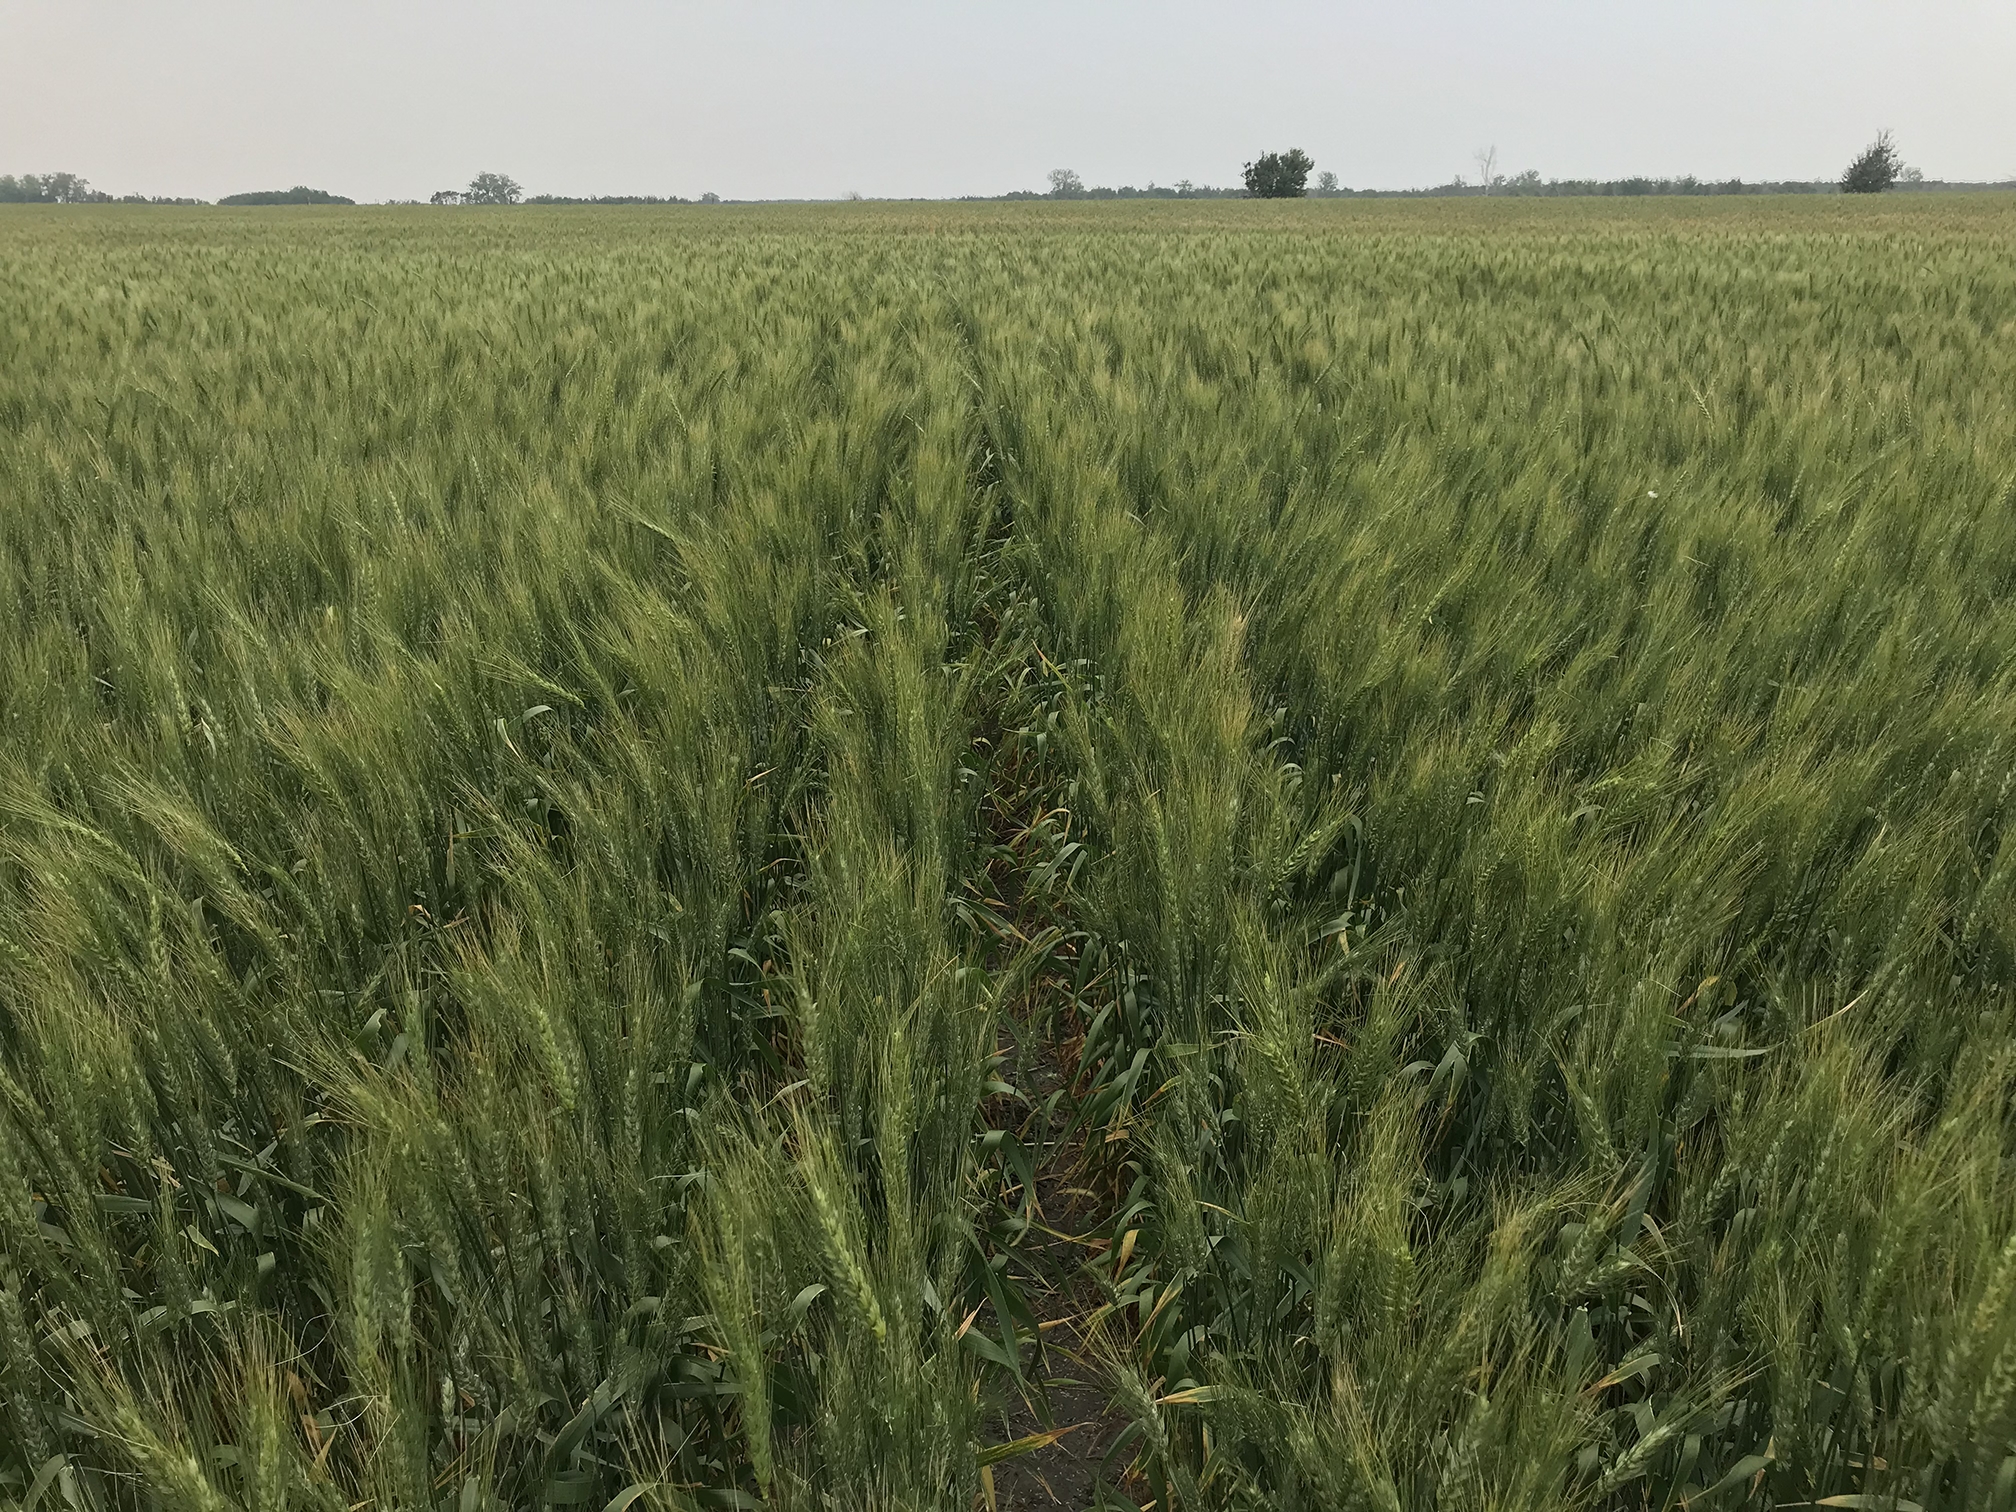
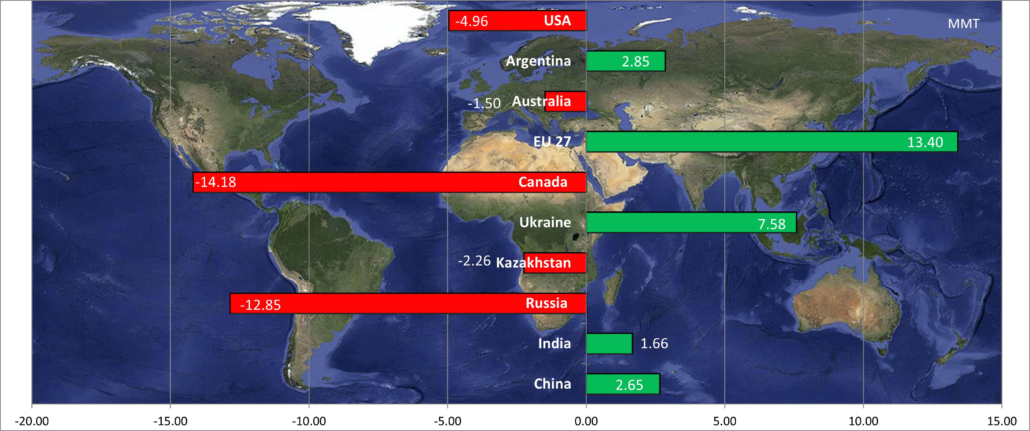
U.S. Durum Market Supply and Demand. Drought cut U.S. durum production in 2021, and in Canada. Higher prices have rationed demand, reflected in USDA’s lower export estimate as of February 2022.

Buying Hand-to-Mouth

Peterson said durum buyers are only purchasing when the market gives them a chance to save some money. In addition, end-users are, when possible, increasing the amount of non-durum wheat flour for pasta production.

“We will see how long that rationing can continue,” Peterson said. He said buyers will have to replenish supplies before the 2022 harvest starts in June.

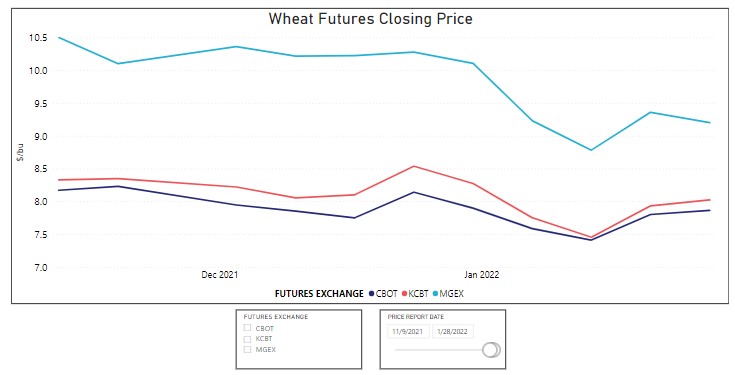
European durum prices are lower than Canadian and U.S. durum market prices. However, we sense more tightness in the European market and hopefully, that will translate into some export sales over the next few months,” Peterson said.

What is Ahead?

Phone of Jim Peterson

Jim Peterson, Policy and Marketing Director, North Dakota Wheat Commission.

North American farmers are now making spring planting plans. In the U.S durum market, farmers will consider the difference in federal crop insurance prices for hard red spring (HRS) and durum crops, Peterson explained.

“There is no question that the durum crop insurance price will be at a premium to spring wheat,” he said. Farmers will know what the difference is after February. In addition, Peterson said U.S. farmers will compare the potential income from durum and spring wheat before making their planting decisions.

Still, the Canadian and U.S. durum markets could see a 10% increase in durum planted area in 2022.

Tight Supplies

Of course, until the 2022 durum crop gets in market position, Peterson noted, “we could have some very tight months coming up depending on what happens with demand.”

Readers can watch a recording of NCI’s one-hour webinar on the world and U.S. durum market online here.

thumbnail

Since late December, U.S. wheat futures prices moved down through mid-January and have bounced up and down since then. For example, prices surged early the week of January 24 but lost steam by the end of the week. And the March ’22 hard red winter future price lost 4% as of Wednesday’s close. Such wheat market volatility is a challenge for importers. And there are many elements adding volatility that deserve a closer look.

Chart shows weekly wheat futures closing prices from November 2021 through late January 2022 demonstrating wheat market volatility

There is Wheat Market Volatility in the weekly closing futures prices for soft red winter (CBOT), hard red winter (KCBT) and hard red spring (MGEX) between November 2021 and late January 2022. Source: USW Price Charting Tool.

Russia and Ukraine

The ongoing tension between Russia and Ukraine has certainly added wheat market volatility. Both countries are major grain exporters, and the market seems to accept that any disruption there could have an immediate effect on supply. One grain trader quoted in AgriCensus said, “you cannot ignore [the topic], and [it] makes any trade decision very difficult to make … until things get clearer.”

But not everybody is so skittish. SoveEcon, a Russian agriculture consultancy, raised its forecast for 2021/22 Russian wheat exports by 200,000 metric tons to 34.4 million metric tons. The consultancy pointed out that the last time Russia invaded Ukraine, it did not disrupt grain exports. However, it did spark wheat market volatility as Black Sea wheat prices rose 25% in just two months.

Persistent Drought

Commercial futures trading also plays a role in wheat market volatility. The managed money takes quick profits that pressure the markets. But speculators also appear to be bullish in their wheat outlook primarily because of ongoing weather challenges to the old and new Northern Hemisphere wheat crops.

And yet a forecast for rain and snow in those areas this week prompted that significant drop in HRW futures prices. It is too early to say what the rest of 2022 has in store, but moisture is needed to put new crop winter wheat on a good footing. So, wheat importers can expect the market to continue moving with weather news.

The illustration of the 02022022 NOAA US Drought Monitor map shows persistent drought in key US wheat production areas contributing to wheat market volatility

Drought Persists in much of the U.S. Plains and Pacific Northwest wheat production regions. To help prepare for ongoing wheat market volatility, importers should monitor how this evaluation changes. Source: NOAA.

Logistic Challenges

Grain traders have had a lot to say recently about rail performance and its impact on export basis the last few months. Since December, a slowdown in rail logistics has supported wheat export basis. Fortunately, traders say those issues improved in January, but rail service for the trade is still behind where it was the year before.

According to the Association of American Railroads, U.S. weekly rail traffic for the week ending January 15 was down 7% compared to the same week last year. All grain shipments, including wheat, were down 11% the same week. In the USDA’s weekly Transportation Report, bids for shuttle service in the secondary railcar market have been high, although down significantly from where they were at the beginning of January.

New Pandemic Normal?

Lastly, we look at the persistent presence of COVID-19. This is the third winter of pandemic-induced challenges. Though lockdowns are increasingly rare, pandemic disruptions continue to rattle parts of the marketplace. It continues to be a significant challenge for logistics. That includes worker shortages and increased absences. Supply chain bottle necks will likely continue to be part of the wheat market volatility equation in 2022.

Help is Available

As these forces continue to affect wheat market volatility, importers can be assured that the U.S. wheat store will remain open for efficient delivery of high-quality milling wheat. Our local U.S. Wheat Associates (USW) representatives are available to help buyers navigate the market’s challenges – and opportunities – no matter how much volatility it throws at them.

By Michael Anderson, USW Market Analyst

thumbnail

Last week, USDA released three reports giving some indication of what may be ahead for the 2022 global wheat market. Those USDA reports were the monthly World Agricultural Supply and Demand Estimates (WASDE) report, the quarterly Grain Stocks report, and the annual Winter Wheat Seedings report.

Considering all three reports, U.S. Wheat Associates (USW) notes that the latest WASDE report showed few unexpected changes to the worldwide balance sheet of wheat. Some upward revisions were made in Argentina and the EU. Still, the reports forecast global consumption far higher than production. The Grain Stocks report reflected the significant drop in total 2021/22 U.S. wheat production. Predictably, U.S. farmers seeded more winter wheat for a second year in a row.

In fact, after winter wheat plantings fell to their lowest level in more than a century in 2020/21, U.S. winter wheat seeded area for marketing year 2022/23 has increased for the second year in a row, up 2% from 2021 and 13% compared to 2020 reported the National Agricultural Statistics Service (NASS) in their annual Winter Wheat Seedings report released Jan. 12, 2022. Winter wheat seeded acres are the most they have been since 2016/17.

Bar graph showing annual U.S. winter wheat seeded area indicates an increase over the past two years to illustrate USDA Reports story.

According to recent USDA reports, U.S. farmers are responding to increased global demand and lower U.S. stocks by seeding more winter wheat in 2022.

The Winter Wheat Seedings report showed farmers planted 23.8 million acres (9.6 million hectares) of hard red winter (HRW). This report is up 1% from 2021, led by Kansas, up 3%, and Texas, up 2%. Notable drops in seeded area came in Colorado, down 2%, and New Mexico down 11%.

The quarterly USDA Grain Stocks report confirmed all U.S. wheat in storage, both on and off farm, was down 18% compared to a year ago, while disappearance was down 16% compared to the year before. Analysts expect ending stocks for the 2021/22 marketing year to be the smallest since 2013/14 at 628 million bushels (17.09/MMT).

Price Signals

Increased cash price this year has no doubt played a role in farmer decisions to seed more HRW acres. Kansas Wheat Commission CEO Justin Gilpin noted higher HRW prices as one reason for a second consecutive year of higher wheat plantings. Year-over-year prices for HRW at 12% protein (12% moisture basis) are up 24%.

Soft red winter (SRW) farmers have also taken advantage of strong pricing and increased export demand to plant more SRW acres. Estimates of SRW for the 2022/23 marketing year are 7.07 million acres (2.86 million hectares), 6% higher than last year. Increased acres are largest in Missouri, up 38%, North Carolina is up 31% and Ohio up 21%. USDA reported decreases in Maryland, down 16%, and Michigan, down 23%. The 2021/22 SRW export pace is 50% ahead of last year’s pace year-to-date.

Estimated white winter wheat (soft white and hard white) are 3.56 million acres (1.44 million hectares). This estimate is up 2% from 2021.

Desert Durum® seeded area in California and Arizona of 90,000 acres (36,421 hectares) is up 15% compared to last year and 20% compared to 2020.

Drought Lingers in the Plains

In the monthly “Wheat Outlook” report published by the Economic Research Service (ERS) of the USDA, analysts reported that major HRW producing states, mostly concentrated in the Plains states, saw conditions for winter wheat degrade since November but noted that spring conditions are more influential on production numbers. Kansas’s Gilpin noted “attention has turned to expanding drought ratings across HRW regions and potentially yield and production impacts. Dry conditions and higher input costs both are concerns.”

NOAA map shows where U.S. wheat production areas overlap with drought conditions to supplement USDA reports article.

By Michael Anderson, USW Market Analyst

thumbnail

By Michael Anderson, USW Market Analyst

U.S. Wheat Associates (USW) represents the interests of wheat farmers in export markets. Each time the USW Board of Directors meet, we report on the latest market information that affects the U.S. wheat marketing environment. At their meeting the week of Jan. 10, 2022, our directors will see continued fundamental support for wheat prices from greater demand worldwide and lower production in major exporting countries.

The next USDA World Agriculture Supply and Demand Report will be released on Jan. 12. Ahead of that report, USDA pegs 2021/22 world wheat production at a record 777.89 million metric tons (MMT), 3% above the 5-year average of 757.4 MMT. Total global supplies are forecast to reach 1,068 MMT, slightly lower than last year. USDA noted lower wheat production in Canada, Russia, and the United States, which all experienced drought in the 2021 growing season.

USDA expects wheat production to be higher in Ukraine, the European Union (EU), Australia and Argentina. Specifically, in Ukraine, production is forecast up 30% this year due to increased planting and favorable weather conditions. In Australia, production is up 700,000 MT to 34 MMT. Argentina may also produce a record wheat crop this year. The Buenos Aires Grains Exchange (BAGE) estimates wheat production at 21 MMT, 1 MMT more than USDA’s December production estimate. USDA estimates 2021/22 world wheat ending stocks will drop 2% from the 5-year average and be 278 MMT, a 12 MMT drop compared to last year and the lowest level since 2016/17.

Global Consumption Outpaces Production

Fundamental support for wheat prices is also seen in global consumption that is expected to increase 7 MMT to 789 MMT, up 1% compared to 2020/21. Both global human wheat consumption and feed wheat use are forecast higher. Feed wheat use is expected to increase 2% to 161 MMT. Lower beginning stocks, drops in production for major exporters, and increased use have supported higher wheat prices overall. In the USDA’s December supply and demand report, the estimated average farm gate price for U.S. wheat is $7.05/bu, a 54% increase year-over-year.

USDA expects global wheat trade to reach 205 MMT, up 1% from last year and 6% more than the 5-year average.

Price Effect on Export Sales

Through Dec. 23, 2021, total U.S. wheat export sales of 15.8 MMT are 23% behind last year’s pace according to USDA commercial export sales data. Soft red winter (SRW) sales are significantly ahead of last year’s pace. USDA projects total 2021/22 exports will hit 22.8 MMT which, if realized, would be 16% less than last year and 13% less than the 5-year average.

Wheat Exports by Country

One year ago, USDA saw winter wheat seeded area was up 5% from 2020 at 32 million acres. USDA’s annual Small Grains Summary, released in September 2021, had U.S. wheat production at 1.65 billion bushels, down 10% from 2020 despite harvested area being up 1% at 37.2 million acres. Winter wheat production was up 9% but spring wheat production was down 44%, soft white production (both winter and spring) was down 16% and durum wheat production was down 46%.

USDA assessed that winter wheat production was 1.28 billion bushels, up 1.1 million bushels with an average yield of 50.2 bu/acre, down 0.7% compared to 2020. The area harvested for winter wheat was 25.5 million acres, up 11% compared to 2020. Hard red winter (HRW) harvested acres were up 10% and production totaled 749 million bushels, 14% more than in 2020. Soft red winter (SRW) production totaled 361 million bushels, up 35% compared to 2020. Spring wheat production was estimated at 331 million bushels, down 44% from 2020. The harvested area totaled 10.2 million acres, down 16% from 2020 with an estimated yield of 48.6 bu/acre. Hard red spring (HRS) accounted for 297 million bushels, down 44% from 2020.

Winter Wheat Planted area from 2021 to 2022

Ten years of winter wheat seeded area data from USDA illustrates another fundamental support for wheat prices.

Start 2022 With USW Market Information Reports

USW monitors USDA’s assessments of the fundamentals supporting wheat prices each month in our Global Wheat Supply and Demand Report. In addition to the January WASDE report, USDA’s Winter Wheat Seeding Report will also be released Jan. 12. Export prices are updated weekly. Visit the Market Information page on our website or subscribe to USW market reports here.


thumbnail

Marketing year 2021/22 (June to May) has been record-setting to date. USDA estimates of global production, trade, and consumption have all outpaced previous years. However, since it’s initial 2021/22 World Agricultural Supply and Demand Estimates (WASDE), USDA has adjusted its forecast down, led by a 17 million metric ton (MMT) reduction in global wheat production by December. Ending stock estimates for the world’s top exporters are also down.

The weather has played a key role this year in lowering production in Canada, Russia, and the United States. Quality concerns following wet harvests in the EU and Australia have affected milling-quality wheat and supported markets. And Russia’s use of an export tax and now plans for an export cap have tightened supply while adding to prices. Other factors, including ballooning ocean freight rates, natural disasters, Covid-19 restrictions, and smaller domestic production in some key countries, have helped prices climb to multi-year highs (see chart below).

Chart of Wheat Exporting Country Stocks and Wheat Price Relationship

Lower stocks and higher prices dominated the first half of the wheat marketing year 2021/22. USDA steadily reduced its global production estimates from June to December mainly from some large exporting countries. Given record world wheat use, the 2021/22 average export price to date for ordinary U.S. hard red winter wheat from the Gulf ($301/MT, above) reflects the situation. Sources: USDA and USW Price Report.

As U.S. Wheat Associates (USW) marks the middle of the 2021/22 export calendar, the following are snapshots of the influential factors for major wheat exporters and how USDA estimates have changed.

Canada

Weather was a strong factor this growing season for Canadian wheat. In the Prairie Provinces, the Normalized Difference Vegetation Index (NDVI), which measures plant health, had the wheat crop maturing four weeks earlier than normal. Hot and dry weather withered the all-wheat estimate to 21.65 MMT, down 33.5% compared to the 5-year average. StatsCan’s wheat estimate of 21.6 MMT is the lowest all-wheat production since 2007. Durum production took an even steeper cut to 2.7 MMT, the lowest ever recorded for the country. Exports are also projected lower. The latest WASDE report forecast Canadian wheat exports to total 15 MMT, 43% less than last year. Year-to-date, Canadian wheat exports are running 38% behind 2020.

Australia

The South Pacific country continues to rebound from a drought-ravaged 2019/20 crop with expectations for a second bumper crop in a row. The latest WASDE report put Australian wheat production at 34 MMT, 8% higher than November’s report and 41% higher than the 5-year average. Exports too were projected higher at 25.5 MMT. Data on quality is still unknown because the Australian crop is in mid-harvest. However, wet weather has led to concern about the final volume wheat that meets milling quality standards.

Russia

Russian wheat production has been on a downward slope since June when USDA estimates of production stood at 86 MMT. The latest string of WASDE reports have cut that estimate to 75.5 MMT with 36 MMT forecast for export. Year-to-date, Russia has exported 19.4 MMT of wheat, 54% of the overall estimate despite a wheat export tax that increased to $91/MT on Dec. 10, more than double in the rate last July. On top of the fluctuating export tax, Russia is considering a wheat export quota set to begin in mid-February.

Ukraine

The Black Sea country has had an impressive production year, up 30% year-on-year, and exports running 17% ahead of last year’s pace at 14.5 MMT. Ukraine’s agriculture ministry signed an agreement with grain traders capping wheat exports at 25.3 MMT, about 1 MMT higher than the latest WASDE’s export projection.

European Union

The EU also saw higher production this year than last, driven mostly by impressive yields in Romania and Bulgaria. Exports are running 11% ahead of last year’s pace and the EU is expected to replace Russia as the year’s leading wheat exporter. Coceral, a European trade association, forecast that the 2022 soft wheat crop will drop to 125.4 MMT, 3.4 MMT less than their 2021 figure despite the area planted being only marginally reduced. Yields however are estimated to be down 3%.

Argentina

The Buenos Aires Grains Exchange (BAGE) expects the biggest wheat harvest ever for the South American country. Higher than anticipated yields have traders estimating a 22.1 MMT wheat crop, higher than USDA’s estimate of 20 MMT. Even so, the government has taken steps to discourage the pace of export license registrations.

United States

U.S. wheat production is forecast down 5 MMT this year after dry weather in the Pacific Northwest (PNW), Montana, and North and South Dakota withered average yields for soft white hard red spring and Northern durum. In its latest WASDE report, USDA said, “U.S. export prices are expected to remain elevated the rest of 2021/22, further diminishing U.S. competitiveness.” The December WASDE forecasts U.S. wheat exports to total 22.8 MMT, the smallest total in 7 years if realized.

Imports Up, Too

As wheat prices continue to rise, major wheat importers are outpacing their purchases compared to 2020/21 (see chart below). For example, Egypt made its largest single purchase of wheat ever this year, buying 600,000 MT and paid $90/MT more than the average price paid a year ago. Iran’s wheat imports are up 218% compared to last year, while Turkey’s import demand is up 36%.

Graph of wheat import volume for 10 countries at the same date the past two years.

Wheat import volumes are up in several countries even as global wheat prices continued rising. Source: USDA

Looking ahead to the second half of 2021/22, many analysts see little change in ending stocks but continued market volatility given the many unknown factors in the global economy including logistical challenges and pandemic uncertainty.  Producers and buyers now look to the potential for increased wheat acres (USDA forecasts a 5% increase in 2021/22) and better growing conditions to help add stability to the global wheat market in 2022/23.

By Michael Anderson, USW Market Analyst

thumbnail

By Michael Anderson, USW Market Analyst

The Food and Agriculture Organization (FAO), a branch of the United Nations (UN), in a biannual report published this month, said “the ratio of major wheat exporters’ closing stocks to their total disappearance is expected to fall to 12.5 percent.” The report also noted that, if realized, this will be the lowest level in more than two decades. From January to October 2021, wheat prices have been 29.1 percent higher compared to the same period in 2020 FAO reported.

An abstract by the Agricultural Market Information System (AMIS) confirmed that when global wheat inventories fall and the stocks-to-disappearance ratio dips below 18 percent, higher volatility will follow. All the major factors that affect volatility AMIS noted have made recent headlines and been exacerbated by higher oil prices, stock market volatility, foreign exchange rates and weather variability, the last being especially relevant to the 2021/22 wheat crop in the exporting countries Canada, Russia and the United States.

Ratio Defined

The stocks-to-disappearance ratio defined by the Organization for Economic Cooperation and Development (OECD) is the ratio of stocks held by exporters to their disappearance (domestic utilization + exports). Among major wheat exporting countries, domestic use strongly influences the export policies of Russia, Ukraine and Kazakhstan. Russia for example uses an export tax to keep domestic prices lower. The Russian government also uses export quotas to tame domestic wheat prices and has already announced plans to curb exports starting in February 2022. Ukraine and Kazakhstan have routinely used export quotas in the past.

USW Vice President and West Coast Office Director Steve Wirsching recently noted that the 2021/22 stocks-to-disappearance ratio for major exporters is 13%, similar to levels last experienced in 2007/08 when wheat prices were exceptionally high. That year, Russia had a good crop, but imposed a substantial export tax. Following a poor crop in 2010, Russia banned wheat exports completely until the next harvest.

This year, world wheat production is expected to set a record high. However, worldwide use is expected to outpace production by more than 12 MMT. Among major wheat exporters, the EU, Ukraine, Argentina and Australia increased production this year while Canada has seen a 40% decline in wheat production with only a 13% drop in domestic use. Despite a 13% fall in production, Russia has seen domestic use go up 6% and export forecasts increase 42%.

Volatility is evident in the periods when stocks-to-disappearance ratios among exporting countries were low in this chart showing wheat futures prices over time

Volatility is evident in the periods when stocks-to-disappearance ratios among exporting countries were low in this chart of wheat futures prices from U.S. exchanges. For example, hard red spring prices (MGEX in red) in 2008 reached as high as $18.30/BU. That year was characterized by limited export supplies, strong international demand and low global wheat stocks.

Southern Harvest Quality Questions

Next week, USDA will release its latest supply and demand report, offering an updated forecast for major exporting regions. While the northern hemisphere crop is mostly in the bin, the southern hemisphere is beginning harvest now, and already concern is growing for the Australian wheat crop.

The Australian Bureau of Agricultural and Resource Economics and Sciences (ABARES) recently did raise its forecast for Australian wheat production by 1.4 MMT, up 4% compared to last year. However, a rainy harvest there is generating speculation about the volume of milling quality wheat. One trader noted “the mess that wet harvest weather has left us in.” In addition, the EU experienced a wet harvest this season that downgraded milling wheat to only 62% of the total harvest according to Stratègie Grains.

More Volatility Ahead

The volatility inherent in the 2021/22 marketing year has major importers going to great lengths to shore up supply as futures moved lower. This week, Egypt, the world’s largest importer of wheat, suddenly purchased 600,000 metric tons (MT) of the grain at nearly $90 per MT more than the average price paid for wheat tenders last year. The purchase is thought to be Egypt’s largest single wheat purchase ever and surpasses a previous record of a 540,000 MT Egyptian purchase in 2008.

Wheat markets have moved lower recently, but with the exporter stocks-to-disappearance ratio remaining low until at least closer to the 2022 Northern Hemisphere harvest, volatility is likely to continue.

thumbnail

The recent run-up in ocean market freight rates is causing heartburn for the world’s grain importers. Vessel rates bounced up on Nov. 22, but a shipbroker quoted in a Reuters report expects dry bulk spot rates to stabilize in November and December “before a seasonally soft first quarter of 2022.”

That would be some good news for wheat importers, but rates remain very high. That is one reason why U.S. Wheat Associates (USW) asked Jay O’Neil, HJ O’Neil Commodity Consulting, to record an in-depth analysis of the ocean freight market as part of its 2021 Crop Quality Report. His presentation is posted online at https://cropquality.uswheat.org with all by-class written and video reports and other special topic presentations translated into several languages.

Demand and Inefficiency

In his report, recorded in mid-October, O’Neil discussed the physical make-up of the global ocean freight fleet. He noted that grain carrying vessels make up about 13% of global seaborne cargo, so its rates “follow the lead” of larger coal and iron ore vessel rates in the Capesize category. Those rates have spiked in recent months due to higher demand, primarily from China, pulling grain rates up with then. O’Neil also described how China’s high demand for grain and oilseed imports has lifted freight rates.

The pandemic is adding cost because it is taking longer to load and unload vessels.

“We have about 16% of the world global dry bulk fleet tied up waiting to unload at various ports,” O’Neil said in October. “That creates inefficiency that requires more ships to carry the same amount of cargo.”

Freight Markets Image

The 13-year high in dry bulk freight rates is partially tied to vessel turn-around slowed by the COVID-19 pandemic, said ocean freight consultant Jay O’Neil.

Vessel Capacity Lagging

For many years following a much more significant price spike around 2008, rates remained somewhat stable at relatively low levels. As a result, “we have not been building many vessels for the last 13 years,” O’Neil said. “Now we don’t have enough ships to carry all the new cargo demand, so we have this spike.” The ship-building process takes years, he noted.

Yet there is what O’Neil described as a “huge inverse between the nearby market and the forward market. Those who need to purchase vessels are paying whatever they have to pay in the nearby market but are not much interested in paying those high rates for freight several months in the future.”

O’Neil sees bulk ocean freight demand growing faster than fleet growth into at least 2023. He noted a two-year backlog in container and tanker vessel production that limits capacity to build bulk vessels. Risk management through a hedge on rates in the Freight Forward Agreement markets is an opportunity for buyers, he said.

Volatility Ahead

There are other unseen factors affecting future bulk ocean rates, O’Neil noted, including global economic conditions and management of vessel emission standards. He also offered a look at container market factors.

“One constant is volatility in the freight markets will continue to plague us,” he said. “If you are a cargo buyer, timing (of purchases and risk management) is going to be very important.”

USW reports ocean freight market rates and weekly changes in the Baltic Index each Friday in its Price Report.

thumbnail

By Michael Anderson, USW Market Analyst

As the U.S. wheat 2021/22 marketing year reaches its halfway point, U.S. Wheat Associates (USW) summarizes market factors affecting global wheat supply and demand with its farmer board of directors. The data comes from USDA’s October reports, which will be updated on November 9. We want to share some information here, focusing on key wheat exporting countries.

USDA pegs 2021/22 world wheat production at a record 776 million metric tons (MMT), up 1.0 MMT from last year and 2% above the 5-year average of 757 MMT. Total global supplies are forecast to reach 1,064 MMT, 1% less than last year.

Significantly lower production is expected in the United States, Canada, Russia, Kazakhstan and a slight drop in Australian production, all exporting countries.

Change in world Wheat Production 2021

Among wheat exporting countries, the United States, Canada, Russia, Australia, Kazakhstan and Australia saw wheat production decline for 2021. All wheat exporting countries now hold 18% of world wheat stocks.

USDA estimates 2021/22 world wheat ending stocks will reach 277 MMT, down 4% from last year and 2% less than the 5-year average. A closer look at stocks held by exporting countries reveals that USDA now expects exporters to control just 18% of world wheat stocks, including Black Sea exporters. When exporters hold so few stocks, a bullish market and volatility result.

Following are USDA estimates for selected exporting countries, except where noted.

United States

  • U. S. wheat production will total 44.8 MMT, down 10% from last year and 15% below the 5-year average;
  • Persistent, severe dryness significantly cut hard red spring (HRS), soft white (SW) and Northern durum production;
  • Total U.S. wheat exports will reach 23.8 MMT in 2021/22, 12% less than last year and 10% less than the 5-year average.

Canada

  • Canadian 2021/22 wheat production will reach 21.0 MMT, 40% lower than last year and 35% less than the 5-year average of 35.4 MMT;
  • Spring wheat production is projected to decrease 40% on the year to 15.3 MMT due to extended dry weather Agriculture and Agri-Food Canada (AAFC) reported;
  • According to Statistics Canada, Canadian durum production is forecast to be 3.5 MMT in 2021/22, 46% less than last year on significantly drier growing conditions;
  • Total Canadian wheat exports will decrease 43% from last year to 15.0 MMT, 36% less than the 5-year average.

Russia

  • Total 2021/22 Russian wheat production decreased 15% on the year to 72.5 MMT;
  • According to SG, Russian planted area was down 1%, and average Russian wheat yield decreased 10% from last year to 39.55 bu/acre;
  • The imposition of a government export tax has slowed international demand for Russian wheat;
  • Total Russian wheat exports will fall 9% from last year to 35.0 MMT, 2% less than the 5-year average of 35.6 MMT.

Ukraine

  • USDA estimates total Ukrainian wheat production rose 30% from 2020/21 to 33.0 MMT;
  • SG predicts the total Ukrainian average wheat yield was up 18% from last year to 66.7 bu/acre;
  • Total Ukrainian wheat exports will rise 39% from last year’s record to 23.5 MMT in 2021/22.

Australia

  • Australian wheat production will fall 5% on the year to 31.5 MMT, although this is still a large crop with significant exportable supplies;
  • Increased average yield was lower despite a 7% increase in harvested area of 34.1 million acres;
  • Total Australian exports will be 23.5 MMT, 0.5 MMT down from 2020/21.

European Union

  • Total European Union (EU) wheat production is up 11% on the year to 139.4 MMT;
  • SG estimates that total EU non-durum wheat will be 129.5 MMT, up 9% from last year;
  • Heavy rain during harvest in both France and Germany challenged milling wheat quality and, as a result, 65% of EU non-durum wheat, or 80.8 MMT, meets millable grade;
  • Total EU wheat exports will increase 20% on the year to 35.5 MMT, 20% above the 5-year average.

Argentina

  • Total Argentinian wheat production will rise 14% from last year to 20.0 MMT following good growing conditions this season;
  • Total Argentinian wheat exports are expected to increase to 13.5 MMT in 2021/22, 23% more than last year and 8% greater than the 5-year average.

Exports by Major Wheat Exporting Countries

USDA expects 2021/22 world wheat trade to fall slightly from last year’s record to 200 MMT. If realized, that would be 6% greater than the 5-year average of 189 MMT. Total global wheat use is forecast at 787 MMT in 2021/22.

According to USDA’s trade forecast, the United States will have a 12% market share in the world wheat trade at 23.8 MMT, in line with last year’s market share.

thumbnail

Look at a line graph that tracks freight markets over the last two years and you may mistake it for the very waves the vessels traverse on the open ocean. Up and down the vessel goes, and so have the rates.

The Baltic Dry Index (BDI), an assessment of the average cost to ship raw materials such as grains, coal and iron ore, hit a 13-year high on October 7 at 5,650, yet three weeks later, it climbed down 28% to 4,056 on October 27.

Disruptions and More

The effects of COVID-19 have turned the traditional flow of sea commerce upside down. And as economies reemerge from the pandemic-induced lull, logistic obstacles have abounded. “Global Supply-Chain Problems Escalate” and “Cargo Piles Up at Ports” are just two of the headlines outlining the shipping industry’s challenges. Disruptions to the supply chain, port congestion, and logistical challenges all add to the run-up in freight markets.

Grains, including wheat, are traditionally shipped using bulk carriers like Panamax, Handymax and Capesize vessels that contain large cargo holds to segregate grains. Cargo ships, the more familiar vessel for the trans-ocean shipping of retail items, only carry small volumes of grain. However, as extraordinary times created the need for more extraordinary efforts, the massive U.S. retailer Walmart recently chartered a dry bulk cargo ship to carry merchandise to circumvent global supply chain disruptions. Other retailers may do the same as the holiday season approaches.

Idled Vessels

That would not be a bargain because 16% of the world’s dry bulk fleet is waiting to unload at various ports around the world, with 6% of those vessels waiting at Chinese ports. The inefficiencies caused by loaded vessels idling outside ports translate directly to tighter supply despite higher demand and, thus, higher prices. Dry bulk shipping rates were below $20,000 per day last January but rates, led by Capesize vessels, hit $85,000 per day in September. Grain buyers still must ship wheat and pay the higher prices, pushing up all rates across dry bulk carriers.

Global import for grain has also increased year-over-year. For example, China’s demand for grains has equated to around 25% of worldwide demand. Looking back, in the mid-2000s, the number of dry bulk carriers outweighed the demand for such vessels. However, an economic boom in China starting around 2006 saturated the dry bulk market leading to greater demand and a soaring BDI. Eventually, shipping companies added to their fleets, and the added capacity helped freight markets to stabilize. Then the global financial crisis reduced the demand for such vessels and slowed shipbuilding. Now a new spike, starting in 2020, has driven demand up again and daily rates for dry bulk shipping. The nearby market remains high while the forward market is much lower, creating a significant inverse. Exporters who need to ship now must pay the higher prices.

Freight Markets Export Elevator

Doubled

Importers in South Korea, the fifth-largest U.S. wheat customer, based on a 5-year average, has seen freight rates double from US$40 per metric ton (MT) in 2020 to around US$80 per MT dollars today, said C.Y. Kang, Country Director for U.S. Wheat Associates (USW) based in Seoul. Kang also noted that the BDI Index in 2020 averaged 1,064 while this year it has averaged 2,941, a 176% increase. Egypt, the world’s largest wheat importer, has suspended the 15% price advantage it offered the state shipping line as GASC, the Egyptian state commodities buyer, tries to find ways to lower the overall cost of wheat imports.

High oil prices are also keeping freight rates elevated. On Tuesday, oil futures hit their highest levels since 2014 but started to slump Thursday, hitting their lowest level in two weeks at $80.58 as U.S. crude inventories rose more than expected. One market analyst said that energy prices are unlikely to weaken for the remainder of the year as supply remains restrained, but demand returns to the 5-year average. Oil sold for around $15 per barrel in April 2020 versus today, a 431% increase.

Seeing the Top?

Jay O’Neil, a commodities consultant, has outlined all today’s obstacles in the export freight supply chain in a video presentation that will be available to U.S. wheat customers in early November. On top of long lines at ports, there is a shortage of vessels, containers, skilled labor at ports, warehouse workers, a 30% shortage of truck drivers, railroad cars and even chassis to attach containers to train cars. In his presentation, O’Neil says that despite the logistical mess, which could extend into mid-2022, the dry bulk market is likely to have hit its top.

As these circumstances change globally, logistical headaches may ease as more workers return and more consistent patterns resume. For now, though, the tight supply of vessels and the consistent appetite for grains is helping keep the global dry bulk business at historic levels.

Stay up to date on U.S. wheat market information at https://www.uswheat.org/market-information/.

By Michael Anderson, USW Market Analyst

thumbnail

A surprising drop in USDA’s estimate of U.S. wheat production in the September 30 Small Grains Summary Report helped support the trend of higher U.S. and world wheat prices. The recent sustained run-up in prices calls to mind another (and even more challenging) bull wheat market beginning in marketing year 2006/07 and continuing through 2007/08.

In March 2008, then U.S. Wheat Associates (USW) Senior Market Analyst Joe Sowers wrote in Wheat Letter that 2007/08 had been a remarkable year. He noted that “unforeseen weather calamities around the globe and major wheat exporters protecting supplies for domestic use” helped push stocks to their lowest level in 60 years and drove prices to record highs at the time. That supply shock followed a period in which wheat use outpaced production in 7 of the prior 10 years. Read Sowers’ article here.

Lower world wheat supplies and some key exporters still trying to hold down domestic food prices are also fueling the current market rally.

Today’s Supply Issues

The challenges reducing worldwide wheat production and global stocks are well known at this point. The most recent Small Grains Report listed all wheat total production 10% below 2020 at 44.9 MMT (1.65 billion bushels). The report also fell short of average industry estimates and the NASS August projections. Despite a 5% increase in planted area in 2021 compared to 2020 and harvested area being up 1%, dry conditions ultimately trimmed total production. Winter wheat production was up 9% compared to 2020 while spring wheat bushels were down 44% compared to 2020, their lowest level since 1988. Durum wheat was down 46%.

The latest USDA World Agricultural Supply and Demand Estimates (WASDE) report released October 12 also signaled lower production. USDA cut world wheat production by 4.4 MMT and trimmed ending stocks by 6 MMT. The report briefly sent U.S. wheat futures higher (followed on October 13 by managed money profit-taking). The report showed that for the second year in a row, ending stocks have declined following a long period of sustained annual growth. Compared to the highest ending stocks on record in 2019/20, ending stocks this year are down more than 17 MMT. USDA now projects 2021/22 world use to outpace production by 11.0 MMT — while global wheat demand continues to set new records.

Drought conditions in Canada, the United States and Russia, along with quality issues in the European Union, have cut exportable wheat supplies.

Intervention Raises Import Cost

As it did in 2007/08, government intervention continues to hurt the world’s wheat importers. Russia’s export tax, which keeps going up, has helped increase global wheat prices. Russia’s agriculture ministry also laid out plans for an export quota beginning February 15 and lasting through the remainder of the 2021/22 season ending June 30, 2022. In Ukraine, which had better-growing conditions than neighboring Russia and is on an export pace well ahead of last year, the government and grain association are still at odds over what to do with surplus wheat. Kazakhstan was the first to announce plans to limit wheat exports but in early September the Kazak president called that idea “premature.”

Wheat futures prices 2006 to 2021

The bull wheat market from 2006 to 2008, seen here in U.S. wheat futures prices, was fueled by sharp drops in global wheat supplies from bad weather and intervention by some exporting countries’ governments. Supply and intervention also helped push prices up in late 2010. That pattern emerged again in 2020 as the market reacted to shorter supply and continued, trade-distorting government policies.

Differences and New Challenges

Will the current pressure on global wheat supplies continue? That remains to be seen. Higher prices do tend to stimulate an increase in planted area. Wheat varieties around the world are much improved from 13 years ago in their ability to perform better under production stresses. Farmers in every major exporting country are managing their crops better and in more sustainable ways.

New circumstances have added concerns for wheat importers. The ongoing challenges of the COVID-19 pandemic, including its contribution to dramatically rising freight costs with record recent gains in the Baltic Index, are unprecedented.

The critical consideration for wheat buyers and flour users today, as it was in 2007/08 when Joe Sowers wrote about that remarkable year, is whether they can rely on good weather to increase supplies and reduce world wheat prices for the rest of 2021/22 and into 2022/23.

By Michael Anderson, USW Market Analyst