It is 3:00 on a brisk and overcast Tuesday afternoon, and the sun is already low in the sky. I am sitting in the galley of a tugboat — state of the art, I am told. The tugboat has all the amenities any crew would need with five staterooms, a kitchen, a washer and dryer, and even a weight room. There is some tension on board, with a hurry-up-and-wait attitude, when the phone finally rings. The deck mechanic answers and the barge we are waiting on is finally loaded with 1,500 metric tons (MT) of soft white wheat. The motor hums to life, and we start moving, slowly, toward the grain elevator. It is growing dark as two grain barges are tethered together, and we begin downriver from Lewiston, Ida., headed to Portland, Ore. It will be a two-and-a-half-day journey first down the Snake River, connecting to the Columbia River and finally to the Willamette River, to reach our Portland export elevator destinations, about 360 miles.
“This river, in general, is very handsome, except at the rapid, where it is risking both life and property to pass.” – From the Journal of Sgt. Patrick Gass, a member of the Lewis and Clark Expedition.
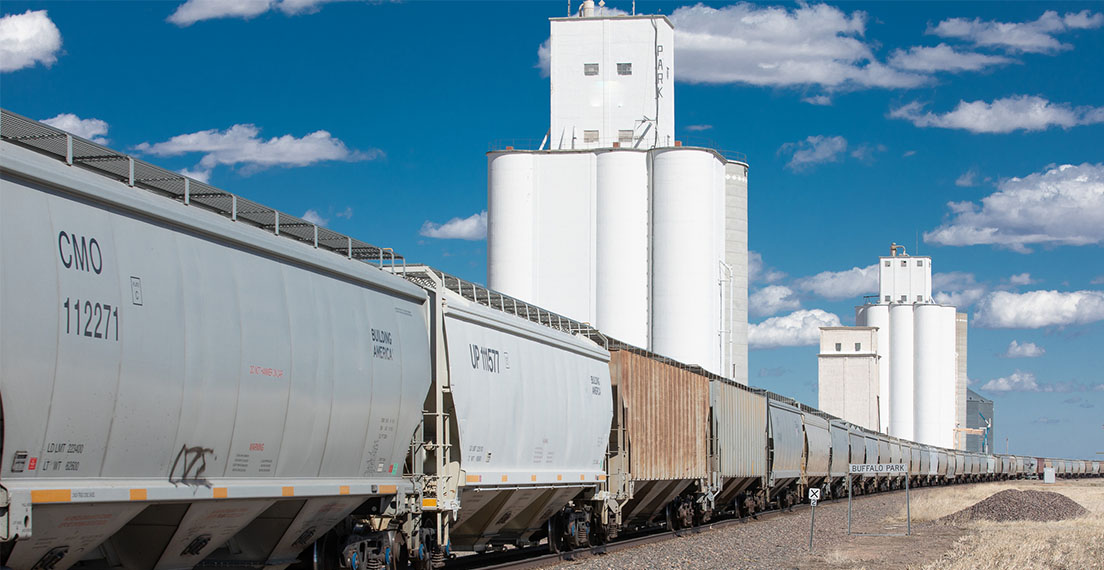
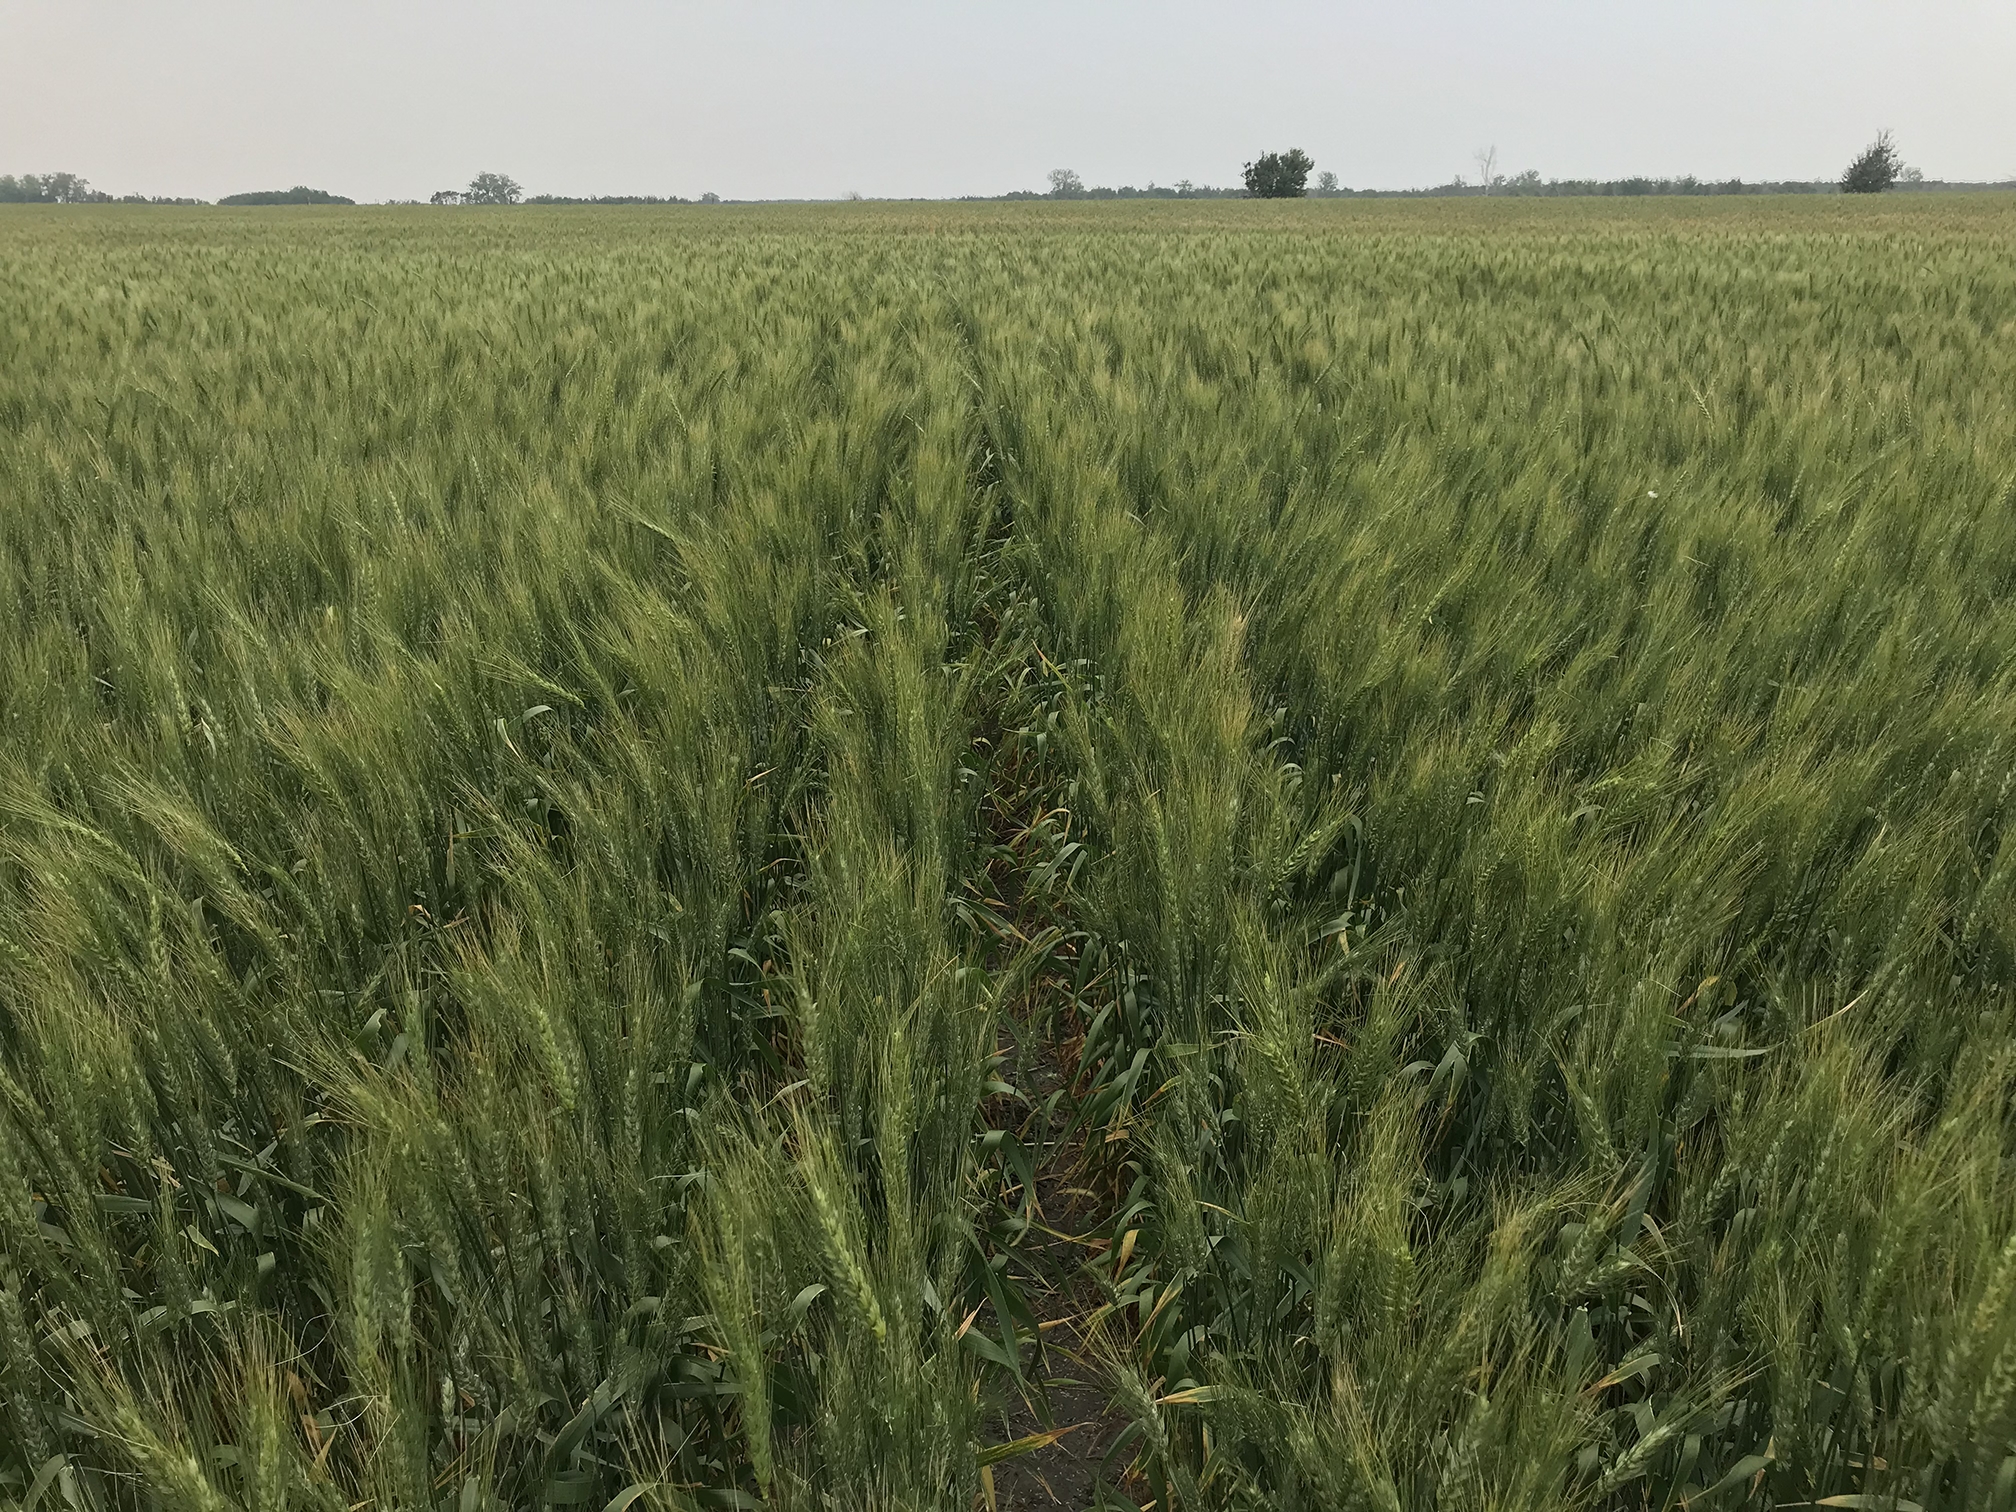
![]()
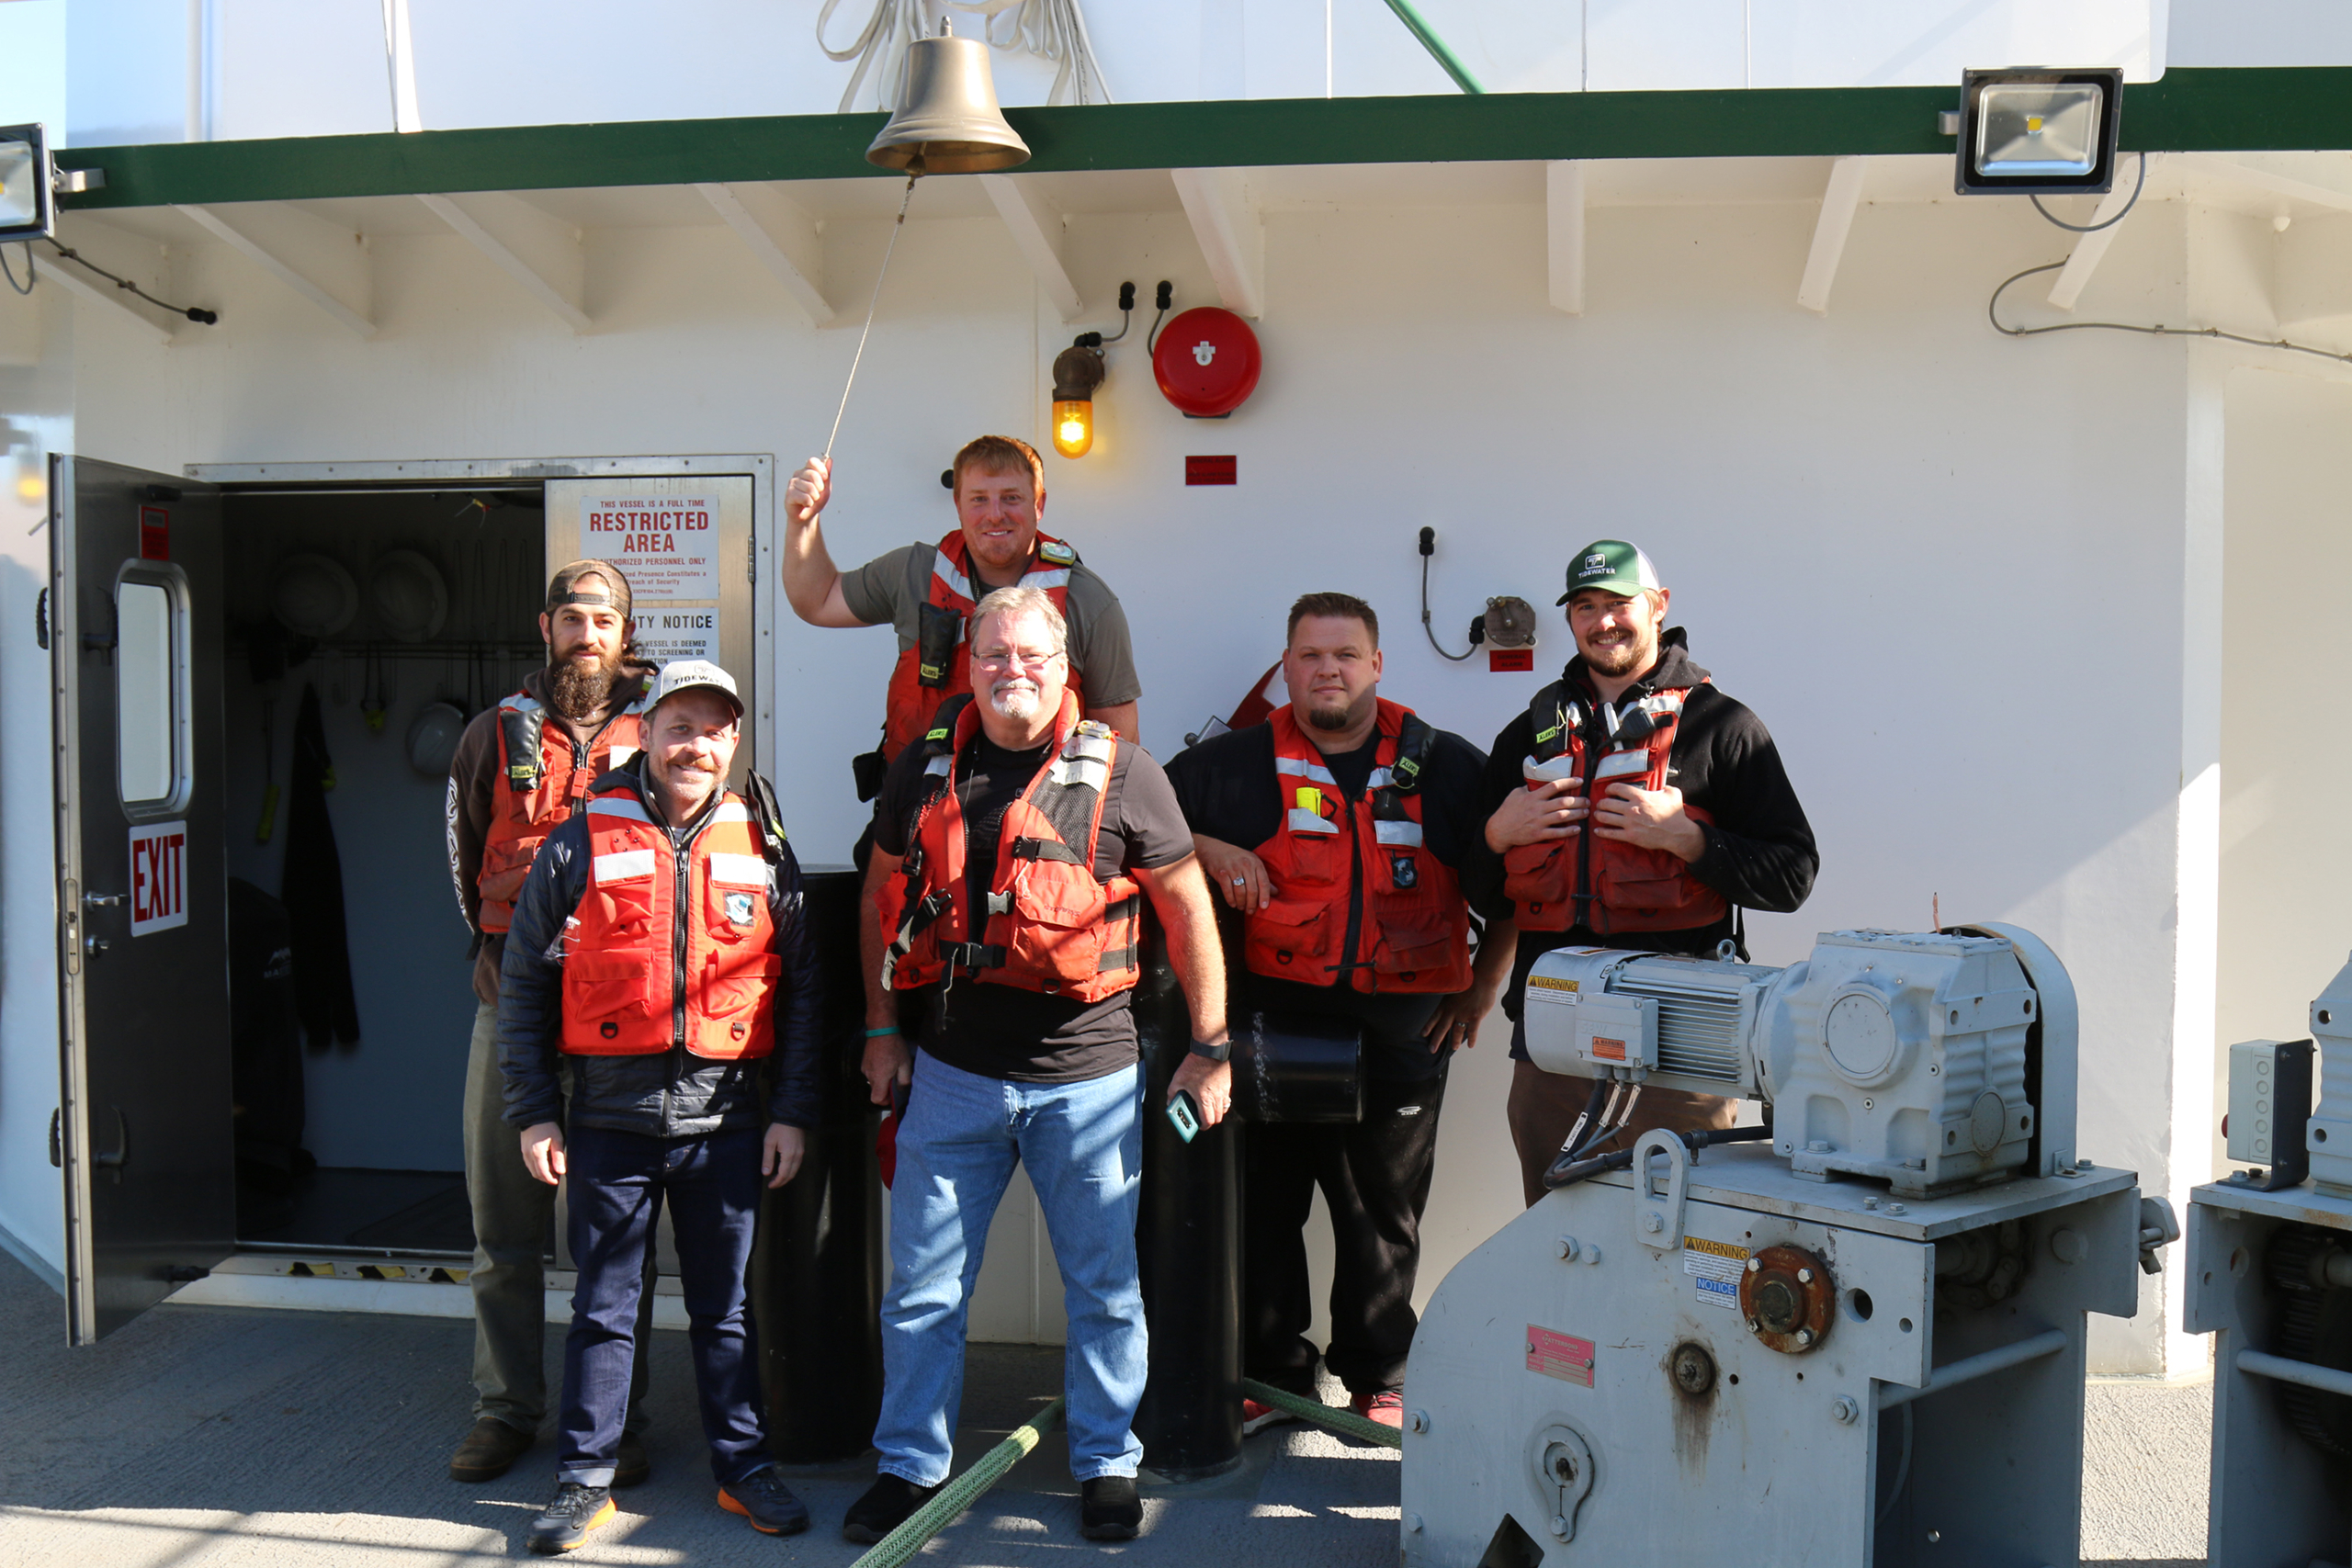
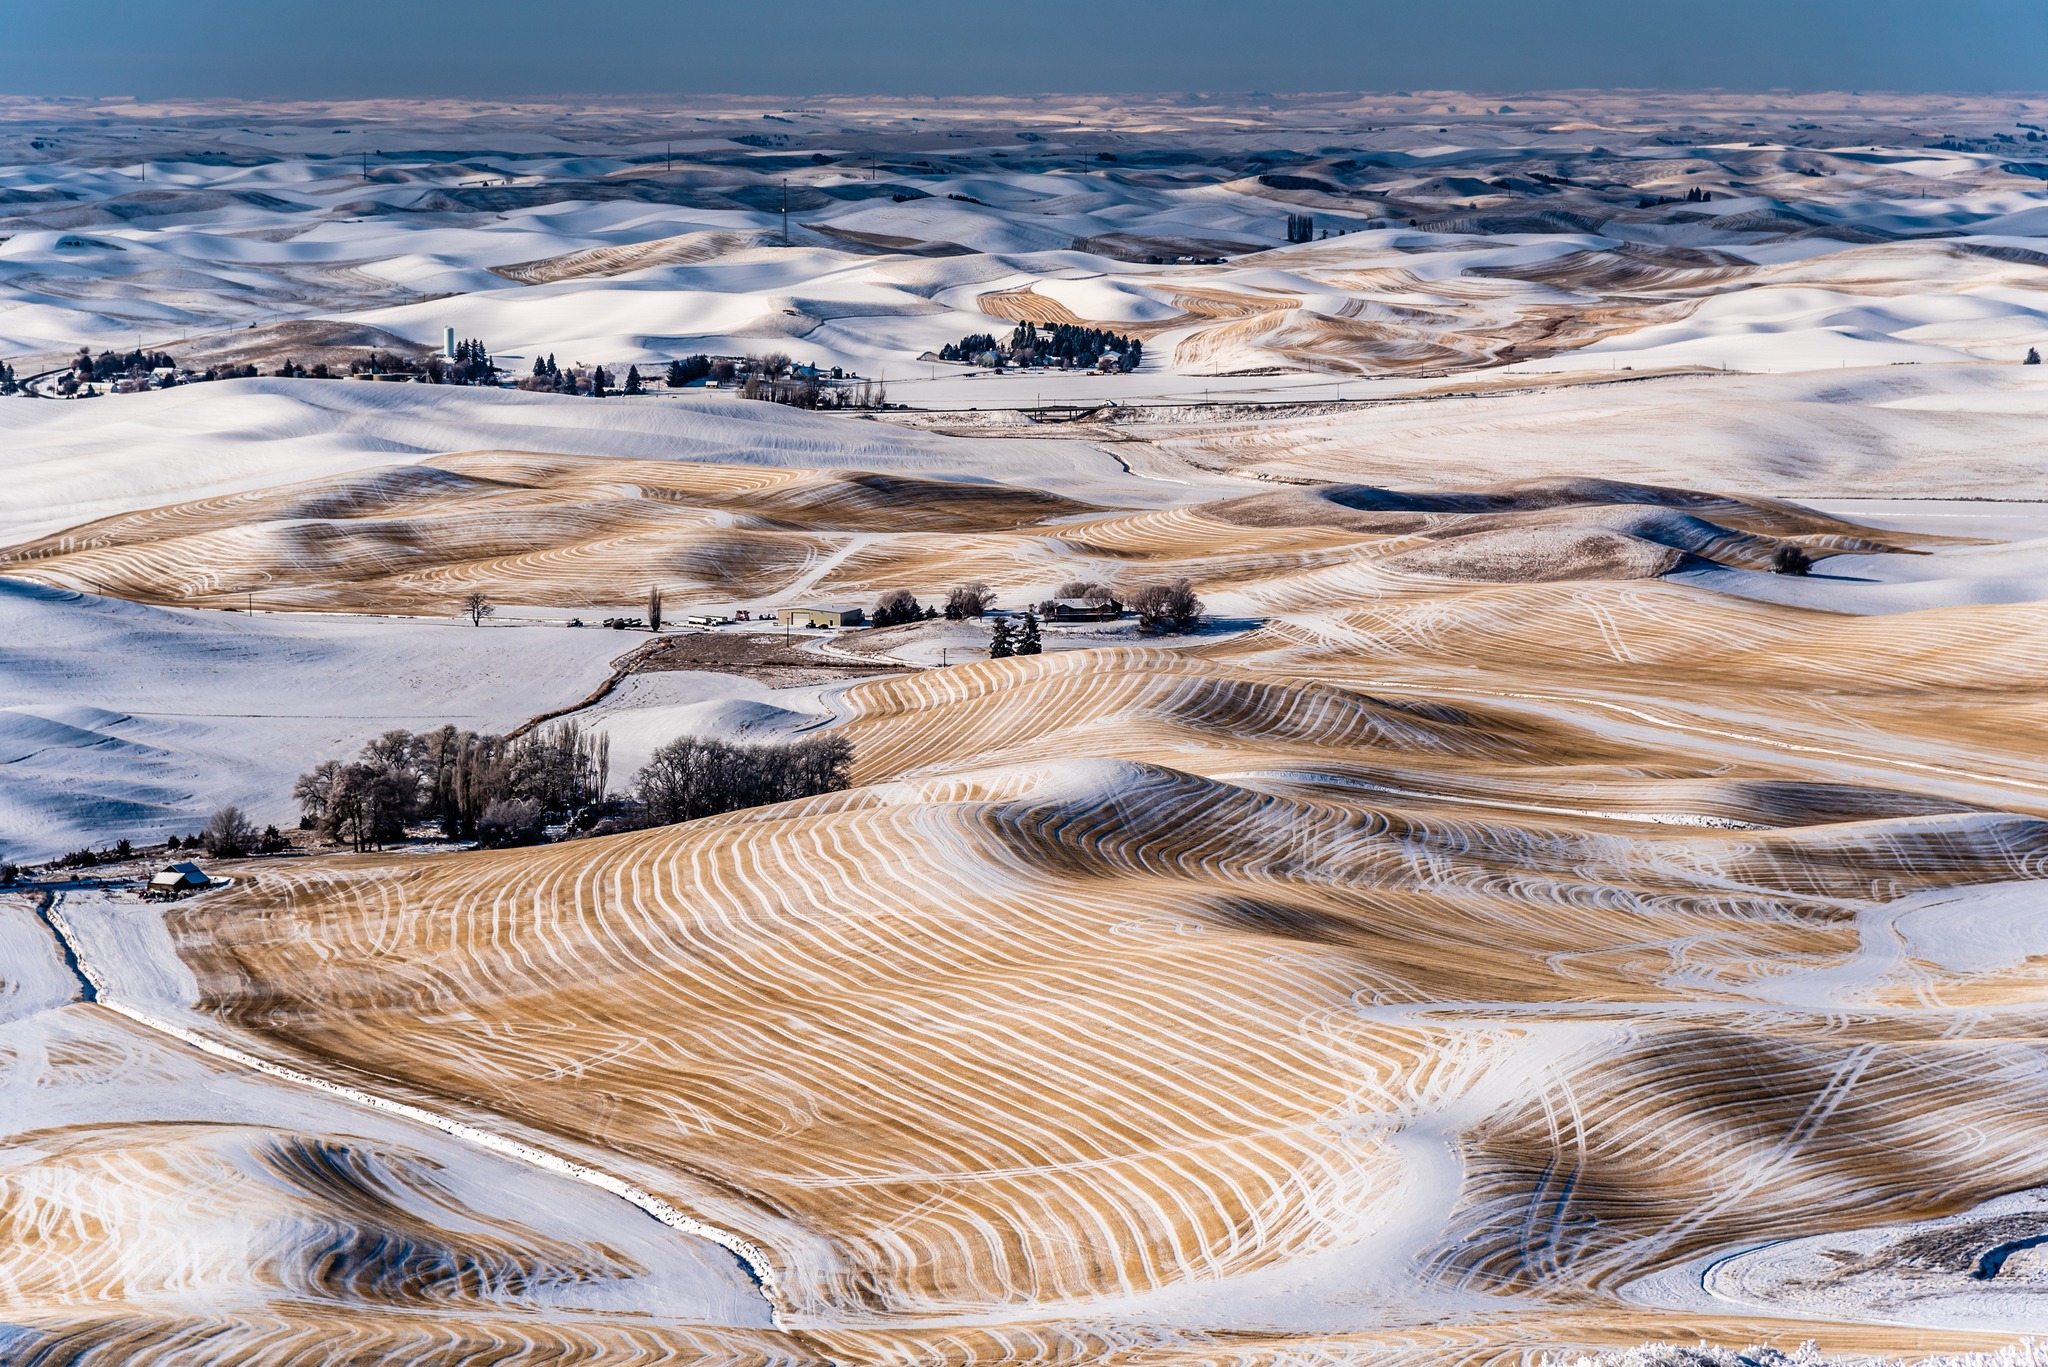
Michael Anderson is picture front, left with the crew of the tugboat crew.

We follow the same route that Lewis and Clark took as the “Corps of Discovery” traveled west. The rivers were different in 1805, untamed by today’s intricate system of dams and locks. The eight dams that we will pass through have made it possible to harness the rivers into a major artery carrying U.S. wheat bound for export from farm to port.
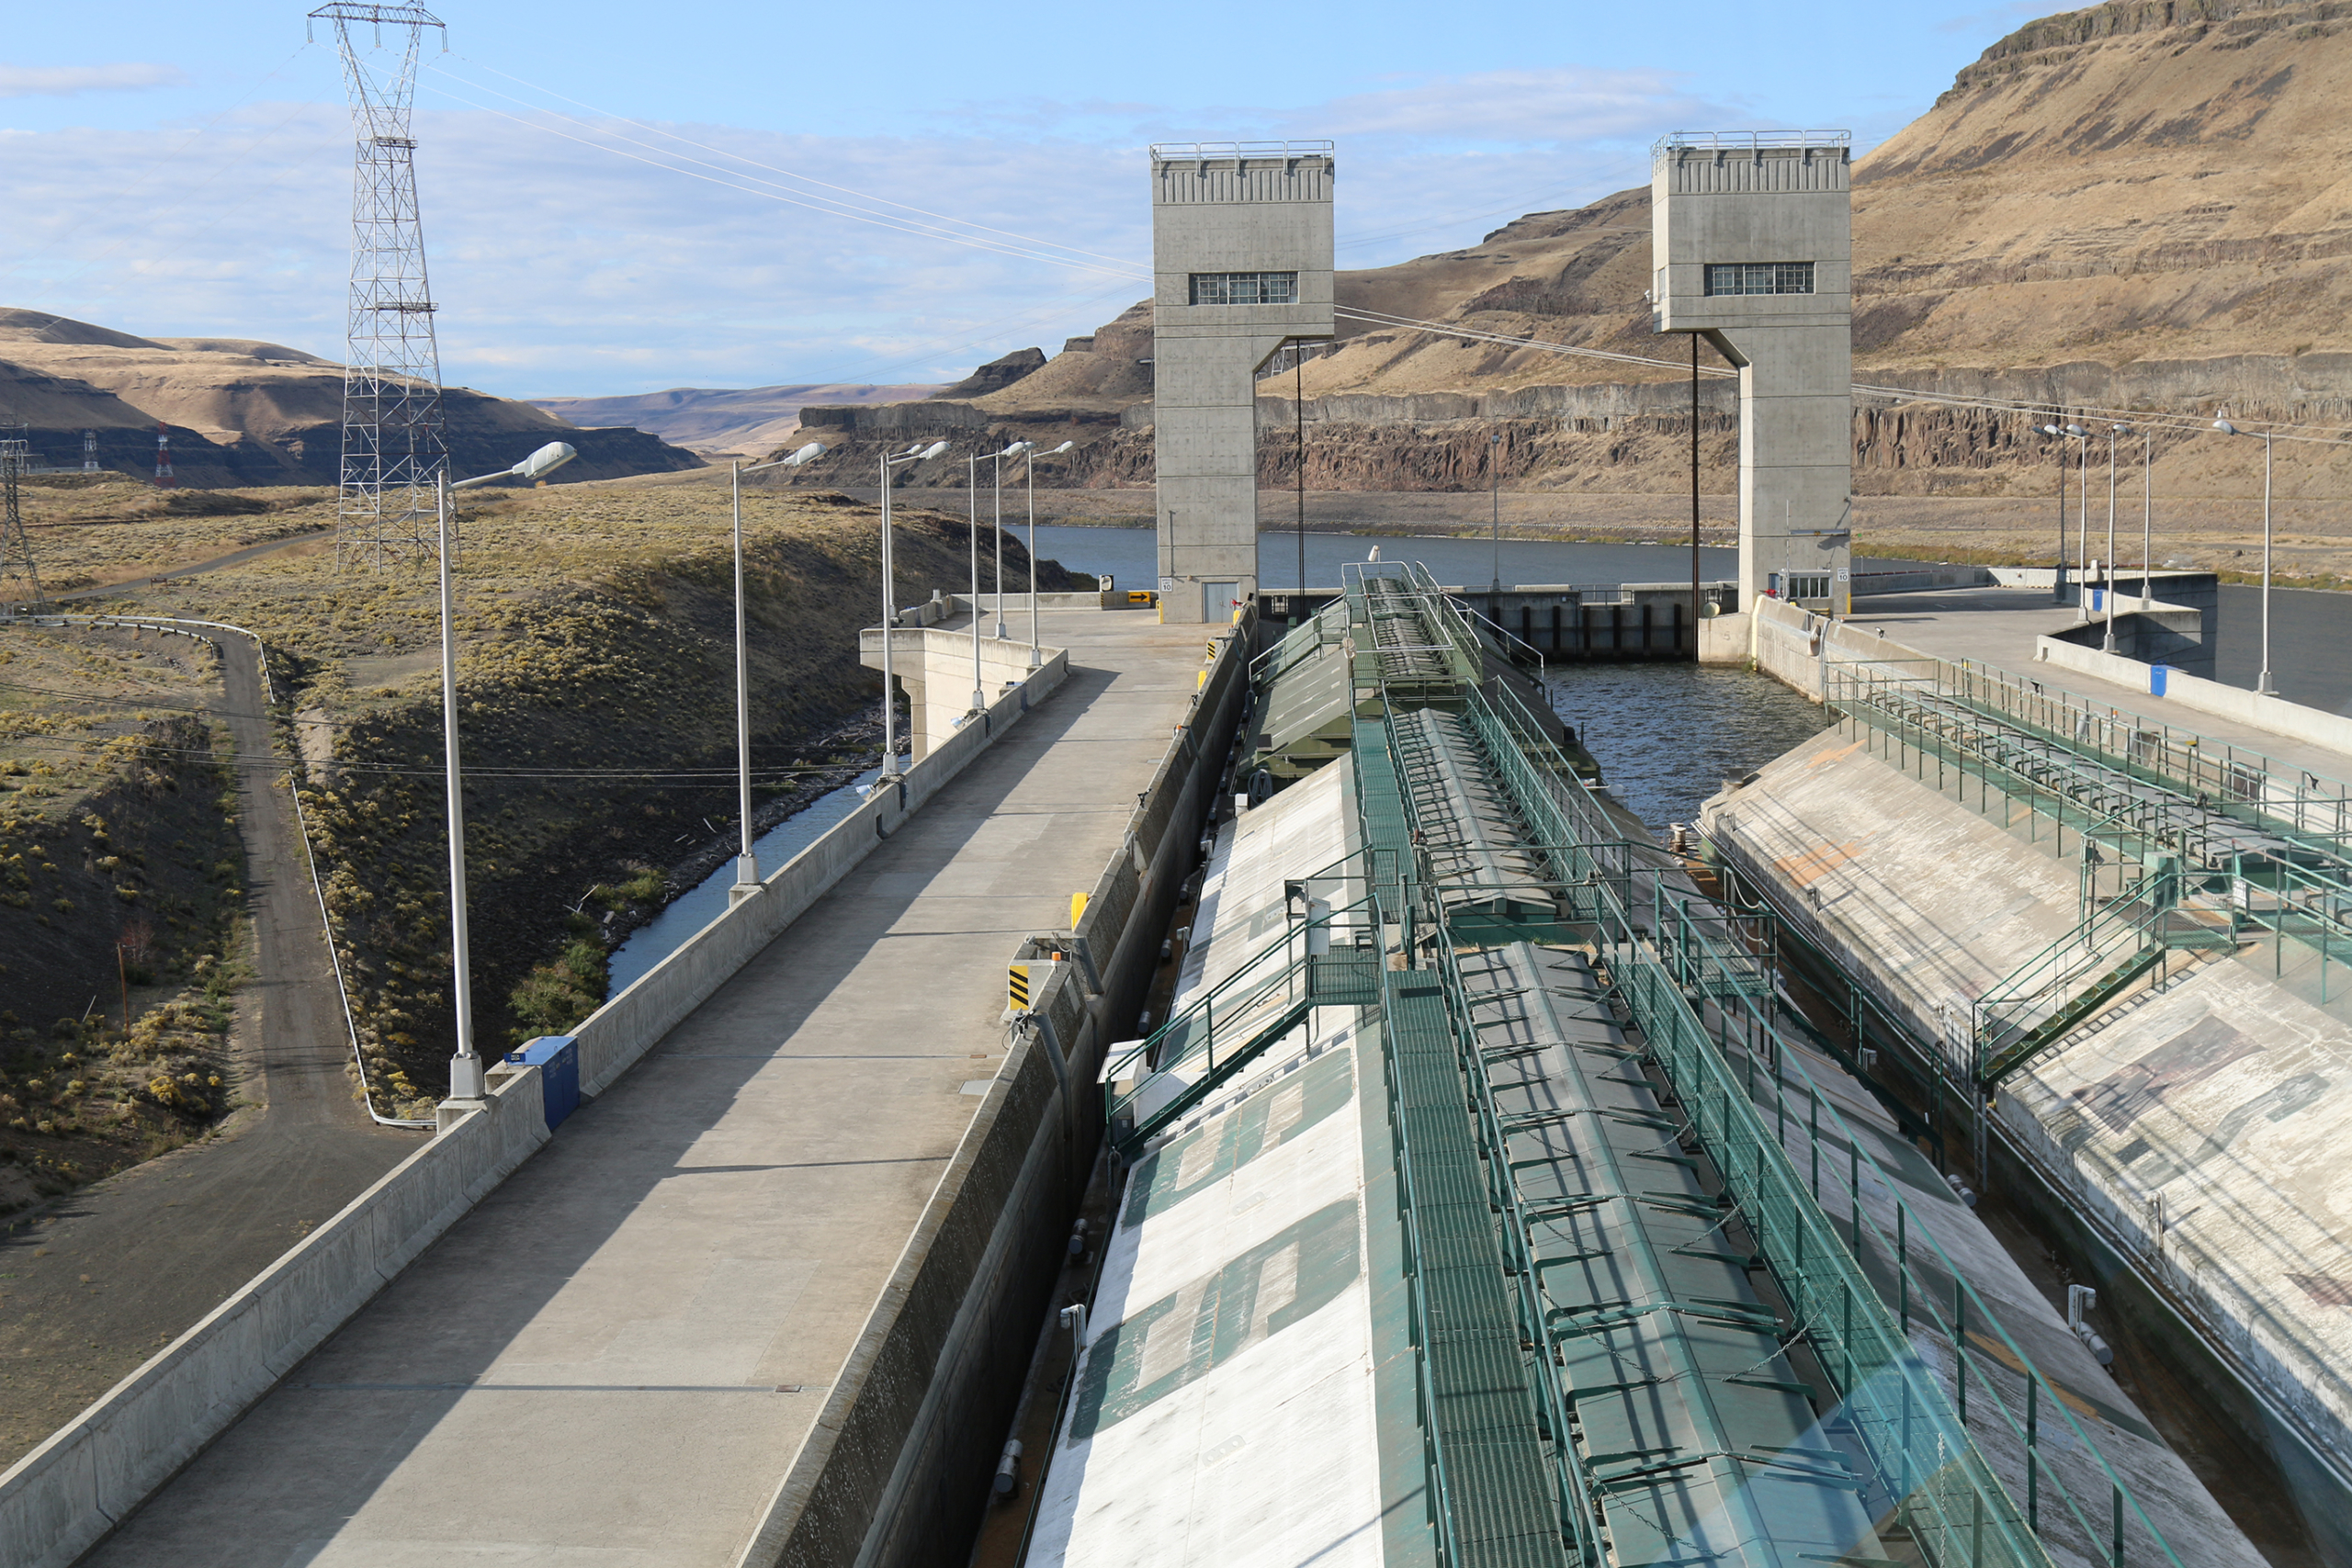
The boat rocks side to side on my first night. It is comfortable, but the unfamiliar feeling makes it hard to settle in. Suddenly the boat lurches, and the light outside gets brighter. The first lock, Lower Granite, comes into view from the deck. Two spotlights illuminate our way as we creep up to the lock. Slowly we approach the brightly lit lock and are guided in along a long concrete wall. The force of the shallow water beneath us is the only thing that keeps the tug and barges moving forward. With inches to spare on either side, we have entered the lock. Behind the boat, a gate rises from underneath the water; it is about three feet above the surface when suddenly the gate stops rising, and our boat starts sinking below the surface. It is a rapid movement, but it continues for a long time. The watermark rises above us as we descend below the surface, protected by thick concrete walls. Finally, we stop moving. We are now 100 feet below the level at which we entered the lock. I walk to the front of the boat just in time to see the gates in front, towering above us, start to open, revealing the river ahead, and slowly we make our way out of the lock and down the river.

As a crew member aboard a tug, your day is not a simple “9-to-5.” With one crew on and one off, the day is broken into shifts of six hours each, from 12 to 6 and 6 to 12. The environment shared by the crew is family-like, cooking meals together and watching TV. Only the person driving the boat, the captain or the pilot, is constantly on watch. The deck mechanics jump into action when the boat enters a lock or when we pick up another barge, and this journey is a four-barge tow, meaning four barges being pushed by one tugboat.
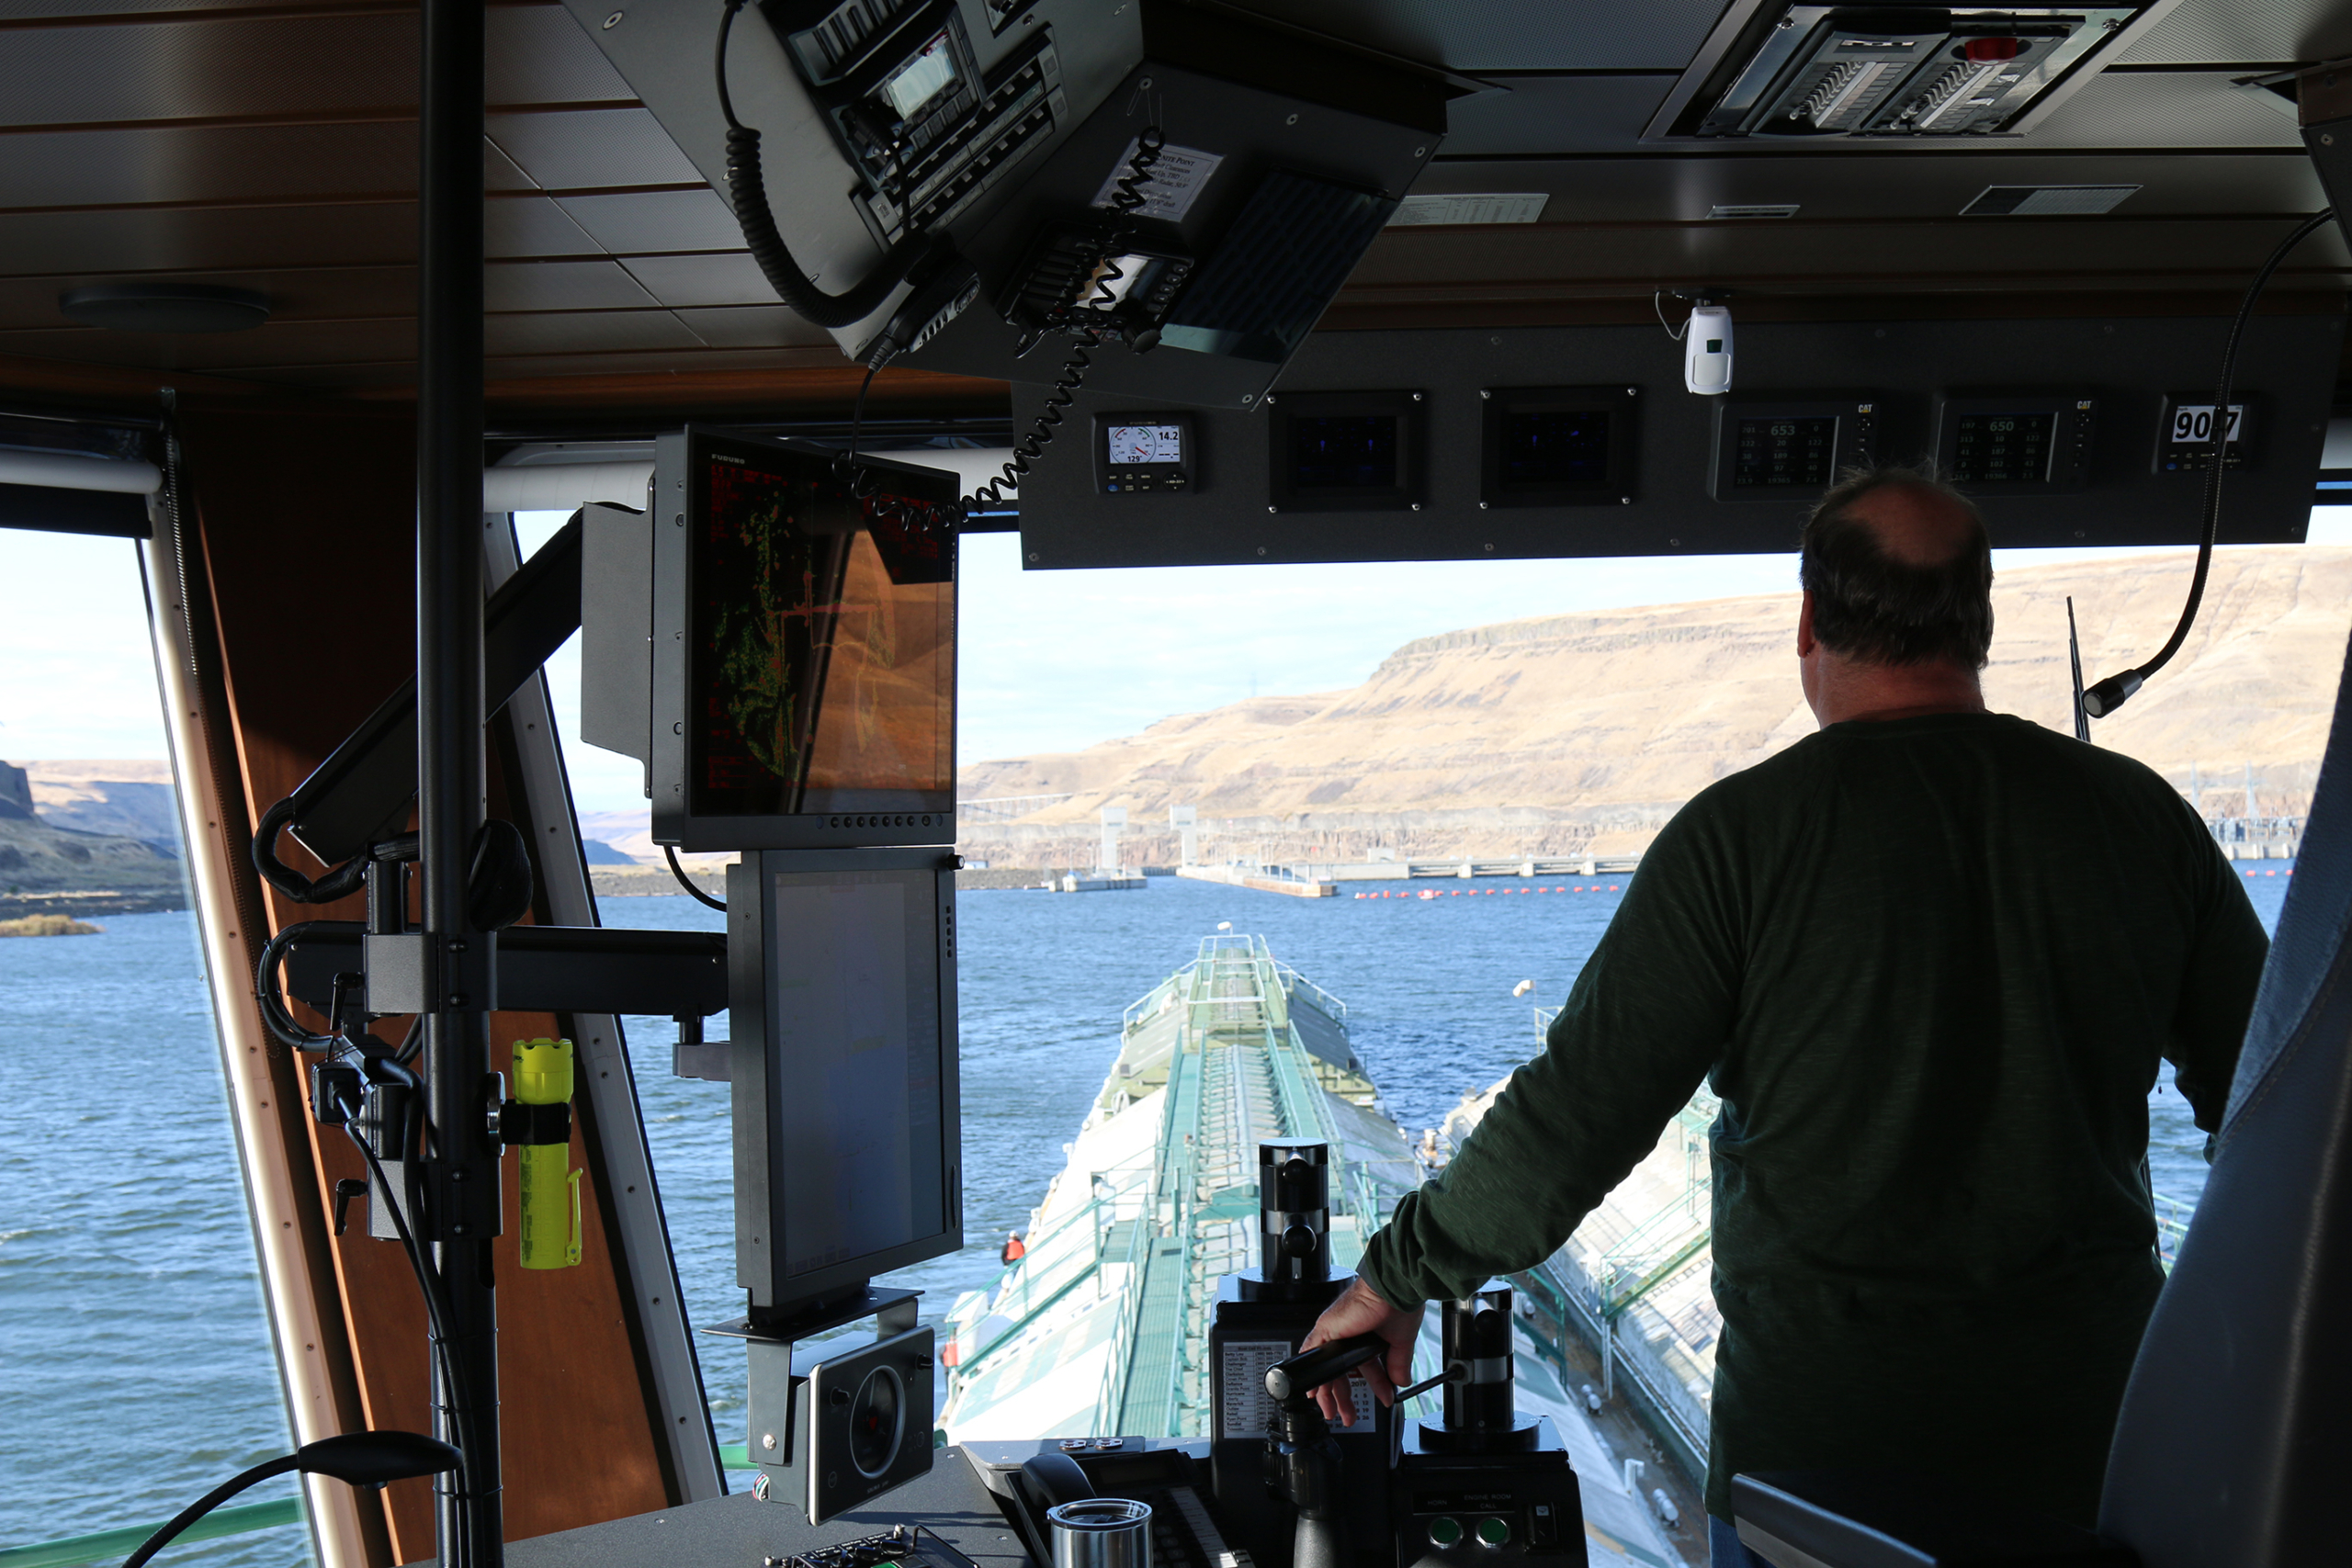
From the bridge, the captain has a sweeping view on all sides, and plenty of sophisticated equipment helps him navigate even when we are surrounded by fog, which in the Pacific Northwest is common. Another lock is just ahead. The boat only moves about nine miles per hour. We fit into the lock with precision, again with just a foot on each side to separate us from the massive concrete walls. Unlike the lock last night, this lock is too short to fit the whole tow in at once, but that is nothing out of the ordinary for this crew. Once the barges are tethered in place, the captain skillfully maneuvers the tugboat like a game of Tetris into a tiny space giving the back of the boat just enough room for the lock keeper to close us in. Again, a large iron gate rises from the water behind us, and like an elevator, we start moving down inch by inch. In front is what looks like a massive garage door. The lock opens, revealing the next stretch of the river ahead.
The mechanics of the lock are simple: we are moving down river with the flow of the water, so when we enter a lock, it is full of water. The lock seals behind us, and a valve is released to allow the water to rush out of the lock. The tow itself is being moved to the same level as the river we are moving down. Once the tow is at the same level as the water outside the lock, the valve is closed, and we wait for the massive concrete door ahead of us to open so the tow can move out. It is a similar procedure for ships going upriver against the flow, but instead of the valve releasing water, the valve fills the lock. It takes about 30 minutes to pass through each lock.
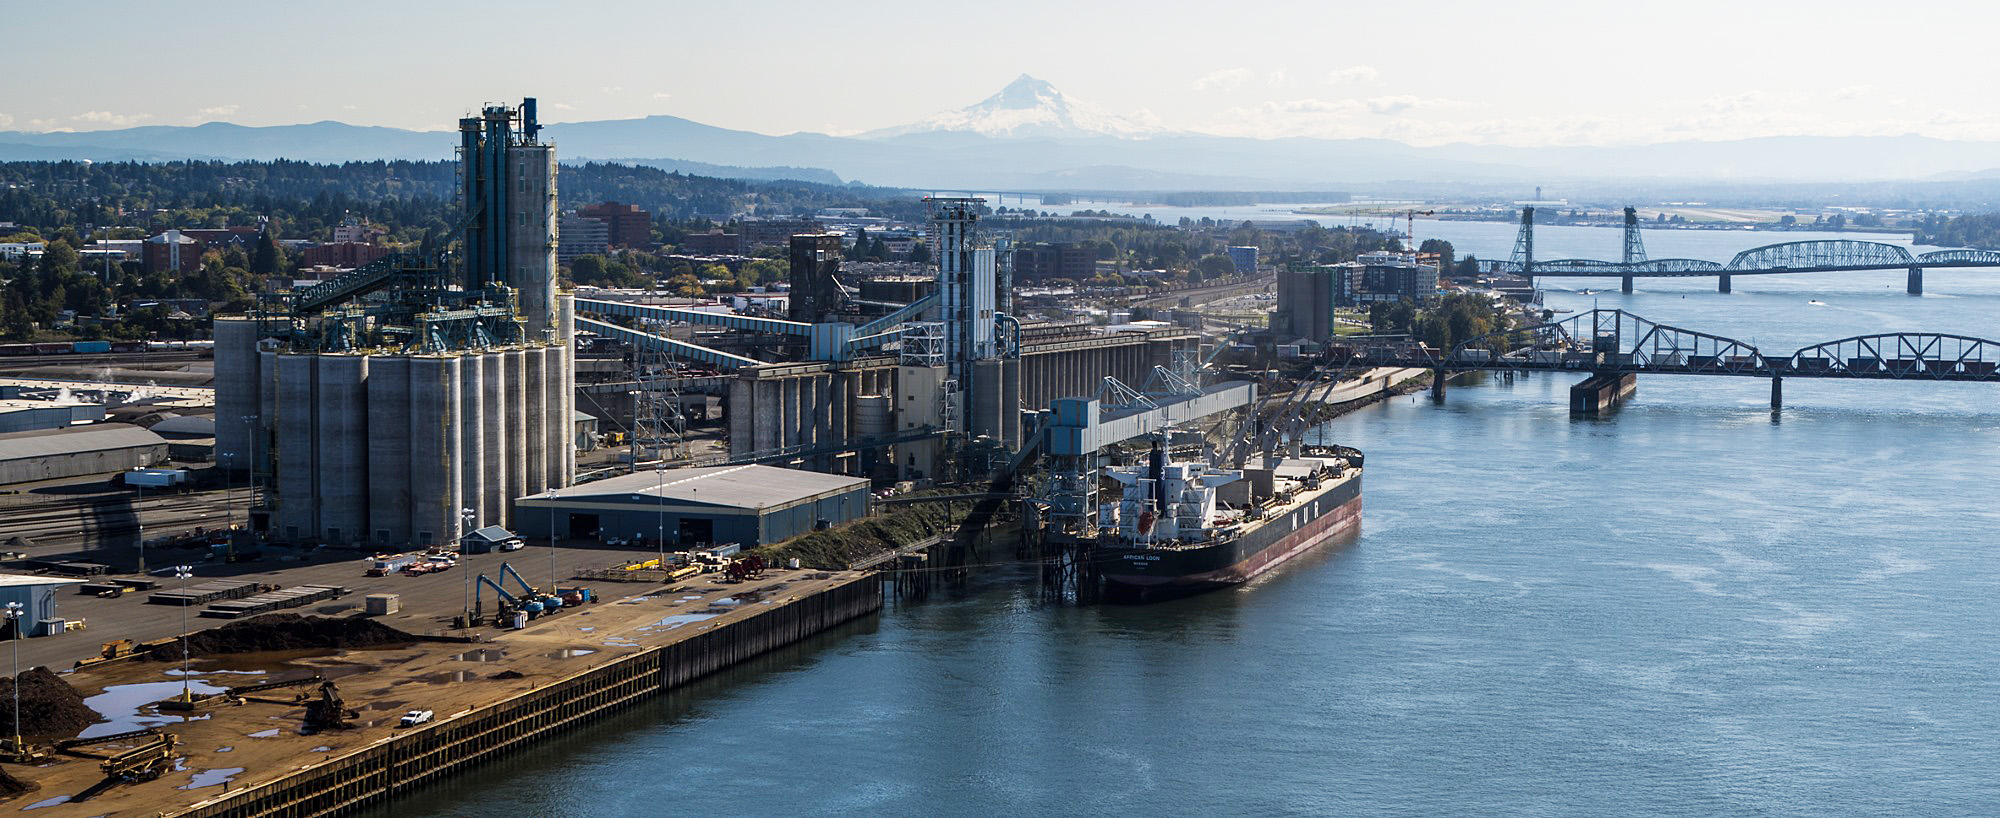
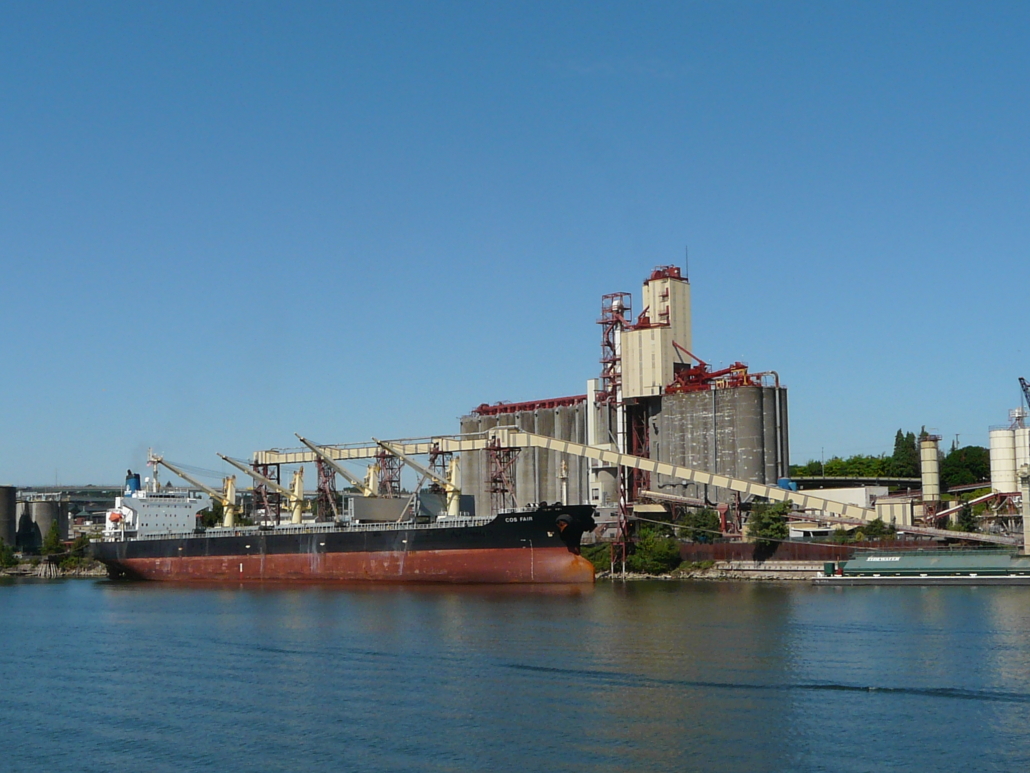
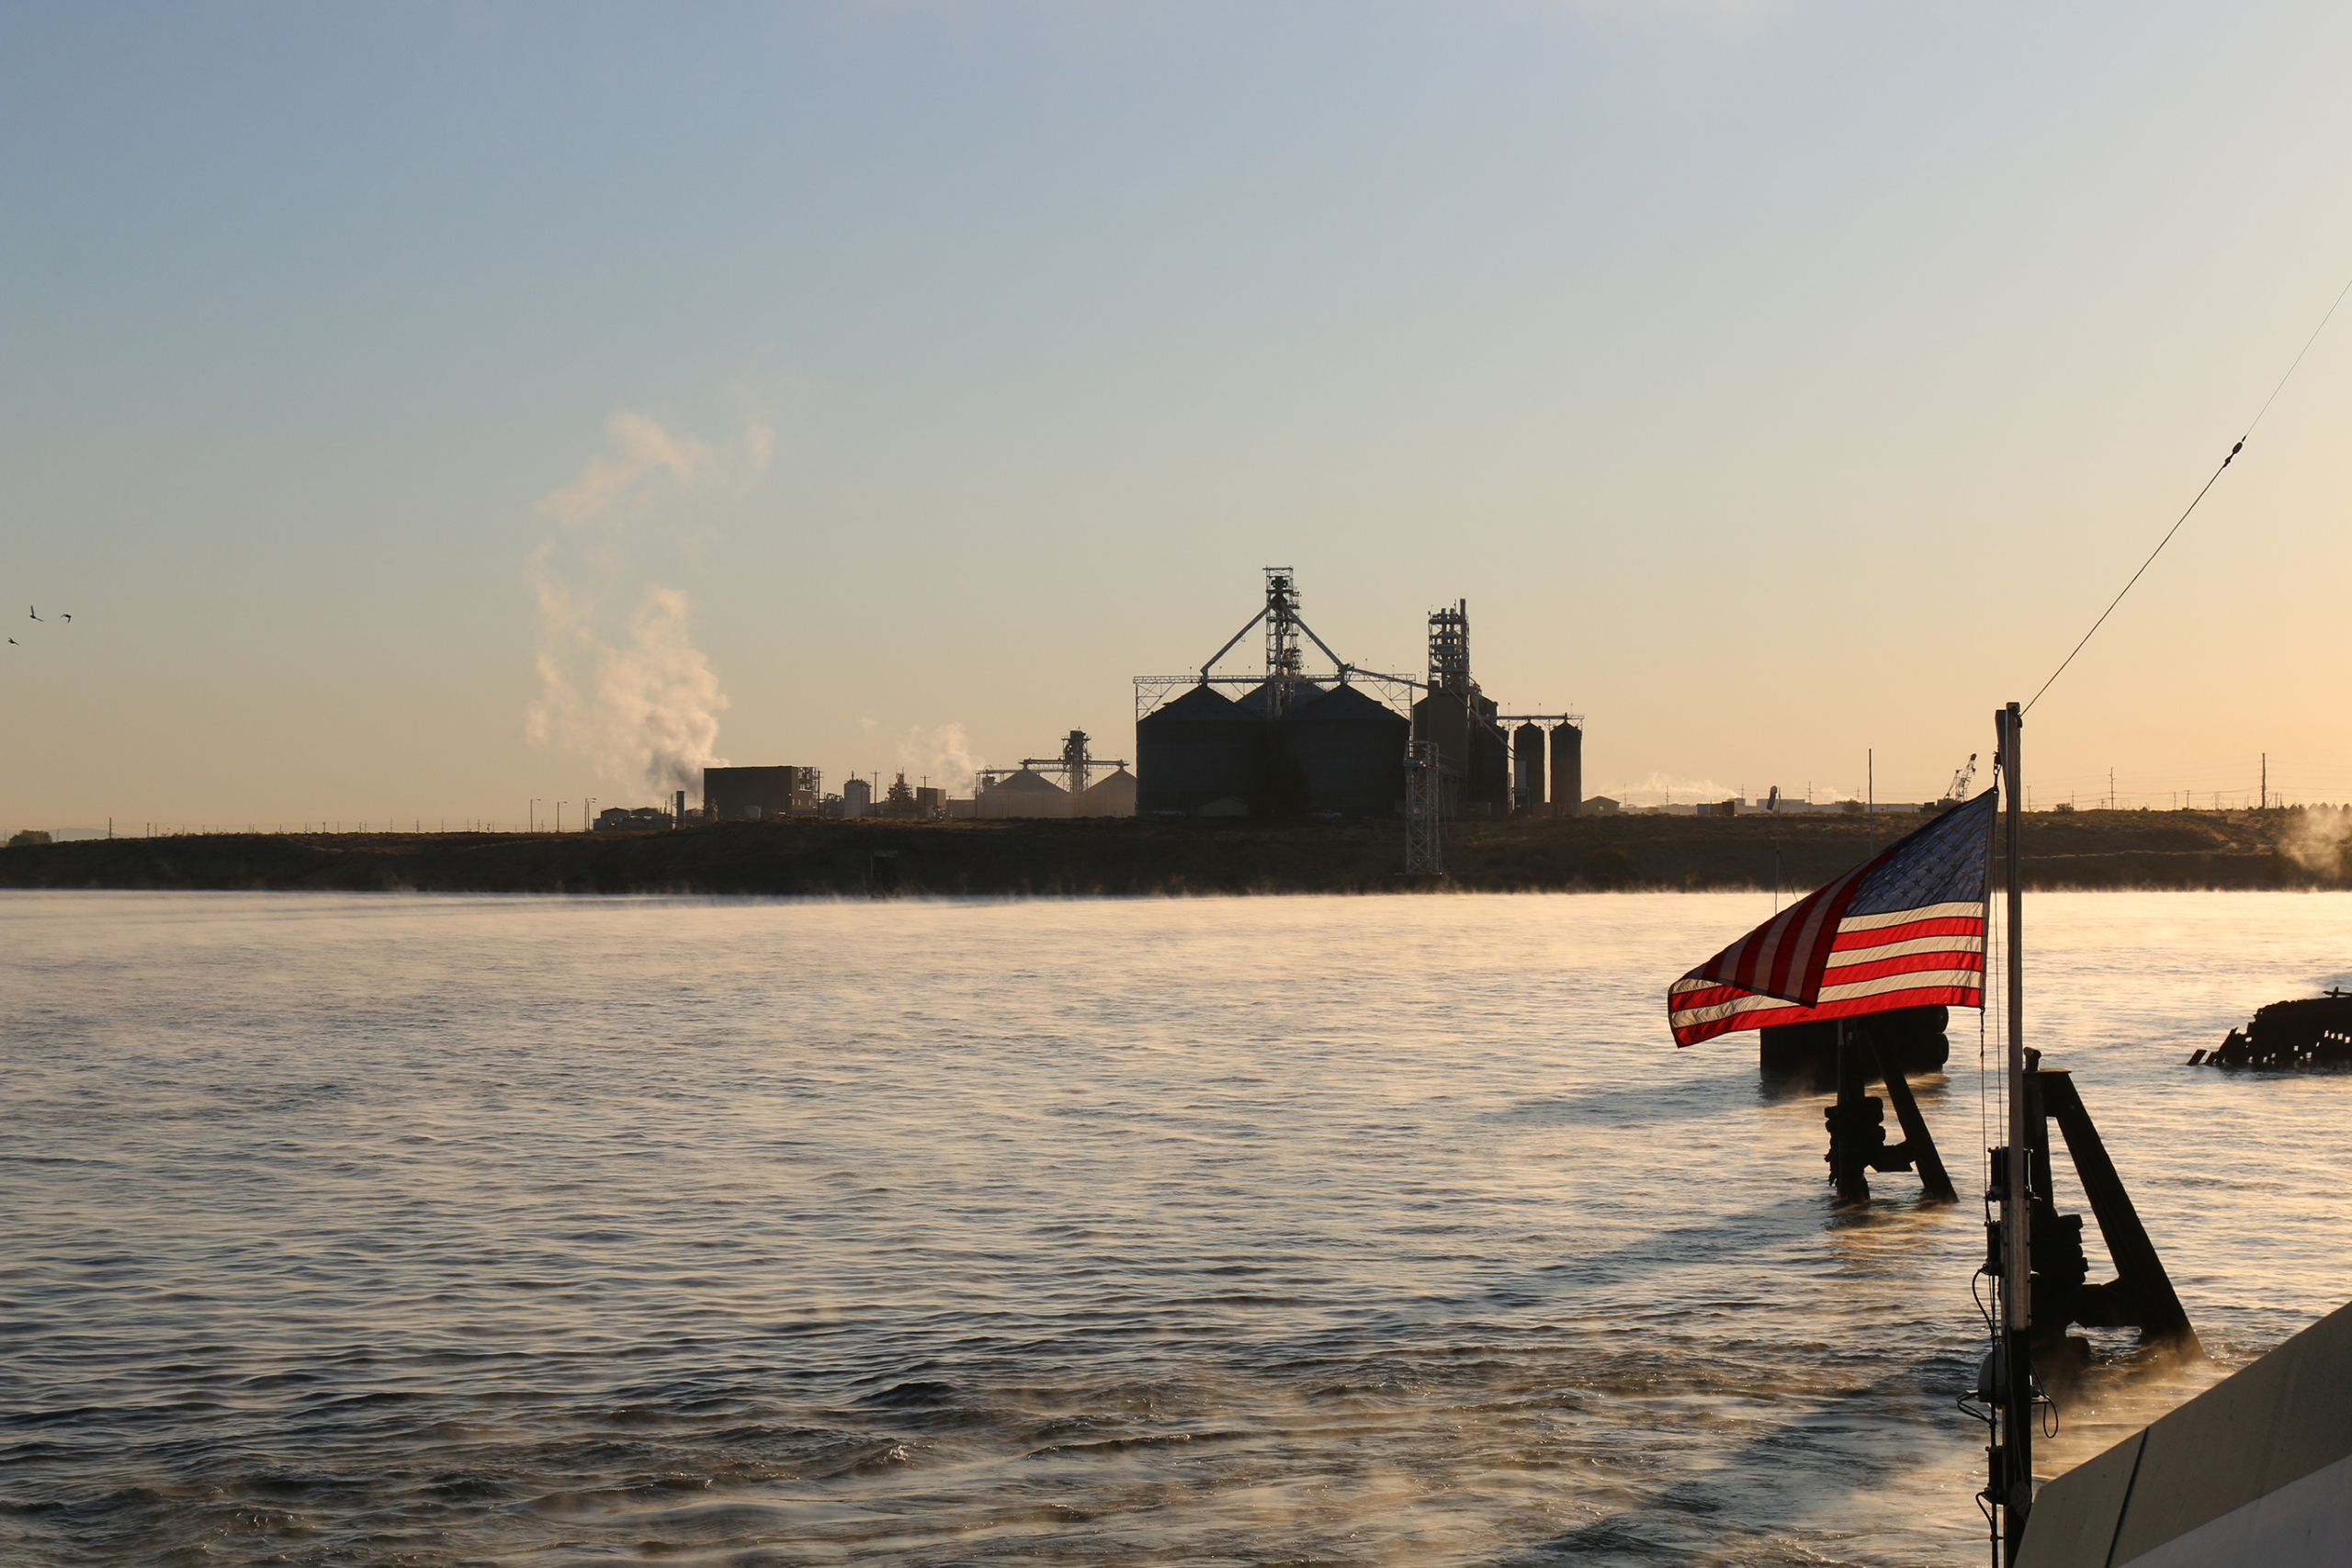
The Columbia Snake River System is a superhighway for moving wheat and other agricultural products from farm to market. The barges and rail lines that run on both banks of the Columbia River carry more than 55% of all U.S. wheat bound for export each year. Barges are the most efficient way to move large volumes of grain, making the river system a cost-effective and “green” logistical option. The Army Corps of Engineers maintains the lock system; its history goes back to the 1930s when President Franklin Roosevelt personally inaugurated Bonneville, the first of the eight dams and locks east of Portland.
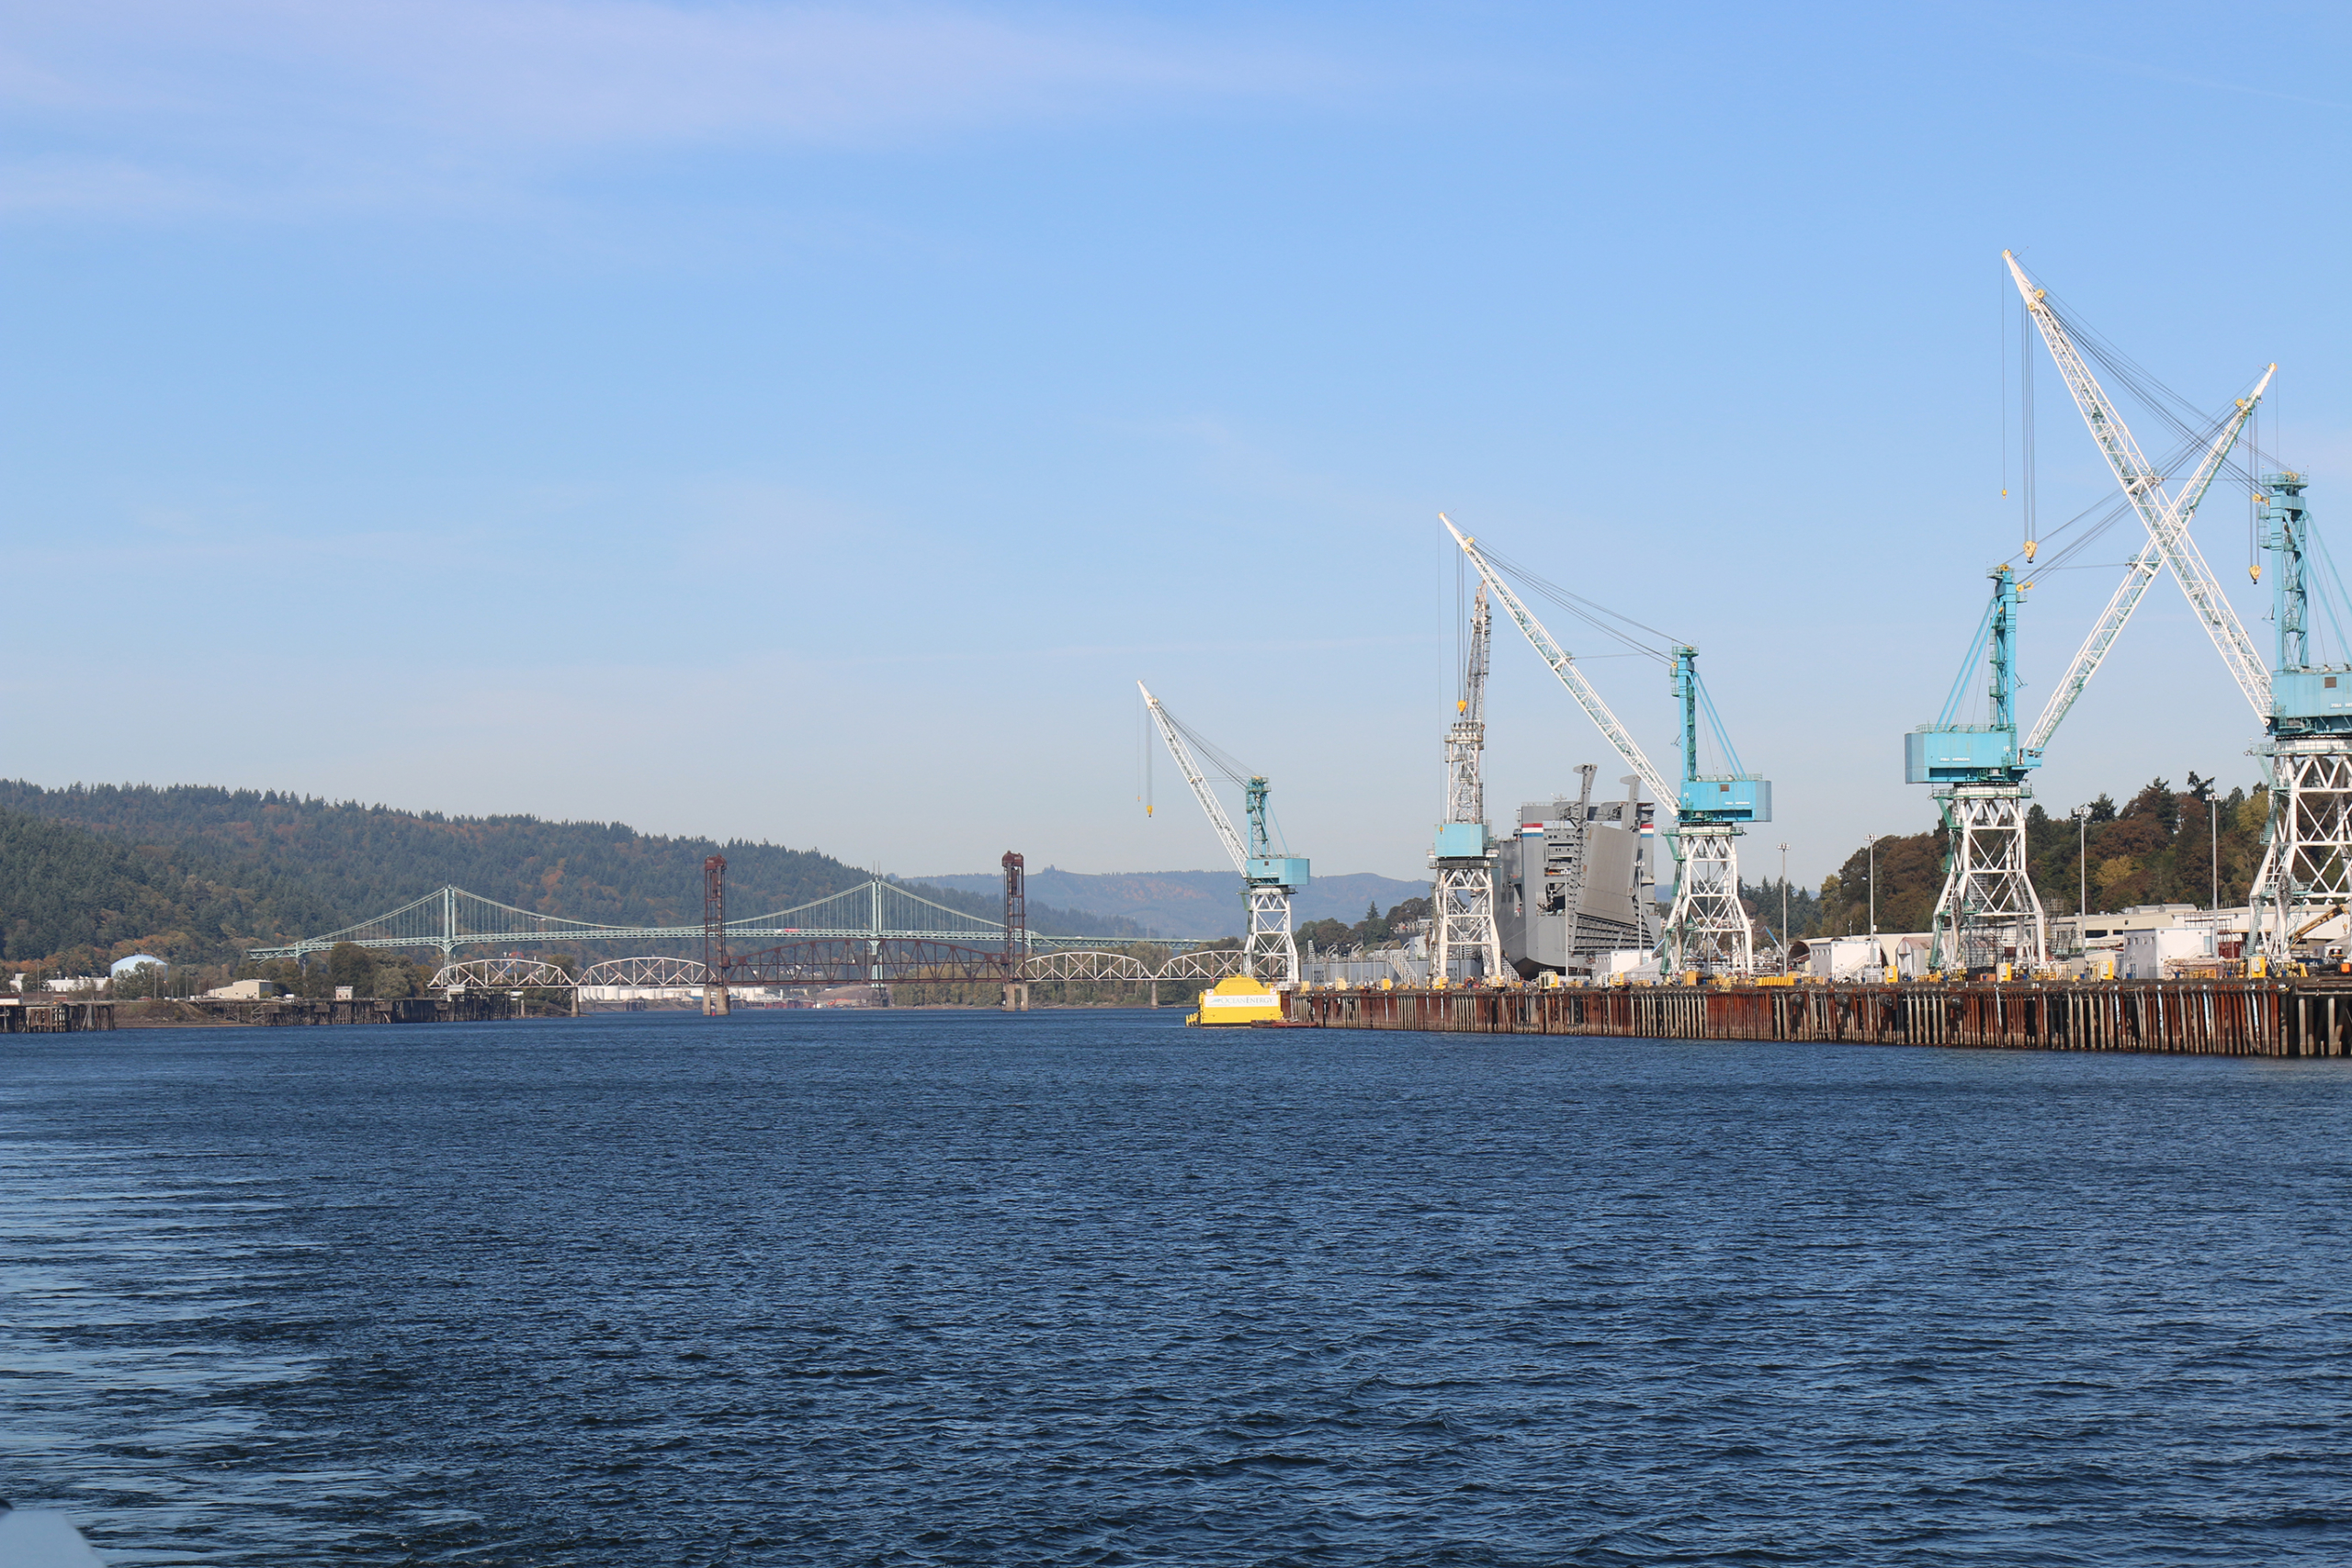
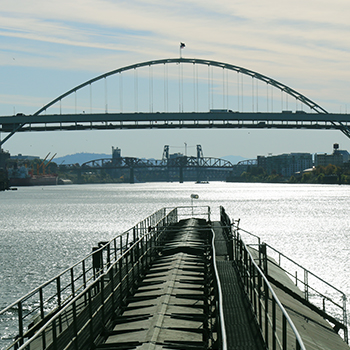
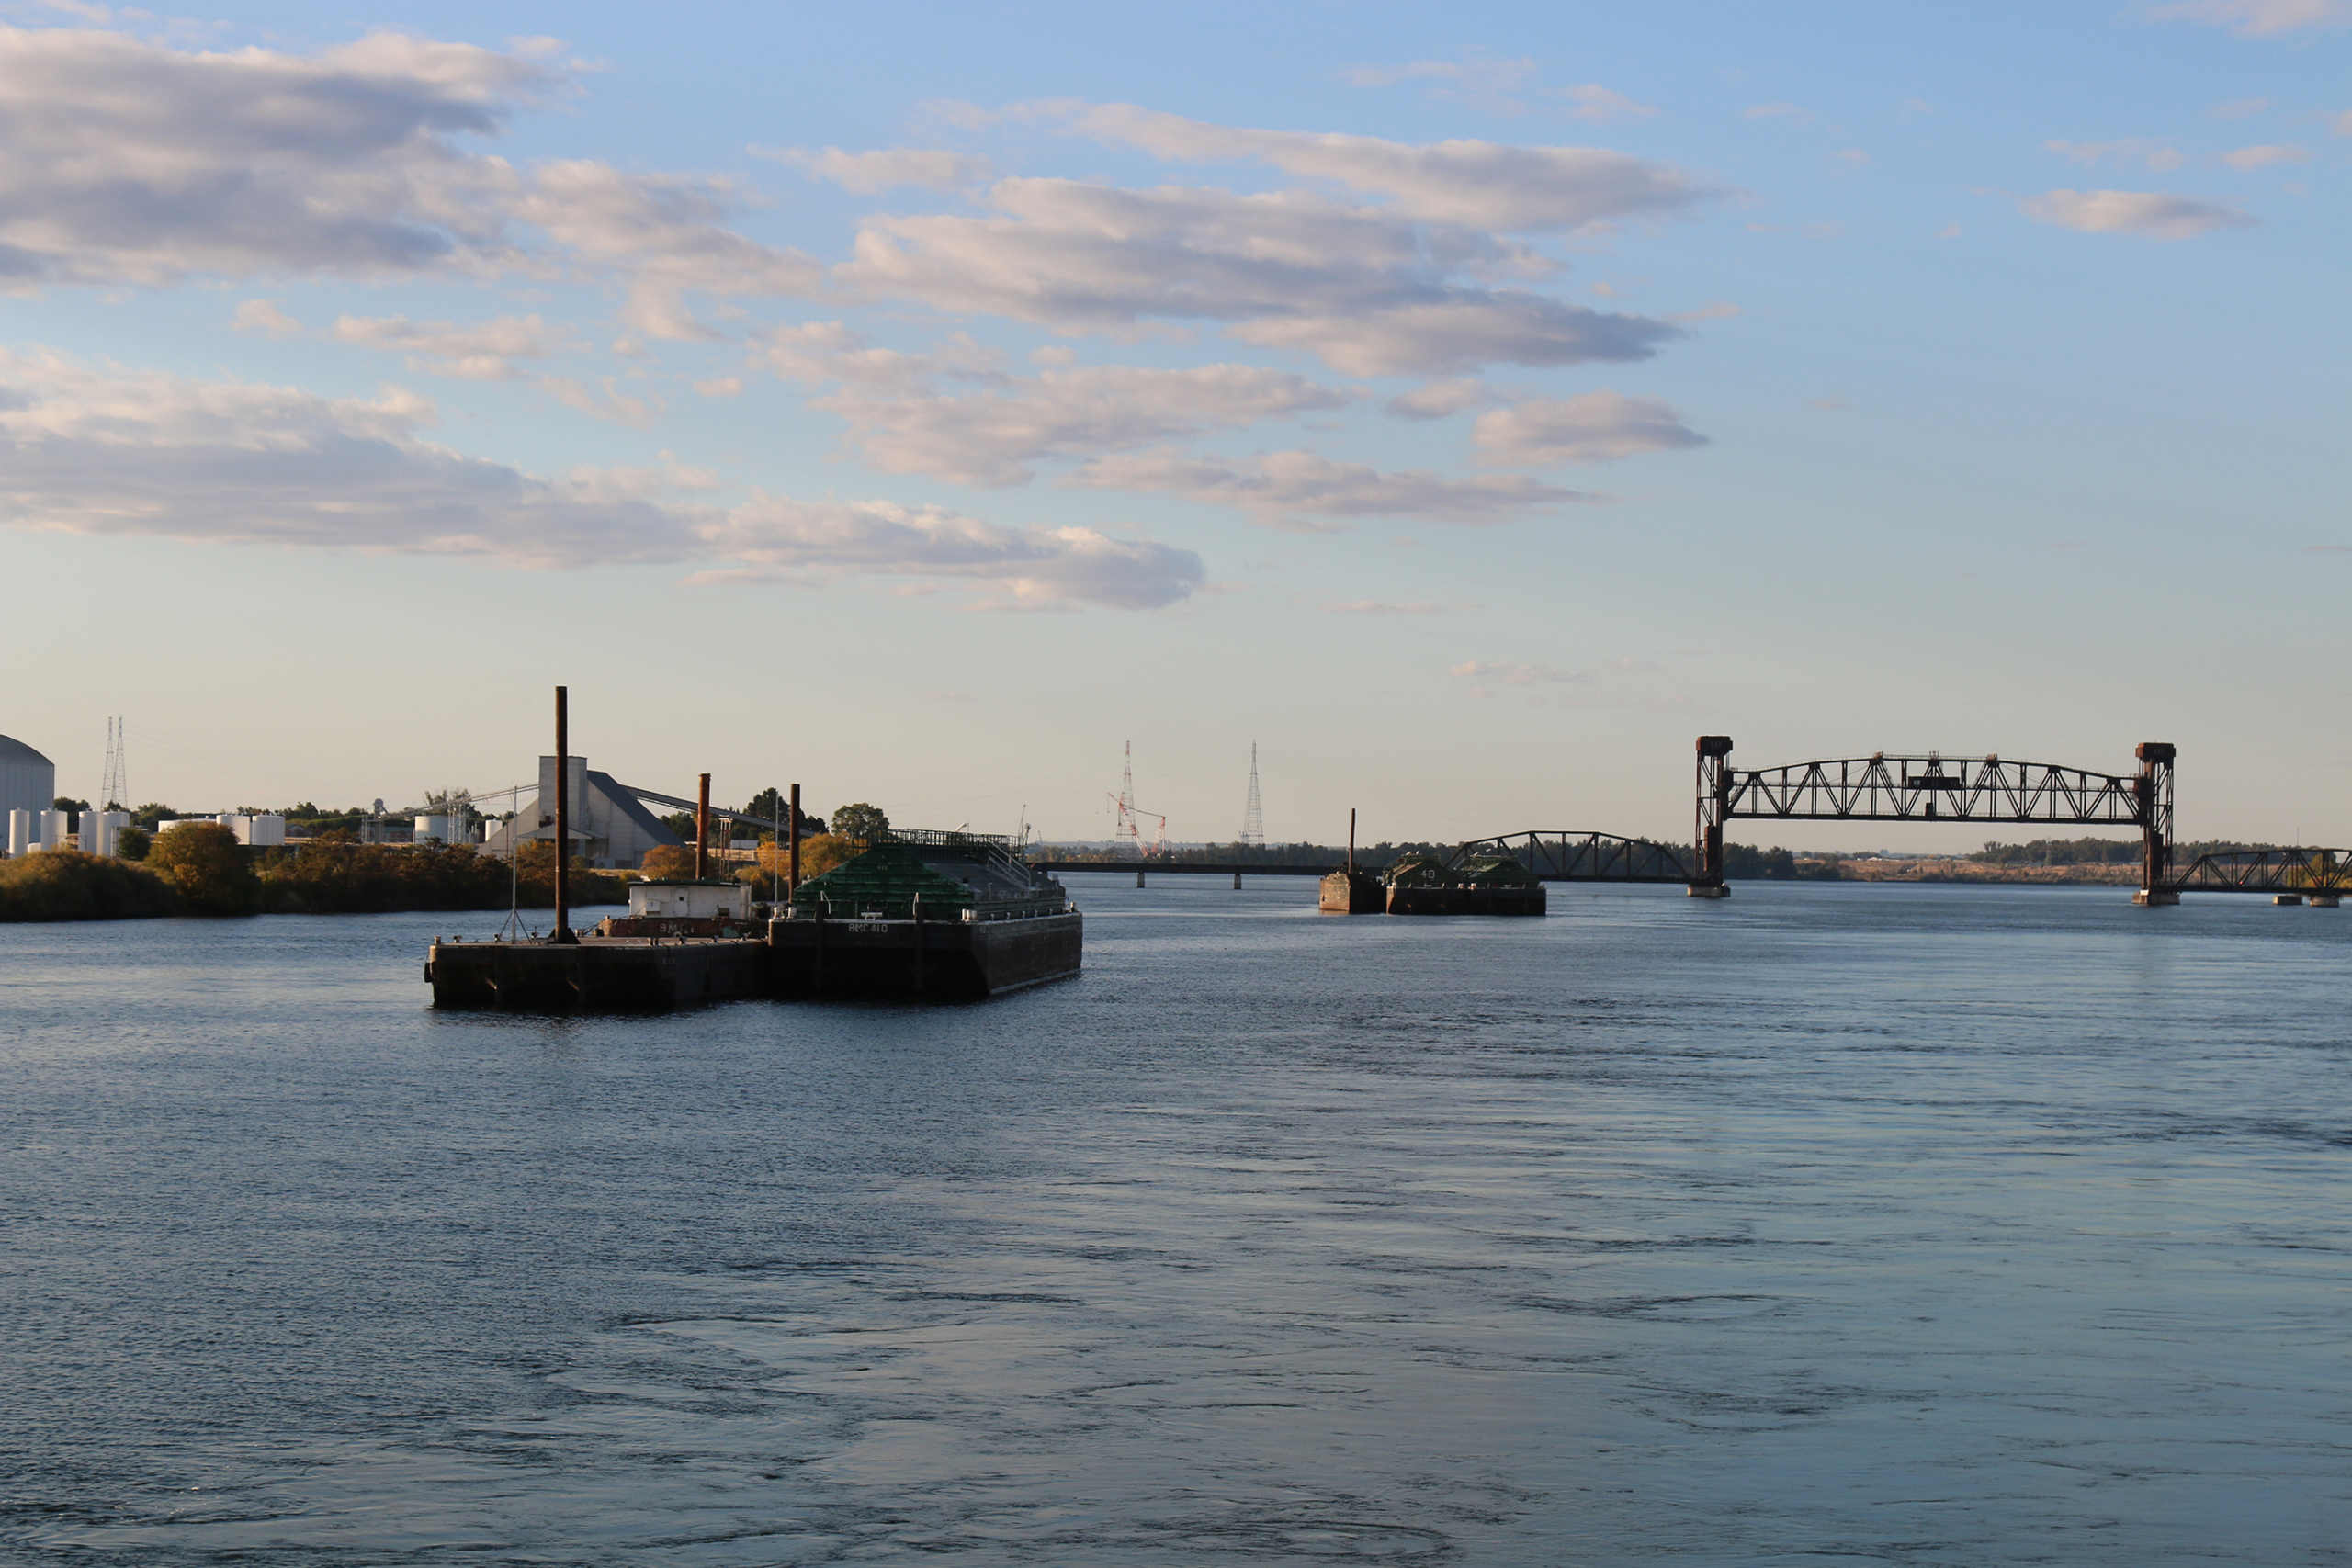
After about 60 hours on board the tugboat, we arrive in Vancouver, Wash., on the north bank of the Columbia River. We drop off two barges at an export elevator and proceed west again, up the north-flowing Willamette River that bisects Portland. It is my third river in a week, and we are taking the last barge to an export elevator just across the river from the U.S. Wheat Associates (USW) West Coast Office. There is a vessel at berth waiting for the wheat we carry. The crew drops the barge, and me, at the elevator. I walk up a set of metal stairs connected to a hoist and hop off, touching land for the first time since Tuesday. I walk across the river on Portland’s Steel Bridge, under which the wheat from our tow will pass on its way overseas, to my office.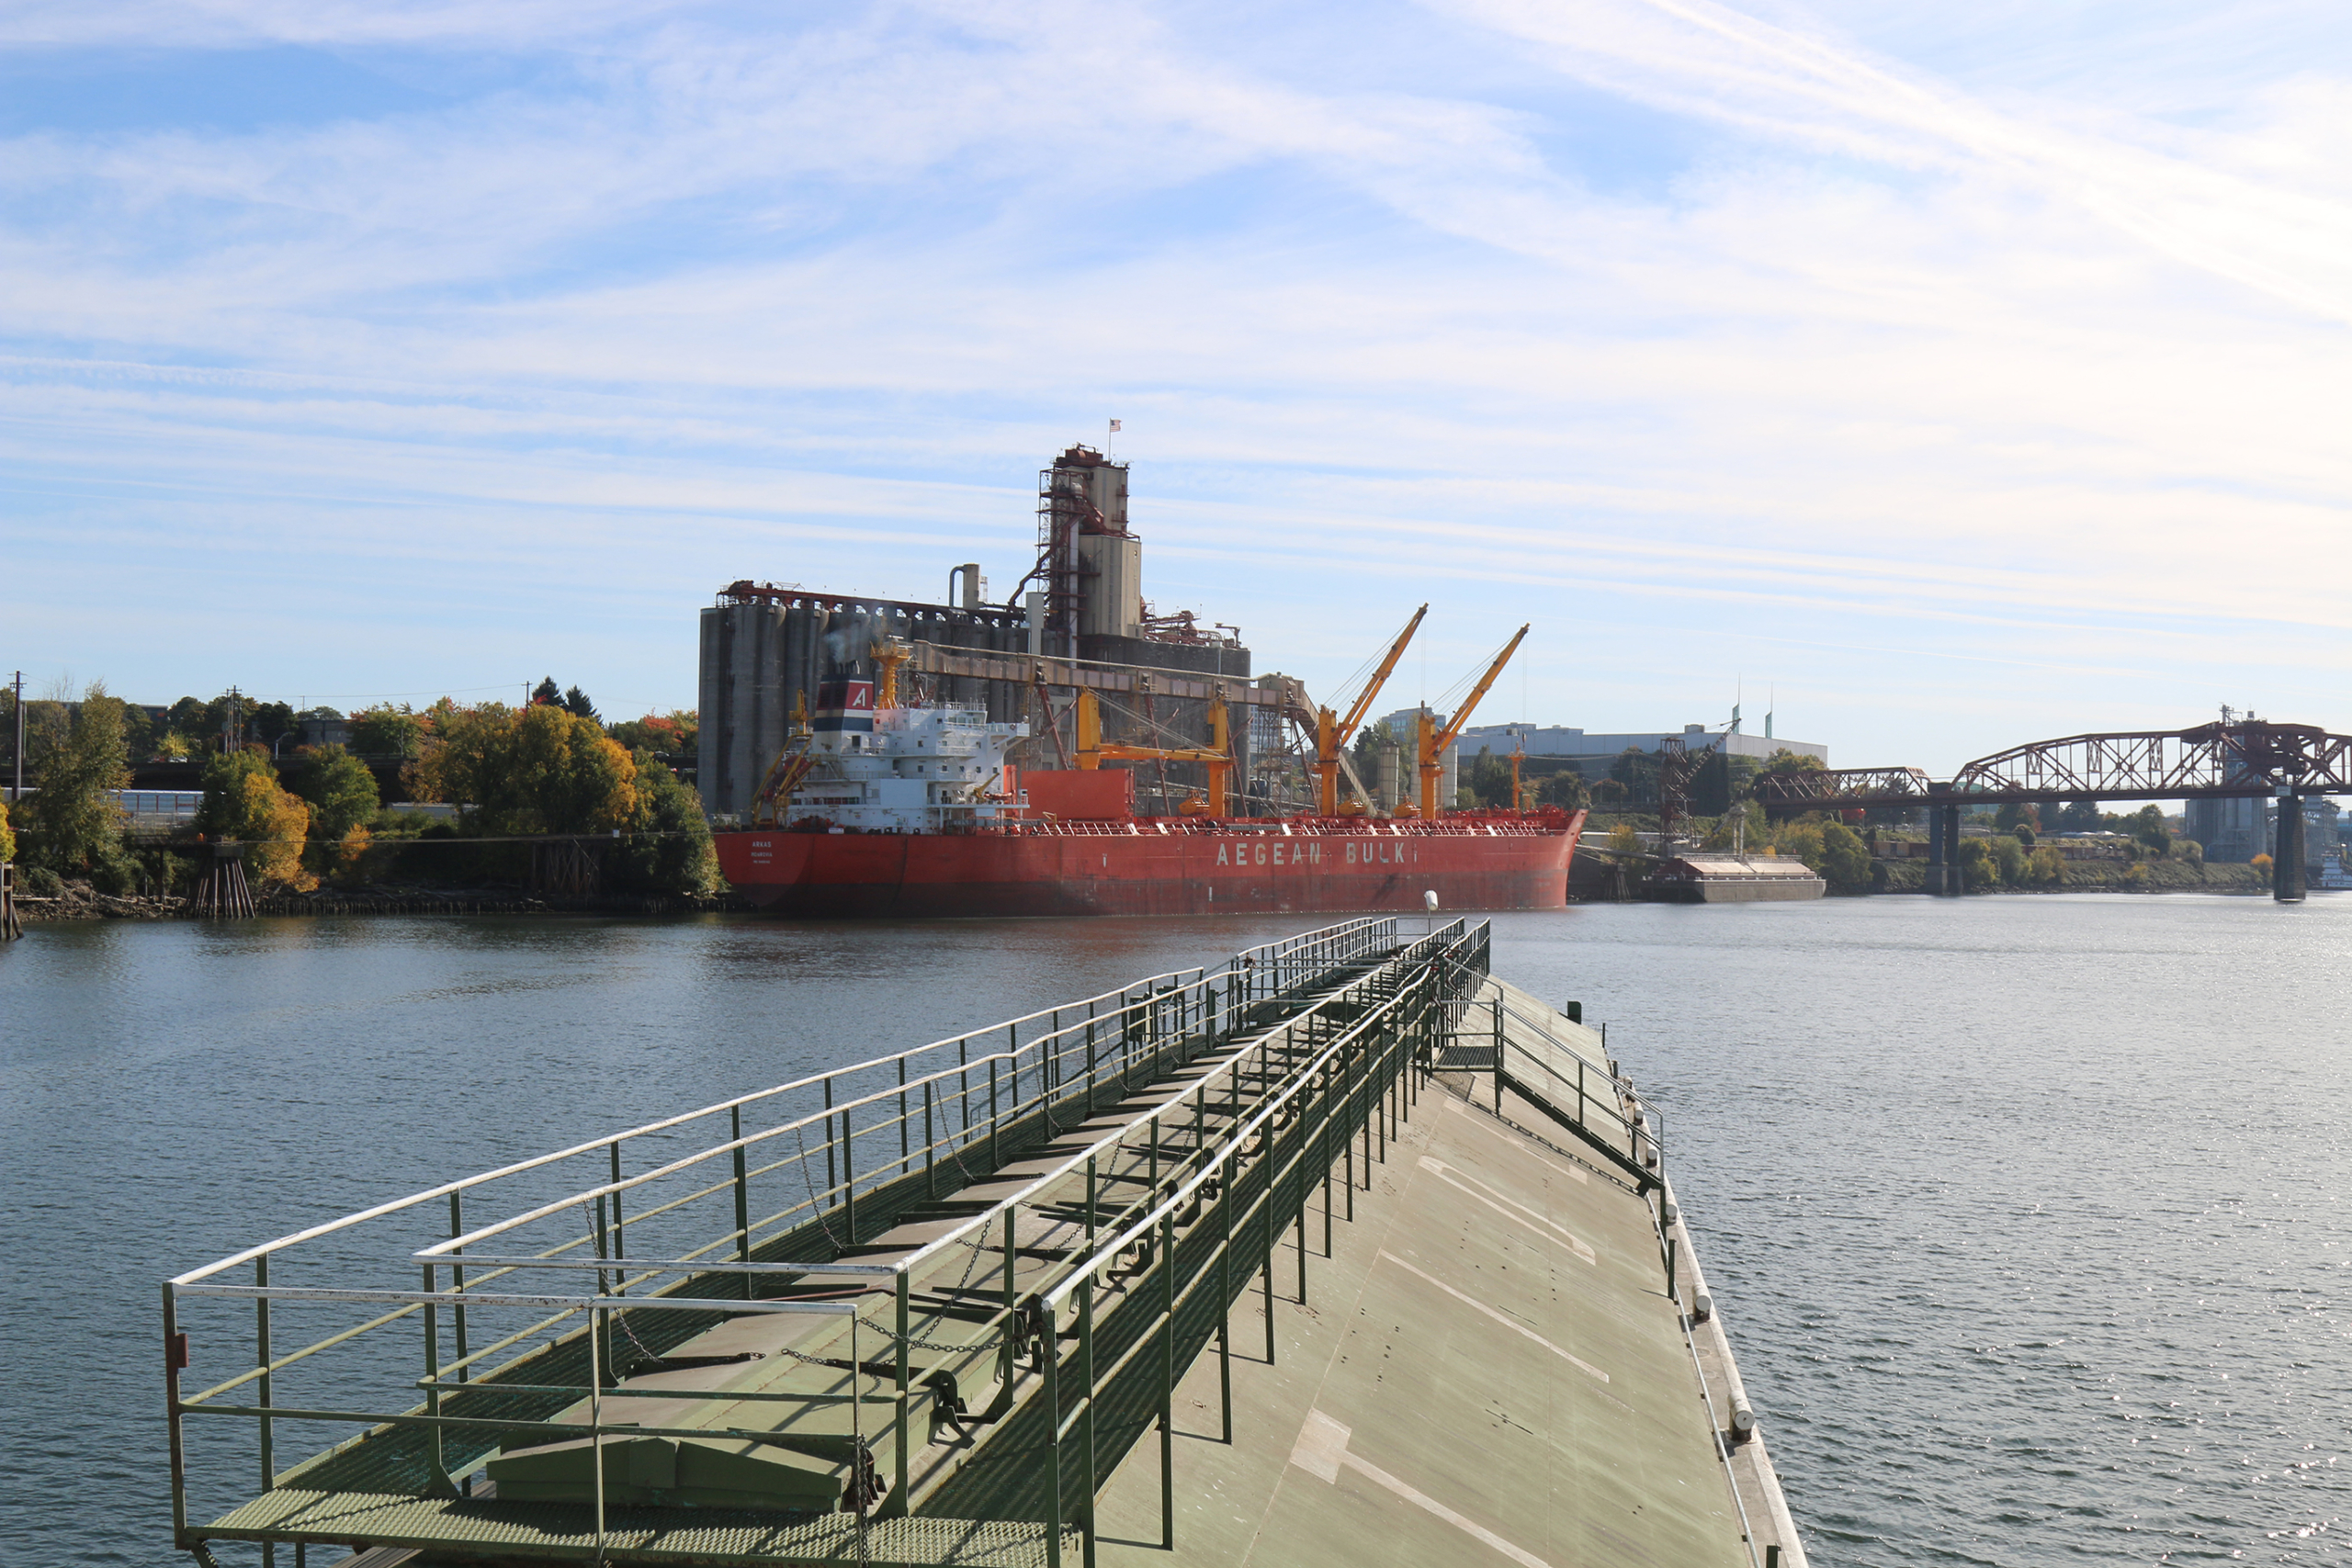
By Michael Anderson, USW Market Analyst
This story was originally published on October 21, 2019.