By Claire Hutchins, USW Market Analyst
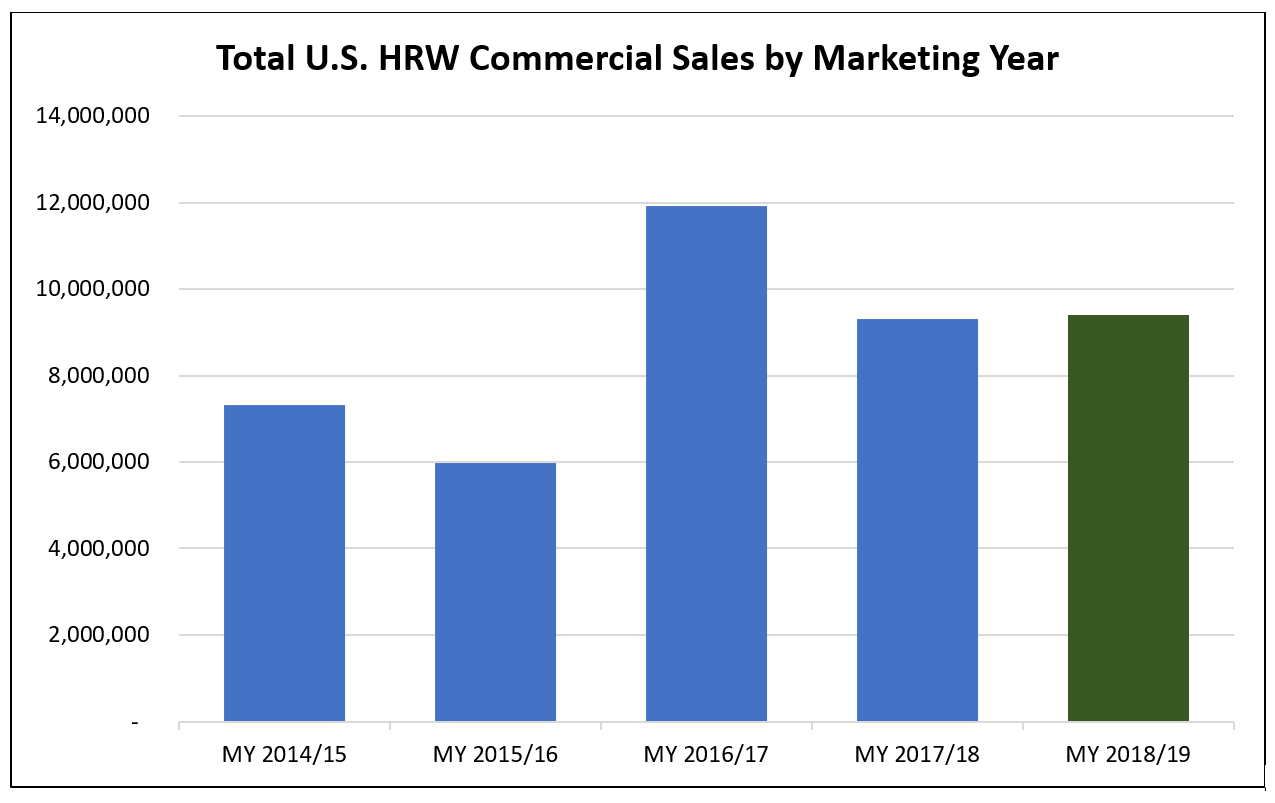
According to USDA’s June WASDE (World Agricultural Supply and Demand Estimates) report, U.S. feed wheat consumption will increase 64% in marketing year (MY) 2019/20 to 3.81 million metric tons (MMT), compared to 1.36 MMT in MY 2018/19. U.S. Wheat Associates (USW) believes the current price relationship between domestic wheat and corn and the nutritional value of U.S. hard red winter (HRW) wheat and soft red winter (SRW) wheat support USDA’s estimates.
When the cash price gap between U.S. wheat and corn shrinks, wheat becomes an attractive feed ingredient for the cattle, swine and poultry industries. Per bushel, wheat is typically more expensive than corn, making it economically less practical as a staple ingredient in U.S. feedlots. However, recent market conditions are changing wheat and corn feeding ratios across the United States. The spot price gaps between U.S. winter wheat and corn have diminished, and even inverted, over the past several months as the potential for a bountiful wheat harvest offsets the potential for lower corn production due to late spring planting in the Midwest.
HRW can be substituted for corn as cattle feed in the High and Southern Plains where much of the country’s HRW wheat is grown. The cattle industry, predominant in Kansas and Texas, favors wheat as a feed ingredient when HRW is less than $1.00/bu more expensive than corn. Between early May and late June, the average cash price for wheat and corn increased steadily in both states, but the price gap narrowed and eventually inverted by early July.
In early May, the cash price for HRW in Kansas, the third largest cattle-producing state in the country, was $0.49/bu higher than corn. By early June, the price gap dropped to $0.29/bu. On July 1, the average cash price for both commodities settled around $4.06/bu and by July 5, HRW was $.06/bu cheaper than corn at $4.20/bu. According to Aaron Harries, Kansas Wheat Commission Vice President of Research and Operations, Kansas feedlots are already feeding more wheat than usual as managers respond to market incentives. Importantly, the decision to feed more wheat is made based on months of efficient market conditions as the ideal cattle diet consists of at least six months of a consistent ingredient blend.
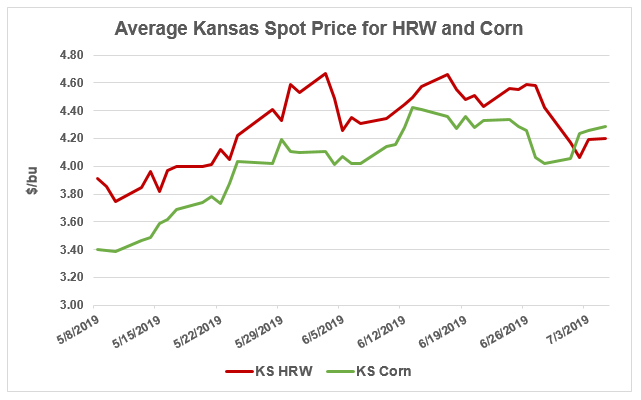
Source: Reuters Eikon
In Texas, the largest cattle-producing state in the country, the recent spot price relationship between HRW and corn has been much tighter. In the first half of May, the cash prices for HRW and corn were nearly tied around an average of $3.92/bu. By early June, the average cash price for HRW dropped $0.24 below corn’s $4.50/bu. The cash-price relationship between wheat and corn is still inverted as of early July and HRW is, on average, $0.37/bu cheaper than corn.
“We are seeing a trend of feedlots purchasing more wheat directly from producers and elevators,” says Darby Campsey, Texas Wheat Producers Board, Director of Communications and Producer Relations. “Market conditions and wheat quality are increasing the value of wheat compared to corn in some cases.”
Campsey explains that in addition to market conditions, Texas livestock producers make grain purchasing decisions based on nutritional needs and local supplies. When wheat protein is lower than average, producers may be more likely to sell to feedlots, where quality requirements are slightly easier to meet than milling standards.
In the Midwest and South, where much of the country’s SRW is grown, swine producers are willing to pay more for wheat than corn because of wheat’s high nutritional value, according to Joel DeRouchey, Kansas State University professor in swine nutrition and management. Corn is used as a feed ingredient for swine because it is cheaper and a higher source of energy than wheat, but wheat brings a higher concentration of amino acids and phosphorous to the animal’s diet. The same market conditions affecting Kansas and Texas can be seen in Illinois and North Carolina, making wheat an even more attractive feed ingredient for swine producers.
In Illinois, the fourth largest swine-producing state in the country, the average spot price gap between SRW and corn decreased significantly between early May and early July. In early May, SRW was, on average, $.90 more expensive than corn. By July 8, the difference collapsed to $.50 as SRW prices continued their decline to $4.92/bu and corn prices continued their incline to $4.42/bu.
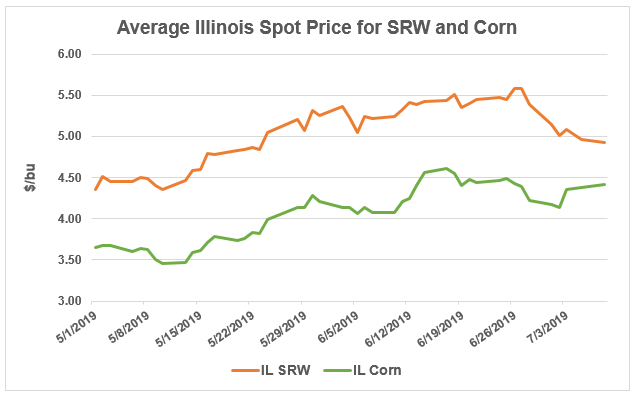
Source: Reuters Eikon
At an elevator in North Carolina, the second largest swine-producing state in the country, the spot price for corn surpassed the spot price for SRW between early June and early July. Between June 24 and July 5, the spot price for SRW sank from $4.82/bu to $4.38/bu while the price of corn hovered around an average $4.81/bu.
Wheat is also used as a corn feed substitute in the poultry industry due to its high protein content. Wheat becomes attractive to broiler producers when the price gap between SRW and corn narrows to $.50/bu. The average cash price for SRW in Kentucky, the seventh largest broiler producer in the country, decreased significantly between June 26 at $5.39/bu and July 5 at $4.91/bu, while the average price of corn increased from $4.36/bu to $4.60/bu. In early June, the average spread between SRW and corn was $.81/bu. As of July 5, the spread narrowed to just $.31/bu.
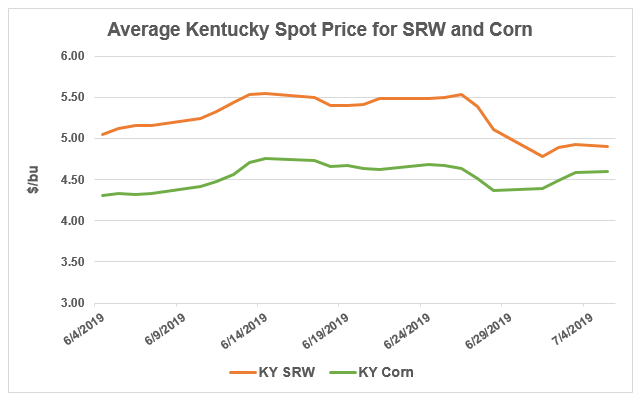
Source: Reuters Eikon
“I wouldn’t be surprised if more chicken producers are feeding wheat. Corn is preferred for chickens, because of its high energy levels, until corn prices rise too high, and right now cash prices for wheat and corn in Maryland are pretty close,” says Jason Scott, Maryland wheat farmer and USW past chairman. As of July 8, the average SRW spot price in Maryland, a top ten broiler producing state, was only $.10/bu higher than corn.
If the narrow or inverted price gaps between wheat and corn persist across the country, producers could continue to increase the amount of wheat used in feed blends for cattle, swine and poultry, potentially surpassing USDA’s estimate of 3.81 MMT.
Every month, USW publishes a graphic summary of the latest data from USDA’s WASDE report, including global wheat market factors, major country and regional export history and U.S. wheat supply and demand summaries by class. View the monthly summary here.