thumbnail

By Stephanie Bryant-Erdmann, USW Market Analyst


There is an old saying: “When there’s blood on the streets, buy property.” Given recent price movements, that could easily be changed to: “When trade policies are in the news, buy wheat.”


Since the steel and aluminum tariffs went into full effect for major U.S. wheat customers, September Kansas City hard red winter (HRW) wheat futures have fallen 51 cents per bushel ($19 per metric ton [MT]), September Chicago soft red winter (SRW) wheat futures dropped 25 cents per bushel ($9 per MT) and Minneapolis hard red spring (HRS) plunged 58 cents per bushel ($21 per MT).


Seasonal harvest pressure always impacts U.S. wheat prices during the summer months; however, this year the unique trade environment is also pressuring export demand and driving U.S. wheat prices lower. As of July 19, U.S. export sales for marketing year 2018/19 (June 1 to May 31) totaled 6.43 MMT, down 32 percent year over year. Exporters note that customers are choosing to purchase smaller than normal volumes of U.S. wheat, just what they need for the short-term or are waiting to make purchases, noting uncertainty about U.S. trade policies and their own countries’ retaliatory measures. Sales to the top five U.S. wheat customers — Mexico, Japan, the Philippines, Korea and Nigeria — are 27 percent behind last year’s pace.


Futures v Global S&D

U.S. wheat futures prices are not reflecting global supply and demand realities. Buyers are uncertain about the effects of unforeseen tariff wars and have altered their typical wheat import cadences.

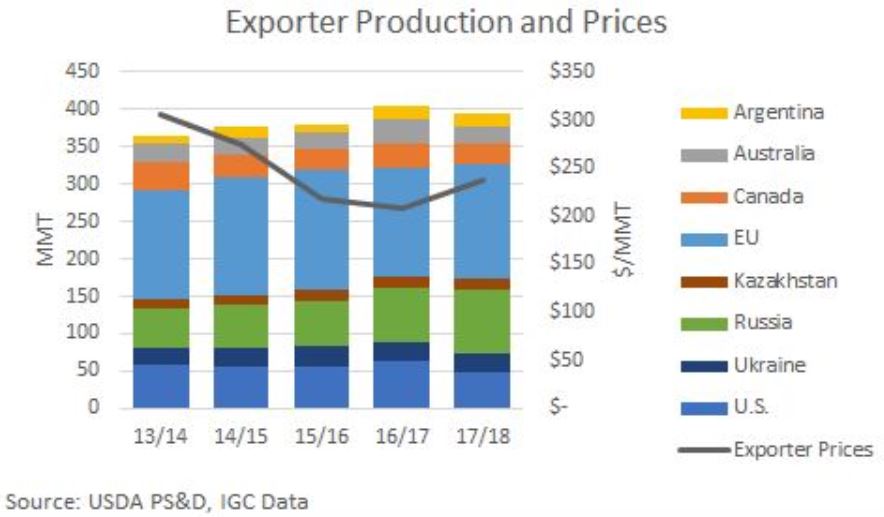
With trade policy issues dominating the headlines, U.S. wheat futures markets are mostly ignoring global wheat supply and demand fundamentals, which can be seen in competitors’ wheat prices. The average global wheat price is up 41 cents per bushel ($15 per MT) with larger increases noted in Australia and Argentina, which compete with the United States in key quality-driven markets. According to International Grains Council (IGC) data, the average price of Australian wheat is up $19 per MT and the average price of Argentine wheat is up $75 per MT. These price increases are driven by increased global wheat demand, shrinking global wheat supplies and their location.


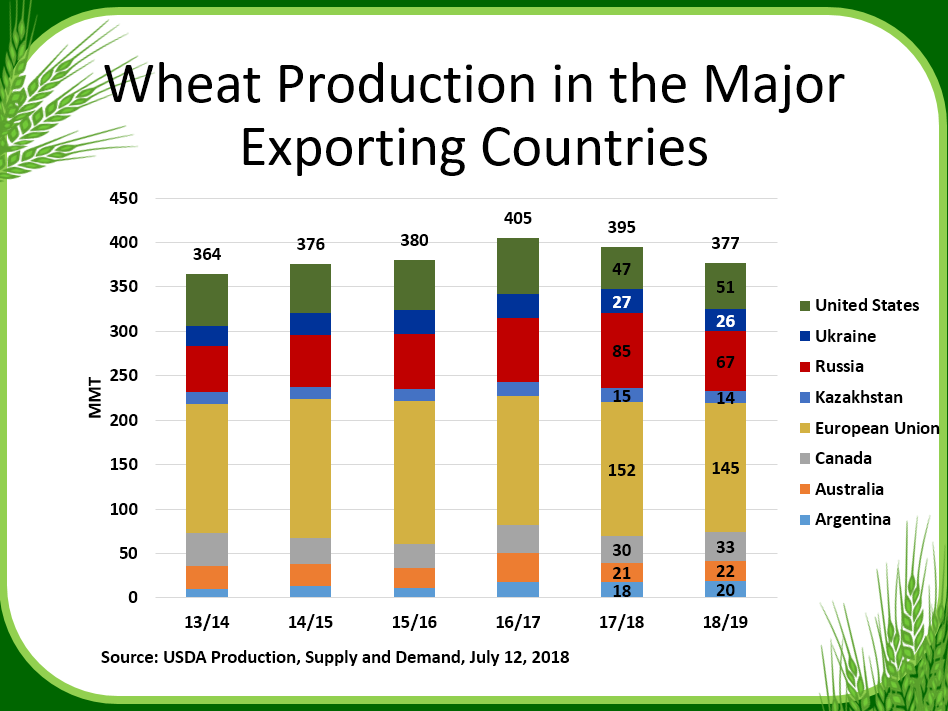
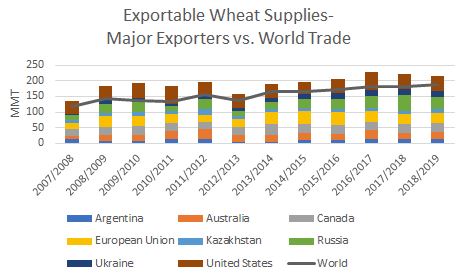
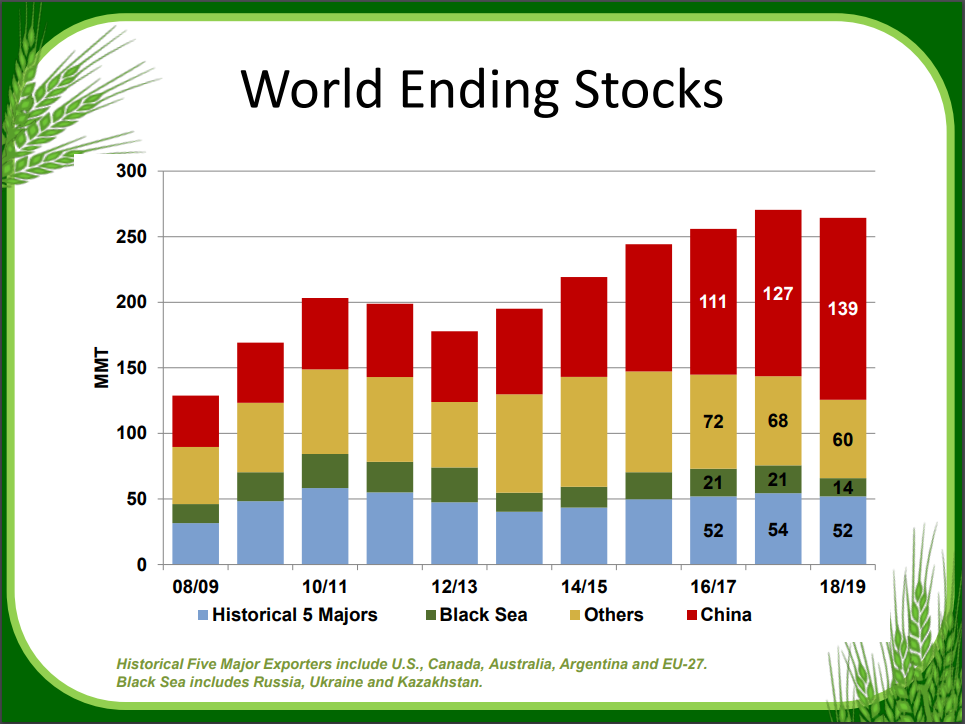
USDA noted in last week’s World Agricultural Supply and Demand estimates that global wheat production will fall to 737 MMT in 2018/19, the first drop in 5 years and down 3 percent from 2017/18. Decreased production is expected in the European Union (EU), Russia, Ukraine, Kazakhstan, and Australia. While the United States, Canada and Argentina are expected to have increased production, exporter supplies are expected to fall 20.2 MMT year over year.


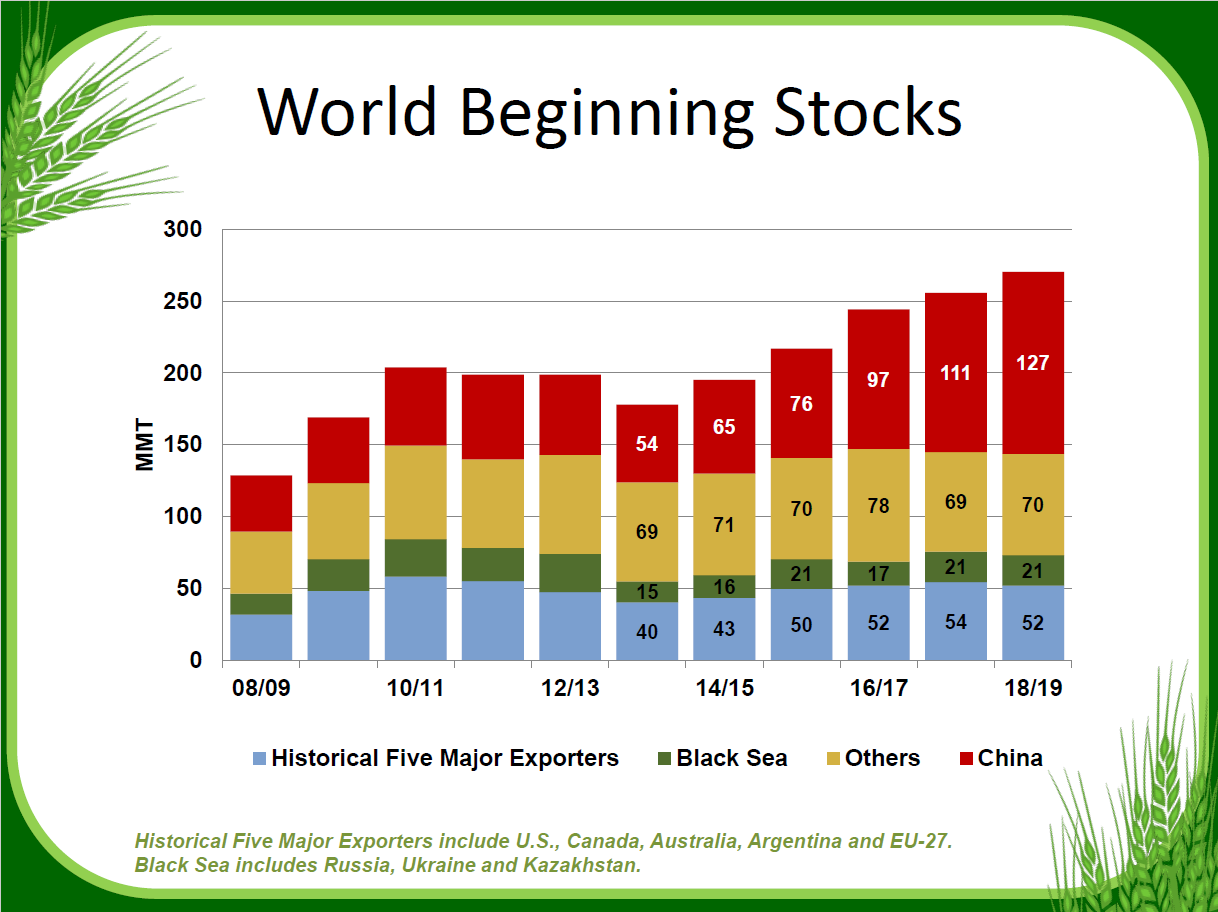
Simultaneously, many importers are engaging in “just in time” purchases since wheat price movement has rewarded their patience the last few years. USDA expects importer ending stocks to fall to 49.8 MMT in 2018/19, the lowest amount in a decade.


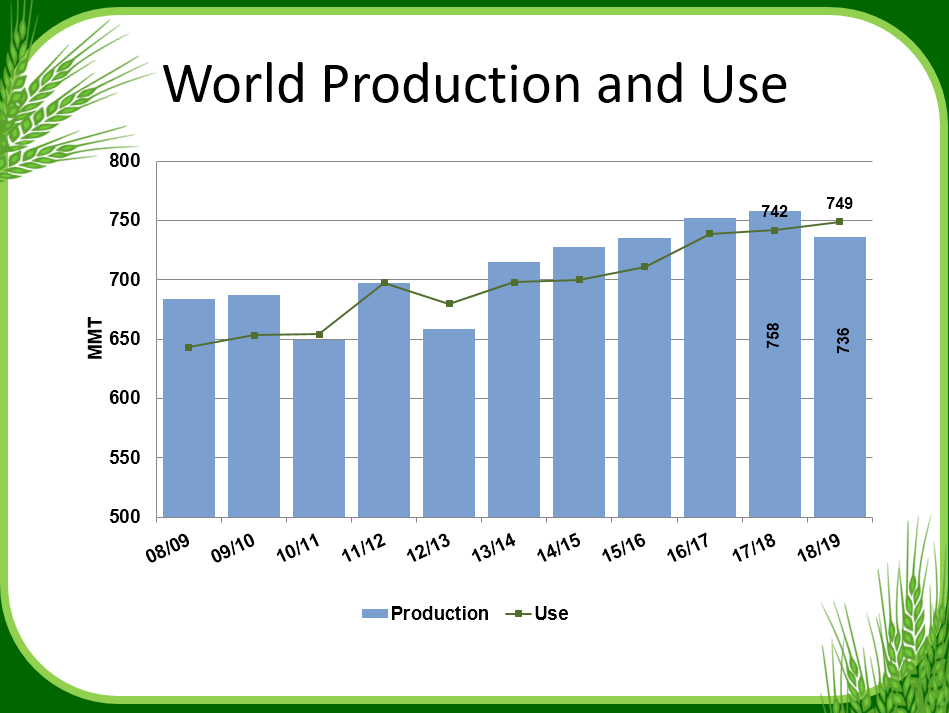
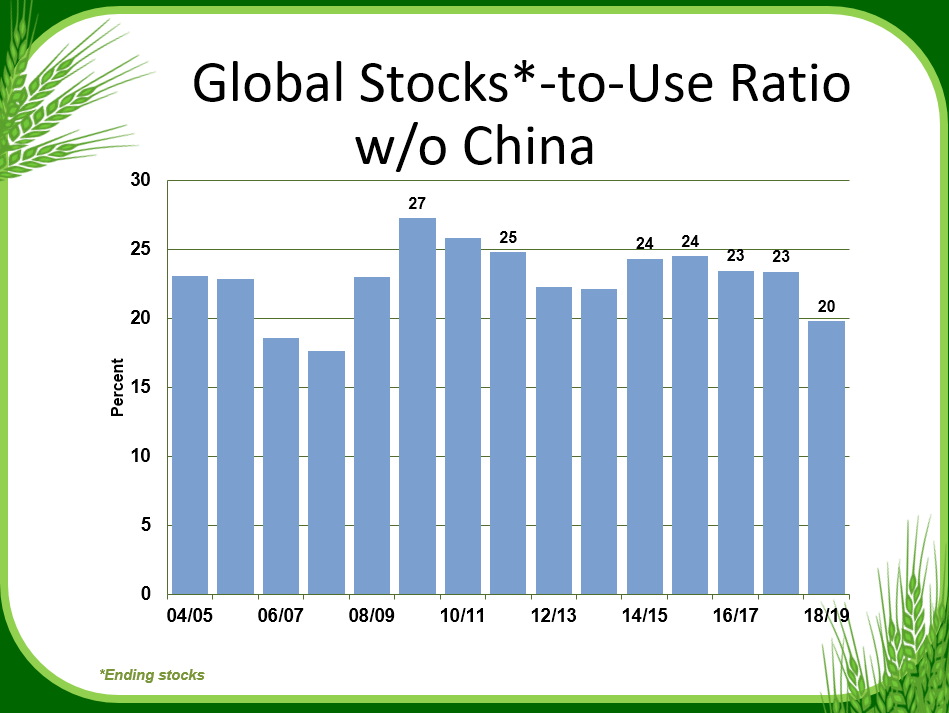
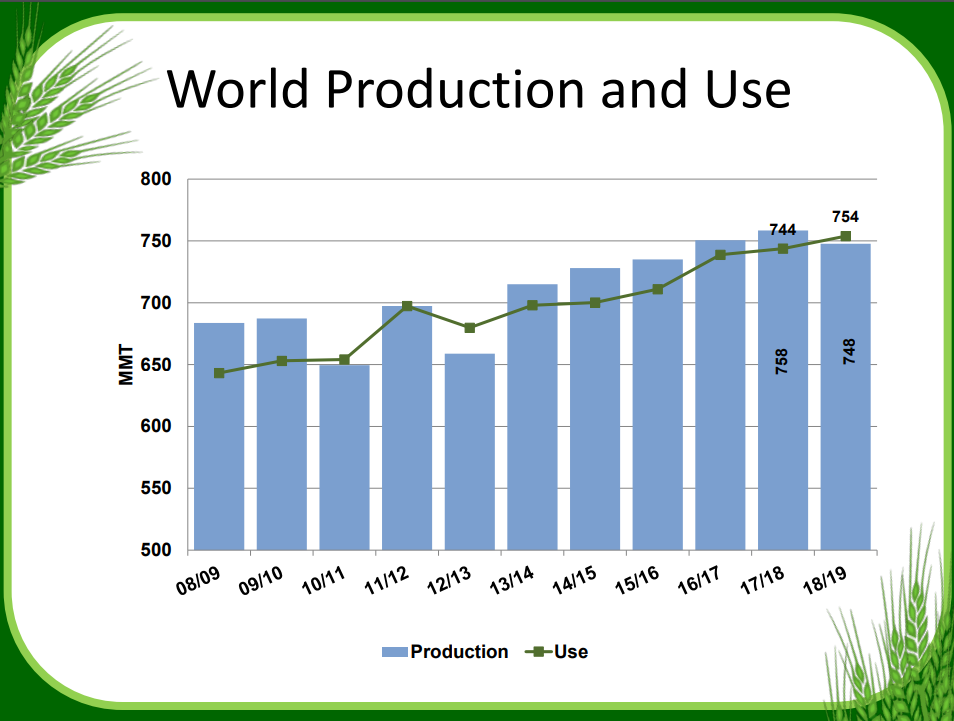
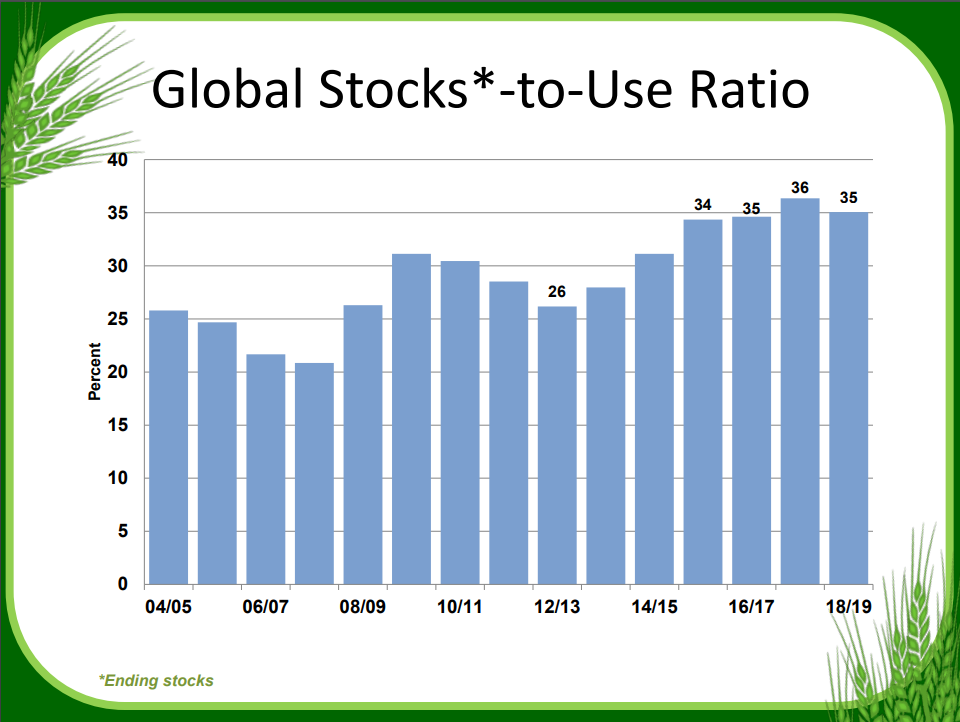
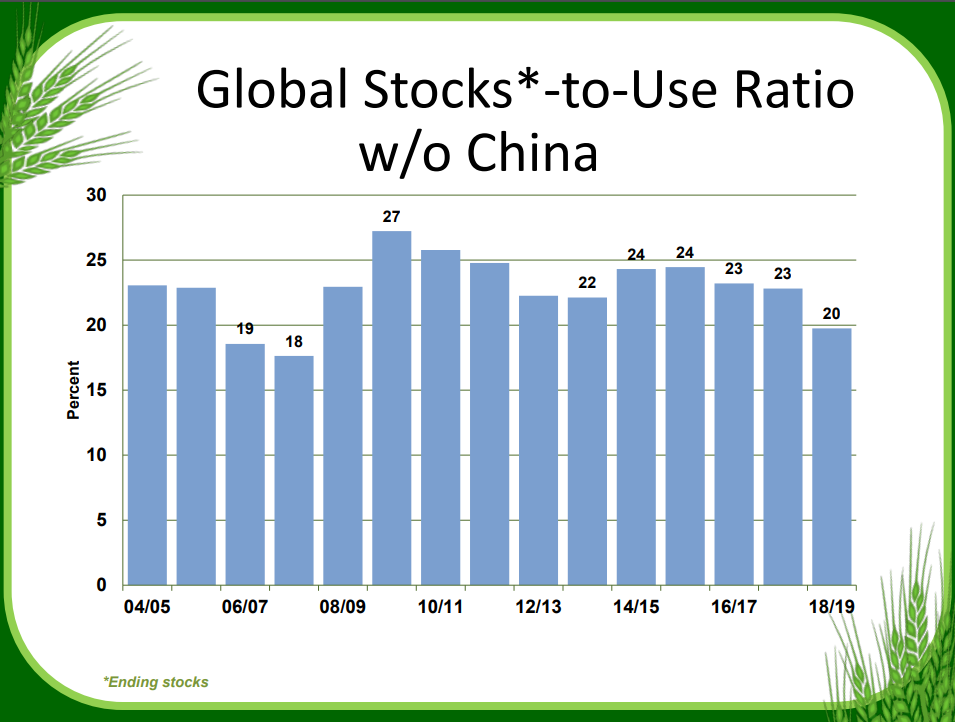
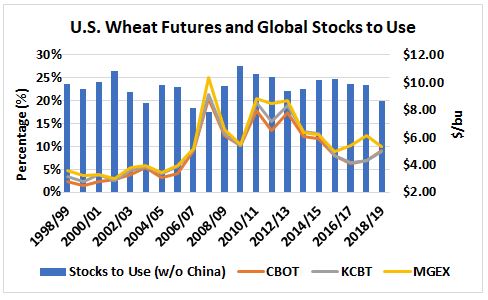
While importer stocks are shrinking, USDA expects global wheat demand to surge to a new record high of 749 MMT, 4 percent above the 5-year average. That means that global wheat consumption will outpace global wheat production by 12.6 MMT this year and drop the global wheat stocks-to-use ratio (excluding China) to less than 20 percent. A level that has not been seen since 2007/08.


For perspective, in July 2007 all three wheat futures were above $6.00 per bushel ($220 per MT) and would continue climbing until March 2008 when prices peaked at $11.60 per bushel ($426 per MT) for SRW, $12.17 per bushel ($447 per MT) for HRW and $17.30 per bushel ($636 per MT) for HRS. On Friday, July 20, those three futures were at $5.16 per bushel ($190 per MT), $5.08 per bushel ($187 per MT) and $5.55 per bushel ($204 per MT), respectively, indicating there is a lot of room for upward mobility.


With exporter supplies shrinking and importers continuing a “just in time” purchasing pattern, global wheat prices are sitting on a powder keg that trade policy issues are currently disguising. Customers should take advantage of current U.S. futures price levels and lock in the competitive prices.


To track U.S. wheat export prices, subscribe to the USW Weekly Price Report.

thumbnail

By Stephanie Bryant-Erdmann, USW Market Analyst

USDA raised 2018/19 U.S. wheat production to 51.2 million metric tons (MMT), up 8 percent from 2017/18, if realized. Along with the increase, USDA also released its first U.S. by-class forecast for U.S. wheat. Increases in hard red spring (HRS), soft red winter (SRW) and soft white (SW) wheat are expected to more than offset a 12 percent year over year reduction in hard red winter (HRW). U.S. spring wheat production is expected to increase to 15.9 MMT, up 52 percent from the previous year when drought shriveled the crop.

But while wheat production is expected to increase in the United States, it is expected to fall globally in 2018/19. USDA forecast 2018/19 total world wheat production at 736 MMT, down 3 percent from the year prior, if realized. The largest decrease is expected in Russia, which is forecast to produce 67.0 MMT, down 18.0 MMT from 2017/18 due to poor growing conditions. Wheat production is also expected to fall in the European Union (EU) and Australia due to dry conditions.

While 2018/19 world wheat production is expected to fall for the first time in 5 years, world wheat consumption is expected to grow 5.23 MMT from the previous year to 749 MMT. If realized, world wheat consumption will outpace world wheat production by 12.6 MMT in 2018/19.

With consumption outpacing production, world wheat ending stocks are expected to fall to 261 MMT, down 5 percent from 2017/18. The reduction in ending stocks puts the 2018/19 global stocks-to-use ratio (excluding China) just under 20 percent, which is the lowest level since 2007/08.


thumbnail

By Stephanie Bryant-Erdmann, USW Market Analyst

With the world consuming more wheat than it produces for the first year since 2012/13, prices are also on the rise. According to Global Trade Atlas data, the average global wheat price increased 4 percent year over year to $203 per metric ton (MT) in 2017/18 (June 1 to May 31). Most of that price increase occurred in the last five months of the marketing year as the market digested lower Northern Hemisphere wheat production estimates and strong demand for 2018/19.

Here is a by-country look at current production estimates and the average wheat prices (noting that prices vary by class and quality) from major exporting countries and regions.

United States. According to the U.S. Wheat Associates Price Report, the average price for U.S. wheat rose an average $47 per MT from one year ago. Hot, dry conditions in the U.S. hard red winter (HRW) growing region decreased yield potential and pushed prices up for this largest U.S. wheat class. USDA forecasts U.S. 2018/19 wheat production at 49.7 million metric tons (MMT), up 5 percent year-over-year, but still 11 percent below the 5-year average. U.S. beginning stocks are estimated at 29.4 MMT, down 8 percent from 2017/18, but still 28 percent above the 5-year average. Increased U.S. wheat production is expected to offset the lower U.S. beginning stocks and total U.S. supply is expected to remain stable year over year at 79.1 MMT.

Canada. The International Grains Council (IGC) reported the average price for Canada Western Red Spring (CWRS) at 13.5 percent protein (13.5 percent moisture basis) from Vancouver rose to $255 per MT in May. This is up $24 per MT from May 2017 and reflects the tighter global supply and demand picture. On June 21, Agriculture and Agri-Food Canada (AAFC) forecasted 2018/19 common wheat production (excluding durum) at 25.4 MMT, up slightly from 2017/18. A 15 percent bump in spring wheat planted area contrasts with an 11 percent drop in winter wheat planted area. Predicted 2018/19 durum production will increase 15 percent to 5.7 MMT due to an 11 percent year over year increase in planted area. The global supply and demand situation for durum wheat is also supporting prices. Canadian durum prices at $282 per MT are an average $7 per MT above 2017 levels.

European Union (EU). IGC reported the average French wheat price reached $205 per MT in May, up from $187 per MT the year prior. French production is expected to increase to 37.8 MMT, up 4 percent due to higher expected yield and larger planted area. 2018/19 EU wheat production is expected to fall 1.80 MMT from 2017/18 to 140 MMT according to Stratégie Grains, which is providing continued price support for exportable French supplies.

Australia. The current average price for Australian wheat of $239 per MT is up 22 percent year over year according to IGC data, which point to lower carry-in stocks and hot, dry conditions. In June, the Australian Bureau of Agricultural and Resource Economics and Science (ABARES) forecasted 2018/19 Australian wheat production to rise 3 percent from 2017/18 to 21.9 MMT, despite a 3 percent decrease in planted area to 29.5 million acres (12.0 million hectares).

Argentina. In May, the average price for Argentine wheat reached $261 per MT according to IGC data. That is up 38 percent year over year. This month, the Buenos Aires Grain Exchange reported Argentine farmers see higher revenue potential and expects them to plant 7 percent more area to wheat in 2018/19, reaching 15.1 million acres (6.1 million hectares). USDA’s June estimate for 2018/19 Argentina’s wheat production was 19.5 MMT (716 million bushels), up 8 percent from 2017/18 and 35 percent greater than the 5-year average.

Black Sea (Russia, Ukraine and Kazakhstan). The average price for Russian 4th grade milling wheat (8.8 to 10.5 percent protein on a 12 percent moisture basis) reached $213 per MT in May, up 14 percent from the year prior according to IGC. Expectations for lower 2018/19 production in the Black Sea region are supporting export prices. USDA projects combined 2018/19 output from Russia, Ukraine and Kazakhstan will drop 14 percent to 109 MMT (4.00 billion bushels) based on an expected return to trendline yields. If realized, the combined harvest would still be greater than the 5-year average.

At the end of May, the Russian Meteorological Service noted hot, dry conditions threatened winter wheat in Russia’s southern regions, which have not received rain since April. Conversely, cold wet weather is delaying spring wheat planting in other regions. To date, 23.3 million acres (9.43 million hectares) of spring wheat has been planted, compared to the 2017/18 total spring wheat area of 30.9 million acres (12.5 million hectares). Russian consultancy SovEcon forecasted Russian wheat production to decline to 77.0 MMT (2.83 billion bushels), down 10 percent from 2017/18.

UkrAgroConsult reported Ukrainian wheat planted area increased 2 percent year over year to 15.5 million acres (6.28 million hectares). The Ukrainian meteorological service expects wheat yields to fall 8 percent year over year to 56.5 bu/acre (3.80 MT/ha). 2018/19 Ukrainian wheat production is forecast at 23.9 MMT (878 million bushels), compared to 25.4 MMT (933 million bushels) in 2017/18.

IGC expects yield declines and smaller planted area will lower Kazakhstan wheat production to 13.7 MMT (503 million bushels), down 7 percent from 2017/18, if realized.

thumbnail

By Stephanie Bryant-Erdmann, USW Market Analyst

In its June World Agriculture Supply and Demand Estimates (WASDE), the U.S. Department of Agriculture (USDA) noted that global wheat consumption is expected to exceed global wheat production for the first time since 2012/13 (June 1 to May 31). USDA estimated 2018/19 global wheat consumption at a record 751 MMT, up 7.7 MMT from 2017/18. Human consumption is driving this growth and is expected to increase 2 percent or 10.5 MMT, which is good news for everyone involved in the milling wheat supply chain, including U.S. farmers who are uniquely positioned to meet the demand.


In 2018/19, the United States will hold the largest exportable supply of wheat in the world (production plus beginning stocks minus domestic consumption). USDA’s forecast for U.S. exportable supply of wheat is 49.7 MMT, accounting for 22 percent of world wheat exporter stocks. If realized, that is 8.2 MMT more than Russia and 13.9 MMT more than the European Union (EU).

This large exportable supply of high-quality milling wheat highlights the importance of trade to everyone’s bottom line. USDA projects world wheat trade to increase 2 percent from 2017/18 to a record high 187 MMT (6.88 billion bushels), and the United States is expected to have 14 percent market share by volume.

USDA predicts that total 2018/19 imports by most top U.S. wheat customers will remain stable year-over-year or increase slightly. Mexico, the top U.S. wheat importer the past two marketing years, is expected to increase total wheat imports by 8 percent year-over-year to 5.5 MMT. If realized that would be 14 percent above the 5-year average.

USDA expects Japan, the top U.S. customer over a 5-year period, will import an estimated total of 5.8 MMT, down 3 percent from 2017/18. Total wheat imports by both the Philippines and China will remain stable year-over-year at 5.8 MMT and 4.00 MMT, respectively. Nigerian imports are expected to grow year-over-year to 5.5 MMT, 17 percent from the 5-year average. Korean total wheat imports will increase 5 percent year-over-year to 4.6 MMT. USDA also expects Indonesia to import a record 12.5 MMT of wheat in 2018/19, up 4 percent from the year prior and 33 percent greater than the 5-year average.

The growth in total wheat imports in these countries is driven by increasing demand for high-quality wheat products. In the top 20 U.S. wheat markets, human wheat consumption is expected to increase about 3.6 MMT year-over-year with the largest increases noted in China and Indonesia.

Additionally, in those markets where the United States has a majority market share (greater than 50 percent), but that fall outside the top 20, such as Honduras, Costa Rica and Jamaica, human consumption is expected to grow an average 2 percent in 2018/19.

With wheat consumption driven by “sticky” food demand, the long-term outlook for global wheat demand is strong. The short-term outlook for demand is also pointing to higher prices for wheat with USDA expecting 2018/19 global wheat production to fall for the first time in 5 years due to forecast production declines in half of the major exporting countries. All of which is good news for U.S. farmers who are ready to meet the global demand for high-quality milling wheat.

To track U.S. wheat harvest, subscribe to the USW Weekly Harvest Report.

To track U.S. wheat export prices and stay updated on global wheat forecasts, subscribe to the USW Weekly Price Report.

thumbnail

By Stephanie Bryant-Erdmann, USW Market Analyst

Since the beginning of the calendar year, export cash prices for hard red winter (HRW) wheat prices have rallied an average 73 cents at the Gulf across all protein levels. However, export cash prices are made up of two components — wheat futures and export basis. Most of the export price rally matches the futures market, which climbed from $4.37 per bushel in January to $5.64 per bushel on May 25. However, U.S. Wheat Associates (USW) and the farmers it represents also face historically high rail rates that support the export basis.

The futures rally is based on two fundamental factors — drought in the U.S. HRW-growing area, which is shrinking the U.S. HRW supply, and concern about poor crop conditions around the world, which the market believes is increasing potential demand for U.S. HRW.

On May 10, USDA forecast global world wheat consumption to outpace global wheat production in 2018/19 for the first time since 2012/13 due to reduced production in Russia, Ukraine and Kazakhstan. The growing demand for wheat around the world and the expectation of smaller Black Sea supplies are pushing up U.S. export prices.

As of May 31, the U.S. Drought Monitor reported that the Oklahoma and Texas panhandles and 75 percent of Kansas are still in a moderate to exceptional drought. The corresponding wheat condition ratings reflect the effects: USDA rated 48 percent, 63 percent, and 54 percent of HRW in poor or very poor condition, respectively, in the region.

The market also expects the drought to help increase new crop HRW protein levels (although the data to support that expectation is not yet available). This has caused protein premiums and discounts to erode. In the Gulf, the protein premium for 12.0 percent protein (12 percent moisture basis) HRW over 11.5 percent protein (12 percent moisture basis) fell from an average $23 per MT ($0.64 per bushel) in January to $8 per MT ($0.21 cents per bushel) year to date in May (See “HRW Export Basis and Rail Rates”). Similarly, the average protein premium for 11.5 percent protein over 11.0 percent protein (12 percent moisture basis) fell an average ($0.35 per bushel) during the same time frame.

The declining protein premiums for HRW partially offset the futures rally, and export cash prices for 12.0 percent protein and 11.5 percent protein (12 percent moisture basis) HRW in the Gulf remain below the respective 5-year averages.

However, while the weather fundamentals are dominating the news, there is also a third factor that is quietly playing a role in U.S. export prices — increased U.S. rail rates. According to USDA/Agricultural Marketing Service Grain Transportation Report data, year-to-date in 2018, the average cost of railcar transportation for wheat from Kansas to the Gulf is $45 per MT ($1.21 per bushel). That is the highest level since USDA began tracking rail rates in 2010. Rail rates for wheat will increase to a new record high this summer according to notices that went out to customers in March and April.

Rail rates are a key component of export basis, which also includes elevation, barge freight and labor costs. Yet the cost of transporting wheat is shared by the farmer and the overseas customer through country elevator basis levels and export basis levels. Consequently, higher rail rates act as both a ceiling for farm gate prices and simultaneously as a floor for export prices.

On the export basis side, this can most easily be seen in the export basis levels for ordinary or unspecified protein wheat. Year-to-date in 2018, ordinary protein HRW export basis has averaged $42 per MT ($1.15 per bushel), compared to $27 per MT ($0.74 per bushel) in 2017, when the average rail rate from Kansas to the Gulf (See “HRW Export Basis and Rail Rates”) was $43 per MT ($1.18 per bushel).

As customers ride out the market volatility that always occurs this time of year, they should keep in mind that U.S. export basis levels are supported by increased transportation costs, and the 2018/19 global stocks to use ratio without China is forecast at a tight 20 percent as noted in the USW May 17 Wheat Letter article “Chinese Wheat Stocks Mask Tight Stocks to Use Ratio.”

thumbnail

By Stephanie Bryant-Erdmann, USW Market Analyst

With the small, stressed hard red winter (HRW) wheat crop getting the lion’s share of attention, it was an initial surprise to read in USDA’s May World Agricultural Supply and Demand Estimates (WASDE) that U.S. wheat production is expected to increase to 49.6 million metric tons (MMT) in 2018/19. That would be up 5 percent year over year, if realized.

The forecast increase is a result of greater harvested area and slightly higher average yield in the other classes. USDA forecast 2018/19 all wheat average yield at 46.8 bushels per acre (3.15 metric tons [MT] per hectare), up from 46.3 bushels per acre (3.11 MT per hectare) last year. Harvested area is expected to increase 1.3 million acres (526,000 hectares) in 2018/19. Crop condition ratings also matter in this forecast, and as the following by-class reviews show, HRW is clearly the exception to the up-trend in production.

HRW production is expected to be the smallest since 2006/07 at 17.6 MMT. If realized, that would be down 14 percent year over year and 22 percent below the 5-year average. Low farm-gate prices and poor planting weather last fall reduced 2018/19 U.S. HRW planted area to 23.2 million acres (9.4 million hectares), the second lowest planted area on record. That poor start coupled with widespread drought throughout the U.S. Southern Plains set up the current situation where harvested HRW acres are expected to fall 5 percent from 2017/18 to 16.5 million acres (6.68 million hectares).

The large decrease in harvested acres is centralized in the U.S. Southern Plains where HRW crop condition ratings remain poor. In top HRW-producing states of Kansas, Oklahoma and Texas, 51 percent, 65 percent, and 59 percent of HRW is rated poor or very poor, respectively. As a consequence of the drought and resulting poor crop conditions, USDA expects harvested area in Oklahoma to fall 31 percent year over year to 2.0 million acres (810,000 hectares). On May 10, USDA rated 25 percent of HRW in the states surveyed in good to excellent condition, while 45 percent is rated poor or very poor. Read more about the all too evident challenge of wheat farming on the High Plains.

Soft red winter (SRW) production is expected to increase to 8.57 MMT in 2018/19. If realized, that would be up 8 percent year over year, but still 22 percent below the 5-year average. 2018/19 U.S. SRW harvested area is expected to increase 8 percent from the year prior to 4.0 million acres (1.62 million hectares). USDA also expects record high yields in Indiana, Kentucky, Maryland and Michigan due to favorable growing conditions this spring.

On May 14, USDA noted week over week crop condition rating improvements in nearly all SRW-growing states, with 67 percent of the SRW acres surveyed rated good to excellent. Week over week improvements were noted in Illinois and Arkansas where 63 percent of SRW was rated good to excellent, up 10 percentage points and 5 percentage points, respectively, from the week prior.

White wheat.* 2018/19 white winter wheat production is forecast at 6.24 MMT, including 5.66 MMT of soft white (SW) winter wheat and 577,000 MT of hard white (HW) winter wheat. If realized, SW winter wheat production would be up 2 percent year over year, due to increased planted area, while HW winter wheat production would be down 11 percent from 2017/18 due to forecast reduction in average yield. SW winter wheat production is centralized in the Pacific Northwest (PNW) states of Idaho, Oregon and Washington. As of May 14, 71 percent of Idaho SW, 80 percent of Oregon SW and 85 percent of Washington SW was rated in good to excellent condition.

Desert Durum®. USDA expects Desert Durum® production — centralized in Arizona and California and planted in the winter — to total 332,000 MT, up 6 percent from 2017/18 due to significantly better yields in California. In Arizona, the Desert Durum® crop was 90 percent headed by April 29, significantly ahead of the year prior’s pace.

Spring wheat and Northern durum. Snow covered, frozen fields delayed spring wheat and Northern durum planting this year, but U.S. farmers are beginning to catch up. As of May 14, spring wheat and durum planting is 58 percent complete, up from just 30 percent complete the week prior, but still behind the 5-year average pace of 67 percent.

With spring planting still underway, USDA did not provide a by-class breakdown of production for hard red spring (HRS) and durum on May 10. However, USDA did note that combined spring wheat and Northern durum production is projected to increase 34 percent year over year due to “both increased area and yield.” With total U.S. wheat production projected at 49.6 MMT and U.S. winter wheat production projected at 32.4 MMT, that puts 2018/19 spring wheat — including soft white spring, HRS, and hard white spring — and durum production at 17.2 MMT.

Back on March 29, USDA projected U.S. HRS planted area at 12.1 million acres (4.9 million hectares). If farmers are able to realize their planting intentions despite the late start, that would be up 17 percent year over year. Northern durum planted area was forecast at 1.88 million acres (760,000 hectares), down 14 percent, if realized. Still, weather will play a role in farmers’ decisions, and a late spring in Montana and western North Dakota tends to favor increased wheat area. Conversely, it tends to favor increased corn and soybean acres in Minnesota.

To stay in touch with U.S. wheat harvest progress, subscribe to the U.S. Wheat Associates Weekly Harvest Reports, which will start later this month.

*In the May 10 report, USDA combined data for soft white winter wheat and hard white winter wheat. Both soft white (SW) and hard white (HW) can be grown in either the spring or fall. USDA will provide a wheat by-class outlook in July. Similarly, data for HRS, SW spring, HW spring and spring-planted durum were combined into a general “spring-planted wheat” category.

thumbnail

By Stephanie Bryant-Erdmann, USW Market Analyst

On May 10, USDA forecast the 2018/19 global wheat supply to hit a record 1,018 million metric tons (MMT) despite the expectation that global wheat production will fall for the first time in 5 years to 748 MMT.

At the same time that global wheat production is expected to decrease, global wheat consumption is expected to reach a new record of 754 MMT, 5 percent above the 5-year average.

The reason global wheat supplies continue to grow is because of an anticipated 6 percent year over year increase in beginning stocks — 47 percent of which are in China. This large percentage of global wheat stocks residing in China’s wheat stocks are masking an otherwise declining global wheat supply.

By the end of 2018/19, USDA expects Chinese ending stocks to total 139 MMT, 52 percent of global wheat ending stocks.

Because China’s endings stocks are masking the declining global wheat supply, the traditional stocks-to-use ratio is 35 percent.

However, when Chinese stocks and use are removed from the ratio, the 2018/19 global stocks-to-use ratio falls sharply to 20 percent, the tightest stocks-to-use ratio since 2007/08.

Buyers should continue to monitor conditions around the world and recognize that global wheat supplies are much tighter than traditional global supply and demand estimates show.

View the U.S. Wheat Associates full 2018 May World Wheat Supply and Demand Situation Graphic Summary.

thumbnail

By Stephanie Bryant-Erdmann, USW Market Analyst

This week I joined the annual Wheat Quality Council (WQC) Hard Red Wheat (HRW) Tour for an early survey of the new crop. Each year, participants gather in Manhattan, Kan., and spend the next two and a half days in small scout teams, randomly stopping at 14 or more fields in a full day along the same routes followed for many years. The teams measure yield potential, determine an average for the route and estimate a cumulative average for the day when all the scouts come together in the evening. Last year, tour participants faced snow and muddy fields. This year, the snow is a distant memory, as fields on days one and two were all bone dry. A violent storm rolled through central Kansas on Day 2, which cut some scouting short, but brought much needed moisture to the wheat fields.

Just a few hours before U.S. Wheat Associates (USW) published this issue of “Wheat Letter,” the tour estimated a final average yield potential of 37.0 bushels per acre (bu/ac) or about 2.49 metric tons (MT) per hectare for the 2018/19 Kansas HRW crop. This year, the tour participants made 644 stops to scout fields. Combining seeded area with per-acre yield potential, the total production potential estimate was 243.0 million bushels [(6.61 million metric tons (MMT)]. Last year’s total production estimate was 282 million bushels (7.67 MMT).

On the first day, the tour traveled from Manhattan along several routes covering most northern Kansas counties. The cumulative Day 1 average yield potential was 38.2 bu/ac, which is equivalent to about 2.57 MT per hectare, compared to 43.0 bu/ac (2.89 MT per hectare) in 2017. To reach that average, participants surveyed a record 317 fields recording a range from a low of 17 bu/ac to a high of 93 bu/ac. We saw very short wheat that was two to four weeks behind developmentally. Fields were very dry, which has prevented disease establishment, but threatens yield potential.

Participants also received a report on the Nebraska and Colorado wheat crops. Nebraska estimated an average 43.0 bu/ac (2.89 MT per hectare) for a total production estimate of 43.7 million bushels (1.19 MMT), down roughly 7 percent from last year’s tour estimate. Colorado estimated an average of 35.0 bu/ac (2.35 MT per hectare) with total production estimated at 70 million bushels (1.90 MMT), down 19 percent year-over-year, if realized.

On the second day, the tour traveled on routes that led from the city of Colby to Wichita, making 284 stops. The number of observations was up significantly from last year due to much better field conditions this year, though severe weather including tornados and hail, did cut some scouting short. Scouts reported most wheat was one to two weeks behind normal development, but continued to see very little disease pressure. This year, the tour estimated Day 2 average yield at 35.2 bu/ac (2.37 MT per hectare), for a combined two-day average of 36.8 bu/ac (2.47 MT per hectare) across 601 stops. Last year, the combined two-day average was 44.9 bu/ac (3.02 MT per hectare) on 427 stops.

Participants also received a crop report from Oklahoma, where drought conditions severely impacted the panhandle of the state which received less than 0.1 inch (less than 0.5 cm) of rain between September and mid-February. The estimated average yield in Oklahoma is 24.8 bu/ac (1.67 MT per hectare), for a total production estimate of 54.8 million bushels or about 1.49 MMT. If realized, that would be down 44 percent year over year. With decreased yield potential, many farmers have chosen to graze out the wheat fields to feed hungry cattle whose pasture has been impacted by the drought as well. As a consequence, harvested area in Oklahoma is expected to be sharply lower in 2018/19.

The third and final day of the tour was shorter, with each car making three to four field stops on the way from Wichita to Manhattan for the final report. The Day 3 estimated average yield was 39.8 bu/ac, (2.67 MT per hectare) across 43 stops.

View highlights and photos from the tour by searching #wheattour18 on Facebook and Twitter. The WQC also sponsors a spring wheat tour in the Northern Plains in July. For more information, visit the Council’s web site at https://www.wheatqualitycouncil.org.

thumbnail

By Stephanie Bryant-Erdmann, USW Market Analyst

At first glance, the USDA April 10 World Agricultural Supply and Demand Estimates (WASDE) held very few surprises for wheat. Most reviewers would consider this a bearish report with another increase in predicted U.S. and global wheat ending stocks. However, a somewhat unnoticed factor was increased global wheat feed use, now forecast at 146 million metric tons (MMT), 7 percent above the 5-year average. This was due largely to shrinking supplies of traditional feed grains. With an average 19 percent of global wheat production being used as feed each year, the current feed grain supply and demand situation has implications for wheat.

A deeper look at the feed grain situation shows the most striking decrease was in global corn production, which fell 4 percent year over year to 1.04 billion metric tons due to sharply lower production in drought-stricken Argentina and lower second-crop corn production in Brazil. At the same time, 2017/18 corn feed demand grew 18.0 MMT. These facts set up a total stocks-to-use ratio of 19 percent. However, it is important to note that China holds 40 percent of the world’s corn stocks, which will not leave the country.  Removing China from the equation brings the stocks-to-use ratio down to 14 percent.

The constrained corn supply caused USDA to reduce global corn feed demand by 4 MMT from the prior month’s estimate of 654 MMT. In addition to reduced corn feed use in Argentina, USDA noted decreased corn feed demand in the European Union (EU) with a corresponding increase in wheat feed demand. EU 2017/18 wheat feed use is expected to reach 58.5 MMT, 9 percent above the 5-year average, if realized.

While corn had the most precipitous drop in supply and increase in demand, global production of barley, millet, oats and sorghum also fell in 2017/18, while rye remained stable year over year. Including corn, global feed grain production fell 4 percent or 49.9 MMT year over year in 2017/18, while global feed grain consumption increased 15.1 MMT. The increased consumption and decreased supply of traditional feed grains will cut 2017/18 ending stocks for those grains by 38.8 MMT.

With the global feed grain supply tightening, prices for those commodities continue to rise. Since the beginning of 2018, world feed barley prices increased an average $19 per metric ton (MT), global sorghum prices averaged a $15/MT increase, and the average world corn price increased $26 per MT, according to International Grain Council (IGC) data. Supported by increased feed wheat demand, global wheat prices also increased an average $9 per MT.

With feed grain prices increasing, farmers around the world have taken notice and are expected to plant more corn, barley and sorghum in 2018/19 — at the expense of wheat.

IGC expects 2018/19 global wheat harvested area to fall to a six-year low of 538 million acres (218 million hectares), down 1 percent from 2017/18 levels. The analyst group expects generally favorable Northern Hemisphere weather to increase global yields and partially offset the reduced planted area. Still, IGC currently forecasts 2018/19 global wheat production to fall 17 MMT year over year to 741 MMT.

Weather news is dominating the futures markets right now, but customers should be mindful of the feed grain situation, which is slowly siphoning some of the world’s excess wheat stocks in 2017/18 and switching wheat planted area to feed grains.

To track U.S. wheat prices, please subscribe to the U.S. Wheat Associates (USW) Weekly Price Report.

thumbnail

By Stephanie Bryant-Erdmann, USW Market Analyst

Every year USW sends board teams overseas to give leading U.S. wheat farmers the opportunity to learn from customers about the wheat quality characteristics their markets prioritize, and to strengthen the relationship between wheat farmers and their customers. One of those teams returned from a trip to Asian countries in mid-March.

The 2018 Asia Board Team, led by USW Market Analyst, Stephanie Bryant-Erdmann, traveled to China and Taiwan. The team included: Mike Carstensen, a wheat farmer from Almira, Wash., and a current USW director representing the Washington Grain Commission; Clark Hamilton, a wheat farmer from Ririe, Ida., and a current USW director representing the Idaho Wheat Commission; Gordon Stoner, a wheat farmer from Outlook, Mont., and the past president of the National Association of Wheat Growers (NAWG), and Scott Swenson, a wheat farmer from Elbow Lake, Minn., and Treasurer of the Minnesota Wheat Research and Promotion Council.

In Qingdao, China, the team met with traders, millers and bakers who provided a unique perspective on the processing and marketing sectors of the wheat value chain. They also toured retail bakeries where they sampled traditional Chinese baked goods and visited an instant noodle and puff snack factory. The team was impressed with the freshness, variety and quality of the products and were particularly fond of a chocolate bread with mango filling. The team learned that stability time, water absorption, protein and color are especially important to the Chinese baking industry.

“At each meeting, the team heard how Chinese millers use U.S. wheat to improve flour products to meet customer demands. In return, team members shared information about the research programs in the United States and the focus on improving quality through the adoption of preferred variety lists,” said Bryant-Erdmann. “The message to customers was U.S. wheat farmers are committed to producing a high-quality product that meets their customer needs.”

U.S. wheat faces several challenges in China, including perennial trade policy issues and strong competition from Canada. U.S. soft wheat represents a good opportunity for continued growth in a market that is growing in sophistication both from the consumer side and from the milling and end-product manufacturing side.

In Taiwan, the team met with the Taiwanese Flour Millers Association, where they learned more about the high-quality Taiwan flour market. Carstensen, Hamilton, Stoner and Swenson each spoke about current growing and planting conditions on their farms and provided an early outlook for the 2018/19 wheat crop — noting that weather would play a big role in final planting decisions, yields and production. Stoner also gave the group a U.S. farm bill update, highlighting the importance of the various programs to U.S. farmers and their customers.

As a first-time board team traveler, Mike Carstensen said “the opportunity to meet with customers and learn more about their business is invaluable. The feedback on wheat quality characteristics is important for us to hear and bring back to share with our wheat breeders.”

Customers in both countries also expressed interest in buying hard white (HW) wheat. Hamilton was able to share his perception of the challenges and opportunities facing U.S. HW production and marketing.

The team also toured Taiwanese wheat food manufacturing plants, retail bakeries and a flour mill with the representatives from the American Institute of Taiwan and the U.S. Agricultural Trade Office. One highlight was visiting the Chimei showcase bakery and trying traditional Taiwanese pineapple cake. Swenson was impressed with the wide range of products, some of which are available in the United States.

“The world is a small place and maintaining the strong relationship between the U.S. wheat farmer and their overseas customers is crucial to the continued success of both,” he said.

U.S. wheat enjoys a strong loyalty from its Taiwanese customers, with the strongest competition coming from containerized shipments of Australian wheat. Improving U.S. logistics for containerized wheat was a long-term concern the team identified and plans to share with their fellow commission members.

The team will report to the USW board later this year. To see pictures from the trip please visit the USW Facebook page at www.facebook/uswheat.