thumbnail

By Stephanie Bryant-Erdmann, USW Market Analyst

With wheat harvest underway in the Northern Hemisphere and wheat planting underway or complete in the Southern Hemisphere, wheat buyers are beginning to see a downward trend in production numbers. As discussed in the June 15 Wheat Letter, the high quality, high protein wheat supply is shrinking and supporting prices. USDA expects global output to decrease for the first time in five years to 739 million metric tons (MMT) (27.2 billion bushels), down 14.6 MMT (535 million bushels) from the 2016/17 record of 754 MMT (27.7 billion bushels). If realized, production would be 3 percent above the five-year average. In this issue, we summarize current expectations and conditions in the world’s major wheat exporting countries, which account for 90 percent of all world wheat exports.

Argentina. In June, Bolsa de Cereales, the Buenos Aires Grain Exchange, reported Argentine farmers will plant 17 percent more wheat acres in 2017/18 as wheat production continues to expand under President Macri’s favorable policies. Bolsa estimated wheat planted area at 13.6 million acres (5.5 million hectares). On June 22, 53 percent was planted, up from 37 percent the prior week. USDA’s July estimate for 2017/18 Argentinian wheat production was 17.5 MMT (643 million bushels), up 3 percent from 2016/17 and 41 percent greater than the five-year average.

Australia. In its June report, the Australian Bureau of Agricultural and Resource Economics and Science (ABARES) forecasted 2017/18 production at 24.2 MMT (889 million bushels). That is 31 percent below 2016/17, due to an expected 25 percent reduction in average yield and a slight decline in planted area from 2016 to 31.4 million acres (12.7 million hectares). Autumn rainfall was below normal in Western Australia and variable across South Australia, states that account for roughly half of Australia’s winter crop planted acres and production. The Australian Bureau of Meteorology expects drier than average conditions across wheat producing regions during the next three months.

Black Sea. Winter wheat harvest is underway and USDA projects combined 2017/18 output from Russia, Ukraine and Kazakhstan will decrease 6 percent to 107 MMT (3.93 billion bushels) based on an expected return to trendline yields. If realized, the combined harvest would still be greater than the five-year average. Russian consultancy SovEcon pegged Russian planted wheat area at 68.9 million acres (27.9 million hectares), down slightly from 2016/17 due to a 4 percent decrease in spring wheat area. Russian wheat production is expected to decline to 70.4 MMT (2.59 billion bushels), down 3 percent from 2016/17 due to the smaller planted area and anticipated lower yields. SovEcon forecast Russian winter wheat yields at 52.1 bu/acre (3.50 MT/ha), down from 55.5 bu/acre (3.73 MT/ha) in 2016/17. Spring wheat yields are expected to fall 7 percent year over year to 21.1 bu/acre (1.42 MT/ha). UkrAgroConsult reported Ukrainian wheat planted area decreased slightly year over year to 15.6 million acres (6.30 million hectares), and expects yields to fall 7 percent year over year to 58.2 bu/acre (3.91 MT/ha). 2017/18 Ukrainian wheat production is forecast at 24.5 MMT (900 million bushels), compared to 26.1 MMT (959 million bushels) in 2016/17. UkrAgroConsult noted yield declines and a 3 percent smaller planted area will lower Kazakhstan wheat production to 13.7 MMT (503 million bushels), down 9 percent from 2016/17, if realized.

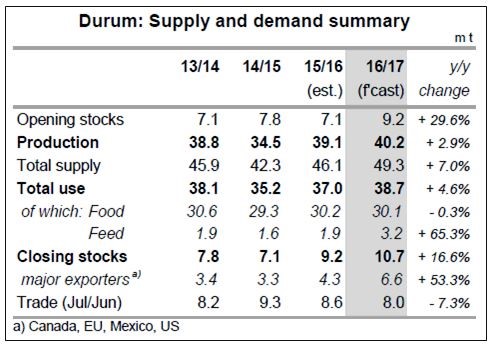
Canada. Agriculture and Agri-Food Canada (AAFC) expects wheat production of 29.5 MMT (1.08 billion bushels) in 2017/18. That is down 7 percent year over year because average yield is expected to decline to 47.6 bu/acre (3.20 MT/ha) in 2017/18. Slightly higher planted area will partially offset expected yield declines. StatsCan put planted area at 22.4 million acres (9.07 million hectares) of wheat in 2017/18. Spring wheat planted area rose 2 percent to 15.8 million acres (6.39 million hectares) due to low carry-in stocks and increased price competitiveness with alternative crops. Durum planted area decreased 16 percent year over year to 5.2 million acres (2.11 million hectares) due to high carry-in stocks and lower prices. Canada’s winter wheat seeding decreased 16 percent year over year from a shift to spring wheat. Crop conditions this year are variable with excessive moisture in northern areas while southern areas remain dry. As of June 23, topsoil moisture in Saskatchewan was rated 18 percent short or very short compared to 40 percent short or very short last week. In Alberta, 84 percent of spring wheat is rated in good to excellent condition compared to 83 percent last year. Surface soil moisture is rated 79 percent good to excellent; 14 percent of surface soil moisture is rated excessive. Saskatchewan and Alberta account for roughly 82 percent of 2017/18 planted wheat acres.

European Union. After a challenging 2016/17, Strategie Grains expects EU common wheat production will rebound 4 percent to 142 MMT (5.20 billion bushels) in 2017/18 with a 5 percent increase in yield expected to offset a 1 percent decrease in planted area. French production is expected to increase 7.66 MMT (281 million bushels) year over year to 35.6 MMT (1.31 billion bushels) — a 33 percent improvement in yields. Precipitation across France is 25 percent below normal since March, however. The French crop bureau FranceAgriMer rated 68 percent of French soft wheat in good or excellent condition, down from 74 good to excellent percent the prior week. Dry conditions are also threatening yield potential in Austria, Germany, Italy and Poland. In Spain, drought conditions are expected to cut wheat production by 32 percent year over year to 4.72 MMT (173 million bushels). Additionally, the EU’s crop monitoring service MARS reduced its forecasts for wheat yields to 87.2 bu/acre (5.86 MT/ha), from 87.9 bu/acre (5.91 MT/ha) in May, but greater than the five-year average of 86.7 bu/acre (5.84 MT/ha). Weather forecasts for early July provide little relief for EU farmers, which could further threaten yield potential.

United States. USDA forecast U.S. 2017/18 wheat production at 49.6 MMT (1.82 billion bushels), down 21 percent year over year and 15 percent below the five-year average due to an anticipated 10 percent decline in average yield and the lowest number of planted acres since USDA records began in 1919. USDA expects the average yield to be (3.18 MT/ha) compared to the five-year average of (3.14 MT/ha). In the March 31 Prospective Plantings report, USDA reported U.S. farmers intended to plant 46.1 million acres (18.7 million hectares) of wheat for 2017/18.

USDA will update planted area estimates June 30. The first U.S. by-class estimates will be released in the July 12 World Agricultural Supply and Demand Estimates (WASDE) report.

Follow #wheatharvest17 on Twitter for the latest harvest photos and conditions.

Subscribe to USW Weekly Harvest Reports. To read the latest report, click here.

thumbnail

By Stephanie Bryant-Erdmann, USW Market Analyst

Much needed rain across the U.S. Northern Plains this week gave emerging hard red spring (HRS) and durum crops a drink, but the rain was bookended by hot, windy conditions and likely did little to alleviate drought conditions.

Total rainfall for the region ran 60 to 75 percent below average for three months before this week’s storms, with Minot, ND — in the heart of the HRS growing area — recording just 1.23 inches (3 cm of rain) since March. The June 13 U.S. Drought Monitor showed 83 percent of North Dakota is in a moderate or severe drought and the remainder of the state is abnormally dry. Similarly, 79 percent of South Dakota and the eastern third of Montana are abnormally dry or in a moderate to severe drought.

The lack of rain and above normal temperatures is taking an early toll on crop conditions. On June 13, USDA reported 45 percent of spring wheat was in good to excellent condition, down 10 percentage points from the prior week and the lowest rating on record for that week. USDA noted 20 percent of the spring wheat crop was in poor or very poor condition, up from 11 percent the prior week and just 2 percent at the same time last year. Markets will be closely watching next week’s USDA crop condition report, and further deterioration of crop conditions will support Minneapolis Grain Exchange (MGEX) HRS wheat futures.

In the past two weeks, the nearby MGEX HRS wheat futures contract rallied 8 percent or 49 cents to $6.28 per bushel, the highest level since December 2014. Concern about the HRS crop and early harvest reports of low protein hard red winter (HRW) also support widening HRW protein premiums. Last June, the protein premium for 12.0 percent protein HRW (on a 12 percent moisture basis) averaged 12 cents per bushel ($4.59 per metric ton) over 11.0 percent protein HRW. This year, the same premium is 60 cents per bushel ($22 per metric ton).

With 60 percent of high protein wheat exports (13 percent protein on a 12 percent moisture basis or higher) originating from the United States and Canada, protein premiums are also widening due to Canadian crop and soil moisture conditions. In Saskatchewan, where Canadian farmers are wrapping up spring planting, topsoil moisture is rated 40 percent short or very short compared to 8 percent short or very short last year.

Farmers in northern Alberta and Saskatchewan are having the opposite problem — too much moisture. On June 6, the Alberta crop report rated topsoil moisture at 29 percent excessive in the Northeast and 40 percent excessive in the Northwest. Wet fields and harvesting 1.16 million acres (2.86 million hectares) of overwintered crops delayed spring planting progress in the province. Spring wheat planting was 95 percent complete on June 6, up from 84 percent the prior week but behind the 5-year average of 98 percent complete. Agriculture and Agri-Food Canada estimated total Canadian wheat production for 2017/18 will be 29.5 million metric tons (MMT), down 7 percent year over year due to a slight decline in planted area and a return to trendline yields.

“Conditions are variable right now with too much water in many northern areas, too little in the southern areas and probably very good conditions in between the two,” noted Robin Speer Executive Director of Western Canadian Wheat Growers Association. “We think the next two weeks become very important for this crop.”

Though HRS planted area is expected to be 7 percent smaller this year and yield potential for this year’s HRS crop is still unknown, U.S. farmers will continue to have the high quality, high protein wheat the world needs. In its June World Agricultural Supply and Demand Estimate, USDA pegged 2016/17 HRS ending stocks at 5.86 MMT, slightly more than the 5-year average of 5.28 MMT. The larger than normal ending stocks ensure the U.S. wheat store will always be open; the only unknown is how much customers will need to pay.

To read the latest USW Weekly Harvest report, click here.

Harvest Report

By Stephanie Bryant-Erdmann, USW Market Analyst

Combines are beginning to roll for winter wheat harvest in the United States with highly variable wheat and field conditions. The U.S. National Weather Service reported that in May much of the U.S. Plains region received 1.5 to 3 times more rain than normal. On Tuesday, May 30, USDA rated 50 percent of the winter wheat crop in good to excellent condition, down 2 percentage points from the prior week; 15 percent of the crop was rated in poor or very poor condition. The following is a summary of harvest progress, crop conditions, field conditions and planted area by state.

Colorado. Growing conditions across Colorado have been highly variable this year with some parts of the state experiencing very favorable conditions and others quite the opposite. The late April snowstorm dumped snow across eastern Colorado, albeit on less mature wheat. Parts of the state have also been hit by severe storms and hail in the last two weeks, with damage still being assessed. Farmers noted crop development is 7 to 10 days ahead of normal across the state. On May 30, USDA rated 50 percent of Colorado winter wheat in good to excellent condition compared to 43 percent the prior week; 16 percent of the crop is in poor or very poor condition. USDA reported 70 percent of Colorado wheat is headed, behind the 5-year average of 61 percent. Colorado farmers planted 891,000 hectares (2.20 million acres) of wheat last fall, down 6 percent from 2015. USDA expects winter wheat production to fall to 1.96 million metric tons (MMT), or 72.1 million bushels, down an estimated 31 percent from the prior year.

Kansas. Kansas Wheat CEO Justin Gilpin reports that the extent of damage from the May snowstorm that dropped as much as 22 inches (54 cm) of snow on western Kansas will depend largely on planting date, maturity and varieties. Since that storm, Kansas has continued to receive excessive rain leading to standing water in fields and increased disease pressure. On May 30, USDA rated 45 percent of winter wheat as good to excellent compared to 47 percent the prior week; 25 percent of Kansas wheat is rated poor or very poor. Kansas wheat is 97 percent headed, ahead of the 5-year average of 93 percent. Last fall, Kansas planted 3.00 million hectares (7.40 million acres), down 13 percent year over year and the lowest planted area in 60 years. USDA expects Kansas to produce 7.89 MMT (290 million bushels) in 2017/18, down 38 percent from last year.

Montana. Montana farmers noted good stands of wheat, but soil moisture conditions are variable across the state. USDA rated topsoil moisture supplies at 34 percent short or very short, 62 percent adequate and 4 percent surplus, compared to 17 percent short or very short, 72 percent adequate and 11 percent surplus last year on the same date. On May 30, USDA rated 48 percent of Montana winter wheat in good to excellent condition compared to 52 percent the week prior. Montana wheat has not yet started to head, which is behind the 5-year average pace of 5 percent headed. Farmers planted 770,000 hectares (1.90 million acres) of wheat in 2016, down 16 percent from 2015 due to wet field conditions and strong price competition from peas and lentils. USDA expects Montana to produce 2.22 MMT (81.6 million bushels), down 23 percent from 2016/17.

Nebraska. Farmers report that a cool, wet spring is increasing disease pressure across the state. They also noted abandonment of some fields after a late spring freeze badly hurt yield potential. USDA rated 47 percent of Nebraska winter wheat in good to excellent condition on May 30, up slightly from the prior week. Winter wheat is 86 percent headed, compared to the 5-year average of 55 percent on the same date. Nebraska farmers planted 441,000 hectares (1.09 million acres) of wheat in 2016, down 20 percent from 2015 and the lowest planted area on record for Nebraska. USDA expects Nebraska winter wheat production to total 1.4 MMT (51.5 million bushels), down an estimated 27 percent from the prior year.

Oklahoma. Harvest is underway in Oklahoma, though storms are causing some delays. Many of the recent storms included damaging hail and farmers are concerned about getting the wheat safely into the bin. USDA rated 45 percent of Oklahoma winter wheat in good to excellent condition on May 30, compared to 49 percent the week prior; 14 percent of the crop is in poor or very poor condition. USDA reported wheat harvest in Oklahoma is 3 percent complete, behind the 5-year average of 10 percent complete on the same date. Oklahoma farmers planted 1.82 million hectares (4.50 million acres) of wheat in 2016, down 10 percent from the year prior because late-season rain prevented some wheat planting. USDA expects Oklahoma winter wheat production to fall to 2.42 MMT (89.1 million bushels), down 35 percent year over year.

South Dakota. Temperatures fell below freezing last week in South Dakota, though the damage has not yet been assessed. Topsoil moisture is rated as 56 percent adequate, compared to 82 percent adequate last year, with subsoil moisture rated as 39 percent short to very short and 58 percent adequate. USDA rated 50 percent of South Dakota winter wheat in good to excellent condition compared to 54 percent last week; 20 percent of South Dakota winter wheat is in poor or very poor condition. Winter wheat is 32 percent headed in the state, on par with the 5-year average. South Dakota farmers planted 364,000 hectares (900,000 acres) of winter wheat, down 24 percent year over year. USDA expects South Dakota winter wheat production to decline to 1.19 MMT (43.7 million bushels), down 32 percent year over year.

Texas. Harvest started two to three weeks ahead of average in Texas and, as in Oklahoma, severe storms and hail threaten the crop. As of May 30, harvest is 22 percent complete, ahead of the 5-year average of 15 percent complete. Last fall, Texas farmers planted 1.82 million hectares (4.50 million acres) of wheat, down 10 percent from the year prior in very dry field conditions. In the past two years, Texas planted wheat area has dropped by 20 percent. USDA expects Texas wheat production to total 1.88 MMT (69.0 million bushels), down 23 percent from 2016/17. On May 30, USDA rated 31 percent of Texas winter wheat in good to excellent condition compared to 36 percent the week prior; 17 percent of the Texas crop is in poor or very poor condition.

Soft Red Winter (SRW) Conditions. Harvest is underway in the mid-South (13 percent of SRW wheat has been harvested in Arkansas). Crop conditions are generally good. However, recent rainy, cool conditions from the mid-South through the Midwest, Mid-Atlantic and Southeast have slowed maturity. In Ohio, Extension workers reported that the crop would benefit from drier and warmer weather. A poor price outlook compared to alternate crops has SRW planted area on a steady decline. USDA calculates SRW planted area at 2.24 million hectares (5.53 million acres) for 2017/18.

To track harvest progress, subscribe to the USW Weekly Harvest report.

To read the latest USW Weekly Harvest report, click here.

thumbnail

By Stephanie Bryant-Erdmann, USW Market Analyst

While markets focused on USDA’s latest global supply and demand values, a deeper look provides perspective for wheat buyers. Breaking the supply values down into three categories — importer, exporter and China — shows some interesting trends. USDA expects world wheat supply in 2017/18 to fall 2 million metric tons (MMT) year over year to 993 MMT due to a 2 percent decline in its estimated production of 738 MMT. If realized, it would be the first production decline since 2012/13. The anticipated decrease in exporter and importer supplies will be larger, but that decrease is masked by estimated increases for China. Removing China’s 2017/18 projected beginning stocks and production from global wheat supply reveals an 18.2 MMT or approximately 2 percent decline in global supplies.

Importing countries. Ending stocks in major wheat importing countries for 2016/17 — soon to be 2017/18 beginning stocks — are expected to fall to a 6-year low of 68.0 MMT. Production in the importing countries is expected to increase 5 percent year over year, lifted by a 10 MMT increase in India after two poor crops there. Total importing country supplies are expected to remain stable at 300 MMT, with beginning stocks falling and production increasing only marginally in importing countries. However, it should be noted that 107 MMT, roughly 35 percent, of that supply will remain in India.

Exporting countries. USDA forecasts supplies in the top wheat exporting countries of Argentina, Australia, Canada, the European Union (EU), Kazakhstan, Russia, Ukraine and the United States to decrease by 4 percent or roughly 19 MMT year over year to 451 MMT. A 10.5 MMT year over year increase in exporter beginning stocks partially offsets the anticipated 7 percent decrease in production. Of the major eight exporters, only the EU and Argentina expect to see increases compared to last year.

China. USDA expects Chinese beginning stocks to climb to 111 MMT, up 14 percent over 2016/17. If realized, China will hold 43 percent of 2017/18 total global wheat beginning stocks. Chinese wheat production is also expected to rise in 2017/18 to 131 MMT, up 2.15 MMT from 2016/17, yet Chinese wheat consumption is expected to decline 2 percent to 116 MMT due to an anticipated decrease in wheat feeding. With supply up and consumption down, 2017/18 Chinese ending stocks are expected to grow to 128 MMT, up 15 percent from last year and a new record. If realized, Chinese ending stocks would account for 49 percent of all global wheat ending stocks for 2017/18.

Global supply and demand estimates give broad perspective for purchasing decisions, but customers should take care to remove Chinese stocks from the equations because the entire volume will stay in China. Thus, China’s ending stocks skew the total global stocks-to-use ratio higher to 35 percent. Without China, the global ratio would be 21 percent.

Buyers should also note that USDA’s first estimates for 2017/18 wheat production use trendline yields and average harvested area. As last year demonstrated, weather can significantly affect yield potential, abandoned acres, quality and total production. For example, the actual effect of the late April freeze and snow, as well as increasing plant disease pressure, on hard red winter (HRW) production and quality will not be revealed until harvest. Buyers should continue to monitor conditions around the world, and recognize that global wheat supplies are much tighter than traditional global supply and demand estimates show.

To keep up to date on the 2017/18 U.S. wheat harvest and initial quality analysis, it is easy to subscribe to USW Weekly Harvest Reports. To read the first report, click here.

thumbnail

By Stephanie Bryant-Erdmann, USW Market Analyst

This week I joined the annual Wheat Quality Council (WQC) “Hard Red Wheat Tour” for an early survey of the new crop. Each year, participants gather in Manhattan, KS, and spend the next two and a half days in small team, randomly stopping at 14, 15 or more fields in a full day along the same routes followed for many years. The scout teams measure yield potential, determine an average for the route and estimate a cumulative average for the day when all the scouts come together in the evening.

Just a few hours before USW published this issue of “Wheat Letter,” the tour estimated a final average yield potential of 46.1 bushels per acre (bu/ac) or about 3.10 metric tons per hectare for the 2017/18 Kansas hard red winter (HRW) crop. This year the tour participants made 469 stops to scout fields. Combining seeded area with per-acre yield potential, the total production potential estimate was 282.0 million bushels (7.67 million MT). Last year’s total production estimate was 382.4 million bushels (10.4 MMT). Sampling this year was skewed toward central and eastern Kansas due to difficulties sampling in the west.

On the first day, the tour traveled from Manhattan along several routes covering most northern Kansas counties. The cumulative Day 1 average yield potential was 43.0 bu/ac, which is equivalent to about 2.89 MT per hectare, compared to 47.1 bu/ac (3.16 MT per hectare) in 2016. To reach that average, participants surveyed 222 fields recording a range from a low of 18 bu/ac to a high of 96 bu/ac. We saw moderate pressure from stripe rust, a fungal disease, as well as viral diseases wheat streak mosaic and barley yellow dwarf. Many farmers were having fungicide applied by air to protect against fungal diseases, but there is no input to check viral disease.

Participants also received a report on the Nebraska and Colorado wheat crops. Nebraska estimated an average 40.0 bu/ac (2.69 MT per hectare) for a total production estimate of 41.8 million bushels (1.14 MMT), down roughly 41 percent from last year’s tour estimate. Colorado estimated an average of 31.6 bu/ac (2.12 MT per hectare) with total production estimated at 69.5 million bushels.

On the second day, the tour traveled on routes that led from the city of Colby to Wichita, making 202 stops. The number of observations was down significantly this year due to the challenging field conditions found in the western third of the state where wet, heavy snow continued to blanket wheat fields. After digging the wheat out of the snow, scouts noted the combination of heavy snow and accompanying 50 to 60 mile per hour winds had laid substantial portions of the wheat down and in some instances had broken the wheat stems. Wheat that was knocked over by the heavy snow, then endured several days of cold temperatures.

Standing water in fields and flooded ditches made field evaluation difficult in the south central part of the state where lodging and some freeze damage was also noted. Wheat streak mosaic was prevalent on Day 2, and participants reported seeing barley yellow dwarf, leaf rust and stripe rust. This year the tour estimated Day 2 average yield at 46.9 bu/ac (3.15 MT per hectare), for a combined two-day average of 44.9 bu/ac (3.02 MT per hectare) across 427 stops. Last year, the Day 2 average was 49.3 bu/ac (3.31 MT per hectare) and the combined two-day average was 48.2 bu/ac (3.24 MT per hectare).

A word of caution to our overseas customers is prudent. The wind, snow and cold events this year are unprecedented. Participants in the tour did the best they could to evaluate the western Kansas crop, but Dr. Romulo Lollato, Assistant Professor, Wheat and Forages Production, Kansas State University told us the most accurate assessment of the storm and freeze will not be possible for 10 to 14 days after each event. “High Plains Journal” magazine is reporting from the Tour and provides more details on Day 2 activities here. Kansas Wheat published additional information here.

Participants also received a crop report from Oklahoma, where drought conditions severely impacted the southern half of the state which received one inch (2.5 cm) of rain between September and mid-February. The northern half of the state benefited from the recent rainfall. The estimated average yield in Oklahoma is 33.7 bu/ac (2.26 MT per hectare), for a total production estimate of 100 million bushels or about 2.72 MMT. If realized, that would be down 27 percent year over year. The crop development is well ahead of normal with farmers expecting to start harvest in the next three weeks.

The third and final day of the tour was shorter, with each car making 3 to 4 field stops on the way from Wichita back to Manhattan for the final report. The Day 3 estimated average yield was 58.3 bu/ac, (3.92 MT per hectare) across 49 stops.

View highlights and photos from the tour by searching #wheattour17 on Facebook and Twitter. The WQC also sponsors a spring wheat tour in the Northern Plains in July. For more information, visit the Council’s web site at https://www.wheatqualitycouncil.org.


thumbnail

By Stephanie Bryant-Erdmann, USW Market Analyst

On April 11, USDA released its latest World Agricultural Supply and Demand Estimates (WASDE) report. With six weeks left in marketing year 2016/17, USDA expects wheat world ending stocks to reach a record high 252 million metric tons (MMT), up 4 percent year over year and 22 percent ahead of the 5-year average, if realized. The current marketing year factors in this report are well defined and the record large ending stocks are neither surprising nor new to those who follow the wheat industry. However, the position of those stocks has been quietly changing.

Historically, global wheat exporters — Argentina, Australia, Canada, the European Union (EU), Kazakhstan, Russia, Ukraine and the United States — have held roughly 30 percent of global ending stocks. China has historically held one third of global endings stocks and the mostly net importers that remain have held about 37 percent. The 5-year average breaks out with exporter stocks at 61 MMT, China holding roughly 70 MMT and the world’s importers carrying out about 75 MMT

However, USDA expects that ratio to shift at the end of 2016/17. Chinese ending stocks are expected to reach a record high 111 MMT, or 44 percent of global ending stocks. In global wheat exporting countries, ending stocks are also expected to grow slightly to 74.0 MMT, but the ratio will fall to about 29 percent of global ending stocks. Carryout stocks in the world’s wheat importing countries are expected to fall 16 percent year over year to 67.1 MMT. If realized, that would be 11 percent below the 5-year average and 27 percent of global ending stocks, down 10 percentage points from the 5-year average.

This decrease is due in large part to a shift in purchasing behavior. Four consecutive record production years have enticed many buyers to adopt a “just-in-time” approach to take advantage of the lower prices and reduce storage costs where possible. That is why ending stocks in the top 20 markets for U.S. wheat (excluding China) are expected to cover just over two months of consumption, 6 percent below the 5-year average.

Additionally, 28 countries (including the EU, the world’s largest wheat consumer and normally a top wheat exporter) expect to have one month or less of domestic consumption in carryout stocks at the end of 2016/17, compared to the 5-year average of 20 countries with one month or less of domestic consumption. There are also 23 countries for which USDA does not show ending stocks data. These countries import 6.09 MMT of wheat annually and, with limited storage capacity, tend to buy “just-in-time.”

With lower planted area and an expected return to trendline yields, world wheat production is poised to decrease in 2017/18. With importing country stocks drawn down to the lowest level since 2010/11, any supply shocks would increase price volatility in wheat futures markets. On paper, the world has ample wheat, but 44 percent of that supply resides in China, which rarely offers wheat or flour for export.

After four consecutive years of larger global production and lower global wheat prices, many customers have minimal stocks on hand to weather supply shocks, and as one wheat buyer noted, “wheat (export) prices take the stairs down and the elevator up.” Fortunately for our customers, the United States holds 12 percent of world wheat ending stocks, ensuring the U.S. wheat store is always open. What is still uncertain is whether the price of U.S. high-quality wheat will remain at the current low levels. As always, weather is the wildcard, both in its direct effects on world wheat production and the wheat price impacts of any production problems with other major grains, especially corn and soybeans.

Customers should be aware of changing conditions around the world, and can track USDA weekly wheat crop condition and planting progress reports, as well as the latest U.S. weather forecast on the weekly USW Price Report.

USW will begin weekly Harvest Reports in May. To subscribe to any of USW’s reports, click here.

thumbnail

By Stephanie Bryant-Erdmann, USW Market Analyst

Over the past decade, U.S. wheat planted area peaked in 2008/09 at 63.2 million acres (25.6 million hectares). Since then, U.S. wheat planted area has fallen 27 percent to a projected 46.1 million acres (18.7 million hectares) in 2017/18 according to the March 31 USDA Prospective Plantings report. If realized, it will be 16 percent below the 5-year average of 55.0 million acres (22.3 million hectares) — making it the lowest planted wheat area since 1919 when USDA records began.

This report actually increased winter wheat planted area by 360,000 acres (146,000 hectares) from USDA’s January 2017 estimate to 32.7 million acres (13.23 million hectares). However, the new estimate is still 9 percent down from 2016/17 planted area. The increase came from hard red winter (HRW) area, estimated at 23.8 million acres (9.63 million hectares), up 2 percent from the previous projection. Still, HRW planted area will be down 10 percent from 26.5 million acres (10.7 million hectares) planted for 2016/17.

Soft red winter (SRW) planted area decreased from the previous estimate to 5.53 million acres (2.24 million hectares). The biggest declines occurred in Midwest states where SRW faces strong competition for acres from corn and, particularly this year, from soybeans.

USDA expects white wheat acres — planted in both winter and spring — to reach 4.12 million acres (1.67 million hectares) for 2017/18, down slightly from 2016/17, but in line with the 5-year average. For the first time in three years, the Drought Monitor shows adequate soil moisture in the Pacific Northwest (PNW) following a rather wet winter.

Given the drop in planted area, crop conditions become crucial to any look out at potential production for 2017/18. For HRW, the April 6 Drought Monitor also shows that 45 percent of Kansas and 66 percent of Oklahoma were abnormally dry or experiencing moderate drought, even though the region received 1 to 4 inches (2.5 to 10 cm) of rain last week. Fifteen percent of Oklahoma remains in severe or extreme drought. In 2016, these states grew nearly half of the total U.S. HRW crop.

Last week’s beneficial moisture improved U.S. winter wheat condition in Kansas, Oklahoma and Texas, but the crop is still in worse condition than last year at this time. As of April 3, USDA rated the winter wheat crop at 51 percent good to excellent, compared to 59 percent on the same date in 2016. USDA rated 14 percent of the crop as poor or very poor, up from 7 percent last year.

The U.S. Northern Plains received abundant precipitation this winter, providing good soil moisture for HRS and durum planting. The past two years, farmers in North Dakota, Montana and Minnesota began HRS planting 7 to 14 days ahead of normal due to early springs. This year, planting dates will be closer to normal as farmers are now waiting for fields to dry out.

According to USDA, U.S. total spring-planted area will decline to an estimated 11.3 million acres (4.57 million hectares), 3 percent less than in 2016/17. The estimate includes 10.6 million acres (4.3 million hectares) of hard red spring (HRS), down 7 percent from 2016, if realized.

USDA expects U.S. durum planted area to total 2.00 million acres (809,000 hectares), down 17 percent from 2016/17. If realized, this would further constrict the global durum supply discussed in the March 23 Wheat Letter.

Continuing to drive the decline in U.S. wheat planted area is a net farmer return on wheat that dropped 18 percent between 2015/16 and 2016/17, while input costs declined only one percent in the same time period. USDA expects this trend to continue in 2017/18, with returns falling another 6 percent from already unprofitable 2016/17 levels.

There is a long way to go before the final count is in. However, with less planted area and an expected return to trend line yields, the International Grains Council (IGC) pegged 2017/18 U.S. wheat production at 50.2 MMT, down 20 percent from 2016/17.

thumbnail

By Stephanie Bryant-Erdmann, USW Market Analyst

Global durum prices remain under pressure from a large 2016/17 crop. Per International Grains Council (IGC) data, global durum production increased 3 percent year over year to 40.2 million metric tons (MMT), 9 percent above the 5-year average and the largest since 2009/10.

As reported in the USW Price Report, U.S. free-on-board (FOB) Great Lakes durum prices have slipped 4 percent since the beginning of marketing year 2016/17 to a range from $303 to $309 per metric ton (MT) on March 17. Over the same time, Canadian FOB St. Lawrence durum prices declined 10 percent year over year based on Agriculture and Agri-Food Canada (AAFC) data.

Despite lower prices, global durum trade is expected to decline 7 percent to 8.0 MMT in 2016/17. But while trade volumes are expected to decrease, consumption of durum is expected to increase 5 percent year over year to 38.7 MMT. Global human durum consumption remains steady at roughly 30 MMT. Seed and residual usage is projected to increase 10 percent in 2016/17 to 5.4 MMT, but the largest change is expected in global durum feeding. IGC anticipates durum feed usage to reach 3.2 MMT in 2016/17, up 68 percent year over year, if realized. Canadian animal feed usage is expected to double to 1.4 MMT in 2016/17 due to lower prices and lower quality supplies. Animal feed usage in the European Union (EU) is also expected to more than double in 2016/17 to 700,000 MT.

International Grains Council Feb. 23 2017 Grain Market Report

While there are eight major exporters of common wheat, there are just four major exporters of durum — Canada, the European Union (EU), Mexico and the United States — all of which are in the Northern Hemisphere and benefited from the wet spring and mild summer that boosted 2016/17 yields and supplies. These four exporters account for an average 95 percent of total global durum exports each year. Year over year, durum supply in the major exporting countries increased 19 percent to 49.3 MMT. IGC expects global durum ending stocks to total 10.7 MMT, 41 percent above the 5-year average.

Against this backdrop, farmers are making plans and, in some places, are beginning to sow durum in the Northern Hemisphere. Spring weather affects planting decisions, but early projections expect significantly lower durum planted area in 2017/18. Stratégie Grains expects reduced planted area and more normal yields will cut 2017/18 EU durum production by 9 percent year over year to 8.9 MMT. AAFC pegged Canadian durum production at 5.5 MMT, which would be down 29 percent year over year if realized. The reduction is based on an expected 20 percent decline in planted durum area and a projected 15 percent decrease in yield. Stratégie Grains forecasts 2017/18 Mexican durum production at 2.0 MMT, down an estimated 20 percent from 2016/17, if realized.

As discussed in the March 9 Wheat Letter, USDA pegged U.S. spring and durum planted area at 13.6 million acres (5.51 million hectares) at its annual Agricultural Outlook Forum and forecasted total U.S. wheat production to fall 20 percent year over year. USDA will release detailed acreage projections in the Prospective Plantings Report on March 31.

In the United States, durum farmers have a saying, “plant durum every year and sell every third year.” The soaring yields seen in marketing year 2016/17 put plenty of durum in storage, but provided little incentive to farmers to sell it. U.S. farmers see this as a time to wait for prices to rise, ensuring that regardless of final 2017/18 production volume, the U.S. store will remain open and able to supply the world market with high quality durum.

thumbnail

By Stephanie Bryant-Erdmann, USW Market Analyst

The USDA held its annual Agricultural Outlook Forum Feb. 23 to 24 where the 2017 Grain and Oilseeds outlook was presented. USDA currently estimates 2016/17 (June to May) wheat acreage at 46.0 million acres (18.6 million hectares), a nine percent decrease from last year.

USDA reported that winter wheat plantings are down 10 percent with the HRW crop having the largest decrease. HRW plantings fell by 12 percent to 23.3 million acres (9.43 million hectares). Soft red winter (SRW) plantings decreased by 300,000 acres (121,000 hectares) to 5.7 million acres (2.3 million hectares). USDA anticipates a 3 percent reduction in spring wheat plantings due to more favorable returns for other commodities. Currently, USDA’s spring wheat and durum acreage projection stands at 13.6 million acres (5.51 million hectares).

Due to the expected reductions in planted area and a return to trend line yields, production will decrease to a projected 50.0 MMT. If realized, that would be down 20 percent year-over-year. Based on trend yields, USDA expects the national average yield to fall to 47.1 bushels per acre (31.6 MT per hectare). USDA projects the wheat harvested-to-planted ratio will be 0.85, on par with 2016/17 and the 5-year average.

Though winter wheat planted area is at its lowest level in 108 years, growing conditions can greatly impact production levels as demonstrated in 2016/17. In February, winter wheat ratings declined in Illinois, Kansas, Montana, Nebraska, North Dakota and South Dakota, according to the monthly USDA Crop Progress report. The biggest change was noted in Montana, where USDA rated 5 percent of winter wheat in good to excellent condition compared to 70 percent in January. The percentage of Oklahoma wheat rated good to excellent increased to 43 percent, up from 33 percent in January. USDA reported 15 percent of Oklahoma wheat in poor or very poor condition, down from 17 percent in January, but significantly higher than the 1 percent poor or very poor on the same date last year. USDA resumes weekly crop progress reporting on April 3.

Large carryover stocks will partially offset the projected lower production, yet the forecast expects total U.S. supplies to decrease in 2017/18. USDA forecasts 2017/18 U.S. supplies at 84.3 MMT, down 9 percent from 2016/17, still 1 percent more than the 5-year average, if realized. Demand in the United States will decline in 2017/18, due to decreased feed usage. USDA anticipates a 2 percent decrease in domestic use, from 33.9 MMT to 33.1 MMT.

Smaller U.S. supplies and competition from other origins are expected to constrain U.S. wheat exports. USDA expects U.S. exports to decline slightly to 26.5 MMT, down 5 percent from the forecasted 2016/17 U.S. wheat export level of 27.9 MMT. U.S. ending stocks are forecast to decrease to 24.6 MMT, down 21 percent year-over-year but still 8 percent above the 5-year average.

To read more from the USDA Outlook Forum or to download presentations, please visit https://www.usda.gov/oce/forum/.

thumbnail

By Stephanie Bryant-Erdmann, USW Market Analyst

Since Jan. 1, the nearby wheat futures contract for hard red winter (HRW) on the Kansas City Board of Trade (KCBT) rallied 13 percent or 54 cents per bushel ($20 per metric ton) returning to price levels like those seen in June 2016. The rally is drawing support from both demand and supply factors. On the demand side, year to date U.S. 2016/17 HRW export sales total 10.1 million metric tons (MMT), up 95 percent from 2015/16 and 30 percent ahead of the 5-year average. Savvy buyers are also securing supplies for the next marketing season. To date, HRW export sales for marketing year 2017/18 total 182,000 metric tons (MT), up 8 percent from last year.

Robust demand for HRW is supported in part by low prices, but also by a change in the dynamic of the U.S. dollar. A strong U.S. dollar generally makes U.S. exports more expensive relative to other origins. However, while the U.S. dollar continues to strengthen against most currencies, it weakened against key competitor currencies. Year-over-year, the U.S. dollar weakened 3 percent against the Australian dollar, 11 percent against the Kazakhstani tenge and 20 percent against the Russian ruble. This shift is driving demand back to U.S. wheat in areas where the United States has a logistical advantage because it decreases the ability of buyers to offset increased shipping costs with lower priced wheat from competing origins.

The same low prices supporting HRW demand caused U.S. farmers to decrease HRW planted area by 12 percent last fall to 23.3 million acres (9.43 million hectares), which will likely result in smaller 2017/18 HRW production. Last year, record high yields offset lower planted area, but U.S. HRW planted area for 2017/18 is 20 percent less than five years ago. As discussed in the Feb. 23 Wheat Letter, farmers across the U.S. plains expect yields to return to the trend line this year given the current soil moisture and crop conditions.

Reduced HRW supplies are expected to be part of a smaller total world wheat crop in 2017/18 following last year’s record-large production. Production is expected to return to more normal trend lines around the world resulting in smaller crops for most of the world’s wheat exporting countries. The notable exception is the European Union (EU), where wheat production is expected to rebound after excessive rain cut yields last year. The European Commission forecast 2017/18 EU common wheat production at 143 MMT, up 7 percent from 2016/17 with better yields offsetting a slight reduction in planted area. EU 2017/18 durum production is expected to fall 2 percent from last year to 8.8 MMT, due to a reduction in planted area.

On Mar. 6, the Australian Bureau of Agricultural Research and Sciences (ABARES) projected Australian wheat planted area will decrease 1 percent to 31.6 million acres (12.8 million hectares) citing increased competition for area from canola, pulses and sheep. With the assumption of average growing season conditions and a return to trend line yields, ABARES forecast Australian 2017/18 wheat production at 24.0 MMT, down 11 MMT from 2016/17 and 5 percent below the 5-year average, if realized.

In February, Agriculture and Agri-Food Canada (AAFC) estimated 2017/18 Canadian wheat planted area will fall by 3 percent to 22.6 million acres (9.15 million hectares). A projected 29 percent decrease in durum acres and 12 percent decrease in winter wheat acres more than offset the expected 5 percent increase in spring wheat acres. Excessive rains last fall hurt quality and delayed harvest and subsequent fall planting across Canada. With decreased planted area and an expected return to trend line yields, AAFC expects Canadian wheat production to decrease in 2017/18 to 28.6 MMT. If realized, that would be a 10 percent decline from the prior year and 3 percent below the 5-year average.

Last fall, Russian farmers planted winter wheat on 36.5 million acres (14.8 million hectares), up 4 percent from the prior year. The Russian Ministry of Agriculture expects spring wheat planted area will decline slightly to 33.6 million acres (13.6 million hectares) due to increased competition for area from corn. Strategie Grains (SG) expects Russian 2017/18 wheat production to total 67.2 MMT, down 14 percent from last year’s record production due to a return to trend line yields that more than offset the increase in planted area.

SG expects Kazakhstan 2017/18 wheat production to fall 18 percent year-over-year to 13.8 MMT due to reductions in planted area and yield. Ukrainian farmers are also expected to produce less wheat in 2017/18. SG projects Ukraine wheat production will total 23.9 MMT. If realized that would be down 8 percent from 2016/17, but 7 percent above the 5-year average of 22.5 MMT.

The world is poised to produce a smaller wheat crop for the first time in four years, and the recent wheat futures rally indicate farmers, traders and customers alike are all taking notice, especially in light of record consumption. Before spring fully arrives with its typically volatile weather, customers should consider joining those who are securing supplies of high-quality U.S. wheat at what remain very attractive prices.