thumbnail

With the 2018 U.S. winter wheat harvest complete and October right around the corner, U.S. wheat farmers are now seeding a new crop. Across the 18 states that represent 90 percent of the area planted to winter wheat last year, USDA’s National Agricultural Statistics Service (NASS) estimates that 28 percent of the 2019 crop was planted as of September 23.


An image of wheat planting that caught our eye came recently from John McManigal, who grows soft white wheat with his family in Wasco County, Ore. John is an excellent agricultural field photographer and, with Mt. Hood looming over this mid-Columbia region, has a remarkable landscape on which to work. The photo he shared with U.S. Wheat Associates (USW) that we have posted here and his words tell an inspiring story of hope and renewal.


Seeding in Dust, Wasco County, Oregon,

Photo © John McManigal, Used with Permission


The Substation Fire started Tuesday, July 17, on US 197 near The Dalles, Ore., about 3:30 p.m. By evening it had raced east across Wasco County, jumped the Deschutes River and started up into Sherman County. The next day brought more wind. The fire gathered itself again and started another run to the east. By the end of the day on Wednesday, Mid-Columbia Producers figured roughly 2 million bushels of wheat went up in smoke.”


“That is my son Brad in the photograph seeding on Rich Kortge Farms, only about five miles east of where the Substation Fire started. This field had been left fallow last season but the vegetative cover was lost to the fire. The field in the background to the left of the fence was standing wheat that went up in flames on the afternoon of July 17.”


“It has not rained in months here and the seeding conditions look a little bleak.”


“But you know farmers. Maybe next year…”

thumbnail

By Stephanie Bryant-Erdmann, USW Market Analyst


USDA expects global wheat production to fall to the lowest level in 5 years at 733 million metric tons (MMT), down 3 percent from the record high of 758 MMT in 2017/18. If realized, it would be slightly below the 5-year average. This downturn is, unfortunately, led by decreasing supplies in historic wheat exporters. At the same time, USDA raised its forecast for global wheat consumption to a record high 746 MMT, up 1 percent from 2017/18. To help buyers stay up to date on this fundamental information, U.S. Wheat Associates (USW) is providing this round-up of current conditions and forecasts for Canada, Argentina and Australia.


The estimated wheat production in countries still harvesting adds only a small portion of the 2018/19 supplies in exporting countries, and the total is expected to be down for the second year in a row 


Canada. Winter is here, if you farm in Alberta and Saskatchewan that account for roughly 70 percent of Canadian wheat production. Provincial weekly crop reports on Sept. 11 noted harvest delays from early frosts, wet field conditions and, in some areas, snow. We do not yet know the extent of any damage to wheat quality from these conditions, but it raises concern because more than half of the spring wheat in the two provinces was still in the field. Harvest was an estimated at 23 and 46 percent complete in Alberta and Saskatchewan, respectively.


Agriculture and Agri-Food Canada (AAFC) had already pegged 2018/19 Canadian wheat production (excluding durum) down 4 percent from 2017/18 at 24.0 MMT. A 10 percent decrease in average wheat yields is partially offset by a 7 percent increase in expected harvested area. AAFC reported average wheat yields of 48.3 bu/acre (3.25 MT/ha) compared to 54.0 bu/acre (3.63 MT/ha) in 2017/18. Canadian durum production is expected up 1 percent from 2017/18 to 5.03 MMT; an expected 17 percent increase in harvested area more than offsets a14 percent reduction in average yields year over year. AAFC expects 2018/19 Canadian total wheat exports (including durum) to total 22.2 MMT, up 3 percent from 2017/18.


Argentina. According to the Bolsa de Cereales, the Buenos Aires Grain Exchange, Argentine farmers saw prices staying at profitable levels and planted 7 percent more wheat area for 2018/19. Since planting, the Argentine government announced an export duty of 4 pesos per dollar on wheat exports with its effects to be determined. Bolsa estimated total wheat planted area at 15.1 million acres (6.1 million hectares), up from 14.1 million acres (5.7 million hectares) in 2017/18.


On September 13, Bolsa reported beneficial moisture fell on the La Pampa region and areas around Buenos Aires. However, rainfall has been low in northwestern Argentina, which accounts for roughly one-third of wheat planted area. USDA’s September estimate for 2018/19 Argentinian wheat production was 19.5 MMT (716 million bushels), up 8 percent from 2017/18 and 35 percent greater than the 5-year average. Argentina harvest typically occurs in late November through early January.


Australia. The Australian Bureau of Agricultural and Resource Economics and Sciences (ABARES) forecasts 2018/19 wheat production at 19.1 MMT. That is down 10 percent from 2017/18 due to severe drought in New South Wales and Queensland, where Australian Prime Hard (APH) and Australia Hard (AH) production is centralized. Increased wheat production in Western Australia may partially offset the lower production elsewhere. Still, if realized, production volume would be the lowest since 2007/08. Australian wheat harvest typically occurs in December. USDA expects Australian exports to decrease to 14.0 MMT, 21 percent below the 5-year average.


With global wheat supplies tightening and global demand on the rise, customers should pay close attention to crop conditions in these countries. Even if early snows or drought cut supplies there, or a government intervenes in the market somewhere else, U.S. farmers remain the most reliable suppliers of high quality wheat in the world.

thumbnail

By Stephanie Bryant-Erdmann, USW Market Analyst

USDA updated its monthly World Agricultural Supply and Demand Estimates (WASDE) on August 10 and expects the global wheat supply and demand situation to be more favorable for U.S. farmers this year due to shrinking global wheat production. USDA lowered its global wheat production estimate by 6.63 million metric tons (MMT) to 730 MMT, down 4 percent year over year and the lowest level since 2014/15, if realized.

Widespread drought across Germany and northern Europe is one reason why USDA dropped its production forecast. USDA expects European Union total wheat production to fall to 138 MMT, 9 percent below both the 5-year average and 2017/18 production. With smaller EU wheat production, USDA lowered marketing year 2018/19 (June 1 to May 31) EU wheat exports to 23.0 MMT. If realized, that would be 2 percent below the year prior, and 25 percent below the 5-year average.

At the same time, USDA also expects Russian wheat production to fall 20 percent year over year to 68.0 MMT due to unfavorable winter wheat planting and growing conditions. With Russian wheat supplies shrinking, the 2018/19 Russian wheat export forecast is down 7.00 MMT from 2017/18 to 35.0 MMT.

With lower exportable wheat supplies (production plus beginning stocks minus domestic consumption) in Russia and the EU, USDA expects the United States to have the largest exportable supply of wheat in the world in 2018/19 at 49.7 MMT.

Consequently, USDA expects 2018/19 U.S. wheat exports to reach 27.9 MMT, up 14 percent from 2017/18 and 7 percent above the 5-year average, if realized. Still, U.S. wheat export sales pace will need to increase to meet this goal, as year-to-date U.S. wheat export sales total just 7.53 MMT or 27 percent of USDA’s anticipated total.

The shrinking global wheat supply, increasing global wheat consumption and large U.S. wheat supply have all lead to U.S. wheat futures rallies over the past month. Since the last WASDE update on July 12, U.S. HRW futures are up 72 cents per bushel ($26 per MT), SRW futures grew 54 cents per bushel ($20 per MT) and HRS climbed 67 cents per bushel ($25 per MT).

Each month, U.S. Wheat Associates (USW) updates a graphic summary of USDA’s WASDE (World Agricultural Supply and Demand Estimates) report. View the August summary here.

thumbnail

U.S. farmers are making good progress now on the second half of their 2018 winter wheat harvests and U.S. Wheat Associates (USW) wants to provide a mid-season look at winter wheat harvest and quality in this “Wheat Letter” entry. USW publishes a new Harvest Report every Friday on this website.


Soft Red Winter (SRW) harvest of a crop that was quite affected by rain throughout the growing season is now complete. Planted area was up somewhat compared to last year’s record low level. With abundant rain, yields were above average for the year but test weights from crops in both the East Coast and Gulf port tributaries are less than last year and the 5-year average. That knocks down the U.S. Grade for this crop to #3 SRW. DON levels are slightly higher in 2018 but are below the 5-year average. Processers should find good qualities for crackers overall and for cookies from segments of the crop. With higher protein and good extensibility, the crop should also be valuable for blending for baking applications. USW will post the final SRW quality report within the next few weeks.

John Hoffman SRW Wheat

Past USW Director John Hoffman of Circleville, Ohio, just beat the rain to complete his 2018 SRW harvest.


Hard Red Winter (HRW) harvest is more than 80 percent complete and buyers should want to take a very good look at the 2018 crop. Starting with another record low planted area, USDA believes farmers will harvest 17.9 million metric tons (MMT) of HRW this year or 12 percent less than in 2017. That amount is likely to change as USDA measures the effects of abandoned area in drought stressed areas of the Southern Plains. For buyers, however, this is a very good supply of HRW with composite protein holding at 12.6% (12% moisture) and test weights at 79.7 kg/hl (60.6 lb/bu). Quality reports from Montana’s harvest are even better. While flour and dough properties are just being measured for this crop, domestic millers and processors are saying they like what they see in this HRW crop.

HRW Harvest Peter Miller

HRW farmer Peter Miller of Lodgepole, Nebraska, posted this photo on his Twitter account @pmiller1320 on July 23.


Soft White (SW) winter wheat growing conditions across the Pacific Northwest (PNW) were nearly ideal for the 2018 crop. As of Aug. 3, the PNW SW harvest was 55% complete in Oregon (sadly aided by destructive fires in the north-central part of the state), 28% in Washington and 12% in Idaho. Industry sources say continued dry weather has pushed progress beyond those levels since early this week. Dryland yields are well above normal and early quality analysis indicate good test weight at 61.8 lb/bu (81.3 kg/hl), very low moisture content at 8.4%, low protein at 9.4% (12% moisture basis), and sound falling number value at 305 seconds.

Harvest Time Logan Padget

Logan Padget, son of USW Secretary-Treasurer Darren Padget, of Grass Valley, Oregon, posted this beautiful image of SW “Harvest Time” on their farm July 23.


We hope you will subscribe to USW’s Harvest Report and if you want to ask questions about this year’s crops or about other topics related to U.S. wheat and U.S. wheat exports, visit our new “Ask the Expert” section of this website at https://www.uswheat.org/market-and-crop-information/ask-the-expert/.


thumbnail

By Amanda J. Spoo, USW Assistant Director of Communications

This week, the Wheat Quality Council hosted its annual hard red spring (HRS) and durum crop tour. Participants spent three days mainly in North Dakota surveying this year’s crop and estimating yield. The tour, which surveyed a total of 342 fields, estimated weighted average HRS yield at 41.1 bushels per acre (bu/a), slightly higher than last year’s HRS average of 38.1 bu/a, which was impacted by ongoing drought conditions in western areas. The durum weighted average yield was 39.3 bu/a, in line with last year’s average of 39.7 bu/a, which was a decline from 45.4 bu/a in 2016. While the overall crop looks better than last year, it is still below the tour’s 5-year average of 45.4 bu/ac.

Participants on the tour always represent a wide range of the wheat industry, including millers, traders, farmers, researchers, government officials and media who travel along eight distinct routes covering most of the state’s wheat production.

“The continuing success of this tour is that we make it a value-added experience,” said Wheat Quality Council Executive Vice President Dave Green. “We keep training more and more people and that makes a difference across this industry.”

On the first day, participants drove west from Fargo to Bismarck, with two routes going farther into the western part of the state, and others covering western Minnesota and northern South Dakota. The Day 1 weighted average yield was 41.1 bu/a, up from 38.8 bu/a in 2017. For HRS specifically, the yield was 41.3 bu/a, down from 37.9 bu/a in 2017. The scouts surveyed 138 fields on Day 1, of which 135 were HRS and 3 were durum.

On Day 2, the tour surveyed 148 fields, 135 of which were HRS and 13 were durum. The group moved from Bismarck to Devils Lake. The overall average for Day 2 was 38.8 bu/a, up from 35.7 in 2017. For HRS, the yield was 38.3 bu/a, up slightly from 35.8.

The third day of the tour included a half day of crop surveying. The participants then all returned to North Dakota State University’s Northern Crops Institute in Fargo to compile the overall crop report. On Day 3, participants surveyed at total of 55 HRS fields and one durum field. The Day 3 weighted average yield for HRS was 45.6 bu/a, down slightly from 46.2 bu/a in 2017.

The results reflect a snapshot of yield potential observed by the participants in the fields they scouted.

“I think what we saw was kind of encouraging in part because there had been concern about scab with this crop, but we saw a lot of spraying for it; and we never felt that more than a handful of fields had a serious scab problem,” said Green. “And we were scouting for it, so we were very positive about what we saw.”

Green added, “I’m also positive that we thought we were headed for a lower protein record relative to how good everything looked going in, but I wouldn’t say the same thing now that we’ve seen the crop. I think it is going to have a wide range of protein and a lot of choices for buyers. I would anticipate that with the heat that us on the crop, the quality is going to be better than normal.”

View highlights and photos from the tour by searching #wheattour18 on Facebook and Twitter. For more information and for results from previous tours, visit the Wheat Quality Council’s website at www.wheatqualitycouncil.org.

thumbnail

By Stephanie Bryant-Erdmann, USW Market Analyst

USDA raised 2018/19 U.S. wheat production to 51.2 million metric tons (MMT), up 8 percent from 2017/18, if realized. Along with the increase, USDA also released its first U.S. by-class forecast for U.S. wheat. Increases in hard red spring (HRS), soft red winter (SRW) and soft white (SW) wheat are expected to more than offset a 12 percent year over year reduction in hard red winter (HRW). U.S. spring wheat production is expected to increase to 15.9 MMT, up 52 percent from the previous year when drought shriveled the crop.

But while wheat production is expected to increase in the United States, it is expected to fall globally in 2018/19. USDA forecast 2018/19 total world wheat production at 736 MMT, down 3 percent from the year prior, if realized. The largest decrease is expected in Russia, which is forecast to produce 67.0 MMT, down 18.0 MMT from 2017/18 due to poor growing conditions. Wheat production is also expected to fall in the European Union (EU) and Australia due to dry conditions.

While 2018/19 world wheat production is expected to fall for the first time in 5 years, world wheat consumption is expected to grow 5.23 MMT from the previous year to 749 MMT. If realized, world wheat consumption will outpace world wheat production by 12.6 MMT in 2018/19.

With consumption outpacing production, world wheat ending stocks are expected to fall to 261 MMT, down 5 percent from 2017/18. The reduction in ending stocks puts the 2018/19 global stocks-to-use ratio (excluding China) just under 20 percent, which is the lowest level since 2007/08.


thumbnail

By Stephanie Bryant-Erdmann, USW Market Analyst

With the world consuming more wheat than it produces for the first year since 2012/13, prices are also on the rise. According to Global Trade Atlas data, the average global wheat price increased 4 percent year over year to $203 per metric ton (MT) in 2017/18 (June 1 to May 31). Most of that price increase occurred in the last five months of the marketing year as the market digested lower Northern Hemisphere wheat production estimates and strong demand for 2018/19.

Here is a by-country look at current production estimates and the average wheat prices (noting that prices vary by class and quality) from major exporting countries and regions.

United States. According to the U.S. Wheat Associates Price Report, the average price for U.S. wheat rose an average $47 per MT from one year ago. Hot, dry conditions in the U.S. hard red winter (HRW) growing region decreased yield potential and pushed prices up for this largest U.S. wheat class. USDA forecasts U.S. 2018/19 wheat production at 49.7 million metric tons (MMT), up 5 percent year-over-year, but still 11 percent below the 5-year average. U.S. beginning stocks are estimated at 29.4 MMT, down 8 percent from 2017/18, but still 28 percent above the 5-year average. Increased U.S. wheat production is expected to offset the lower U.S. beginning stocks and total U.S. supply is expected to remain stable year over year at 79.1 MMT.

Canada. The International Grains Council (IGC) reported the average price for Canada Western Red Spring (CWRS) at 13.5 percent protein (13.5 percent moisture basis) from Vancouver rose to $255 per MT in May. This is up $24 per MT from May 2017 and reflects the tighter global supply and demand picture. On June 21, Agriculture and Agri-Food Canada (AAFC) forecasted 2018/19 common wheat production (excluding durum) at 25.4 MMT, up slightly from 2017/18. A 15 percent bump in spring wheat planted area contrasts with an 11 percent drop in winter wheat planted area. Predicted 2018/19 durum production will increase 15 percent to 5.7 MMT due to an 11 percent year over year increase in planted area. The global supply and demand situation for durum wheat is also supporting prices. Canadian durum prices at $282 per MT are an average $7 per MT above 2017 levels.

European Union (EU). IGC reported the average French wheat price reached $205 per MT in May, up from $187 per MT the year prior. French production is expected to increase to 37.8 MMT, up 4 percent due to higher expected yield and larger planted area. 2018/19 EU wheat production is expected to fall 1.80 MMT from 2017/18 to 140 MMT according to Stratégie Grains, which is providing continued price support for exportable French supplies.

Australia. The current average price for Australian wheat of $239 per MT is up 22 percent year over year according to IGC data, which point to lower carry-in stocks and hot, dry conditions. In June, the Australian Bureau of Agricultural and Resource Economics and Science (ABARES) forecasted 2018/19 Australian wheat production to rise 3 percent from 2017/18 to 21.9 MMT, despite a 3 percent decrease in planted area to 29.5 million acres (12.0 million hectares).

Argentina. In May, the average price for Argentine wheat reached $261 per MT according to IGC data. That is up 38 percent year over year. This month, the Buenos Aires Grain Exchange reported Argentine farmers see higher revenue potential and expects them to plant 7 percent more area to wheat in 2018/19, reaching 15.1 million acres (6.1 million hectares). USDA’s June estimate for 2018/19 Argentina’s wheat production was 19.5 MMT (716 million bushels), up 8 percent from 2017/18 and 35 percent greater than the 5-year average.

Black Sea (Russia, Ukraine and Kazakhstan). The average price for Russian 4th grade milling wheat (8.8 to 10.5 percent protein on a 12 percent moisture basis) reached $213 per MT in May, up 14 percent from the year prior according to IGC. Expectations for lower 2018/19 production in the Black Sea region are supporting export prices. USDA projects combined 2018/19 output from Russia, Ukraine and Kazakhstan will drop 14 percent to 109 MMT (4.00 billion bushels) based on an expected return to trendline yields. If realized, the combined harvest would still be greater than the 5-year average.

At the end of May, the Russian Meteorological Service noted hot, dry conditions threatened winter wheat in Russia’s southern regions, which have not received rain since April. Conversely, cold wet weather is delaying spring wheat planting in other regions. To date, 23.3 million acres (9.43 million hectares) of spring wheat has been planted, compared to the 2017/18 total spring wheat area of 30.9 million acres (12.5 million hectares). Russian consultancy SovEcon forecasted Russian wheat production to decline to 77.0 MMT (2.83 billion bushels), down 10 percent from 2017/18.

UkrAgroConsult reported Ukrainian wheat planted area increased 2 percent year over year to 15.5 million acres (6.28 million hectares). The Ukrainian meteorological service expects wheat yields to fall 8 percent year over year to 56.5 bu/acre (3.80 MT/ha). 2018/19 Ukrainian wheat production is forecast at 23.9 MMT (878 million bushels), compared to 25.4 MMT (933 million bushels) in 2017/18.

IGC expects yield declines and smaller planted area will lower Kazakhstan wheat production to 13.7 MMT (503 million bushels), down 7 percent from 2017/18, if realized.

U.S. Wheat Associates Board of Directors Header

Generally cool spring conditions delayed the start of the 2018/19 U.S. winter wheat harvest, but the combines are now in the fields and U.S. Wheat Associates (USW) published a preliminary Harvest Report on May 25. USW Harvest Reports are published every Friday afternoon, Eastern Daylight Time, throughout the season with updates and comments on harvest progress, crop conditions and current crop quality for hard red winter (HRW), soft red winter (SRW), hard red spring (HRS), soft white (SW) and durum wheat.

The weekly Harvest Report is a key component of USW’s international technical and marketing programs. It is a resource that helps customers understand how the crop situation may affect basis values and export prices.

USW’s 14 overseas offices share the report with their market contacts and use it as a key resource for answering inquiries and meeting with customers. USW also publishes the report in Spanish as  “Trigonoticias,” distributed to Latin American wheat buyers and millers and posted on www.uswheat.org.

Anyone may register to subscribe to an email version of the Harvest Report. For the first time this year, USW includes links in the email to additional wheat condition and grading information, including the U.S. Drought Monitor, USDA/NASS Crop Progress and National Wheat Statistics, the official FGIS wheat grade standards and USDA’s World Agricultural Supply and Demand Estimates report. Harvest Reports are also posted online at www.uswheat.org/harvest.

thumbnail

By Stephanie Bryant-Erdmann, USW Market Analyst

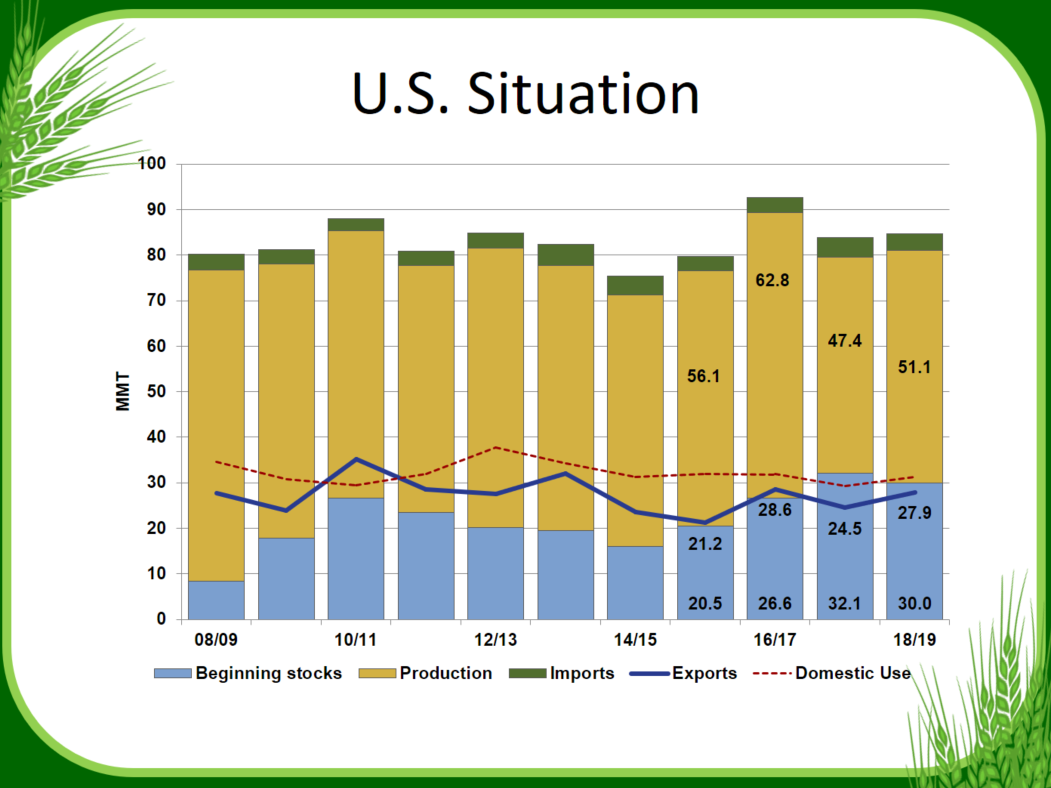
With the small, stressed hard red winter (HRW) wheat crop getting the lion’s share of attention, it was an initial surprise to read in USDA’s May World Agricultural Supply and Demand Estimates (WASDE) that U.S. wheat production is expected to increase to 49.6 million metric tons (MMT) in 2018/19. That would be up 5 percent year over year, if realized.

The forecast increase is a result of greater harvested area and slightly higher average yield in the other classes. USDA forecast 2018/19 all wheat average yield at 46.8 bushels per acre (3.15 metric tons [MT] per hectare), up from 46.3 bushels per acre (3.11 MT per hectare) last year. Harvested area is expected to increase 1.3 million acres (526,000 hectares) in 2018/19. Crop condition ratings also matter in this forecast, and as the following by-class reviews show, HRW is clearly the exception to the up-trend in production.

HRW production is expected to be the smallest since 2006/07 at 17.6 MMT. If realized, that would be down 14 percent year over year and 22 percent below the 5-year average. Low farm-gate prices and poor planting weather last fall reduced 2018/19 U.S. HRW planted area to 23.2 million acres (9.4 million hectares), the second lowest planted area on record. That poor start coupled with widespread drought throughout the U.S. Southern Plains set up the current situation where harvested HRW acres are expected to fall 5 percent from 2017/18 to 16.5 million acres (6.68 million hectares).

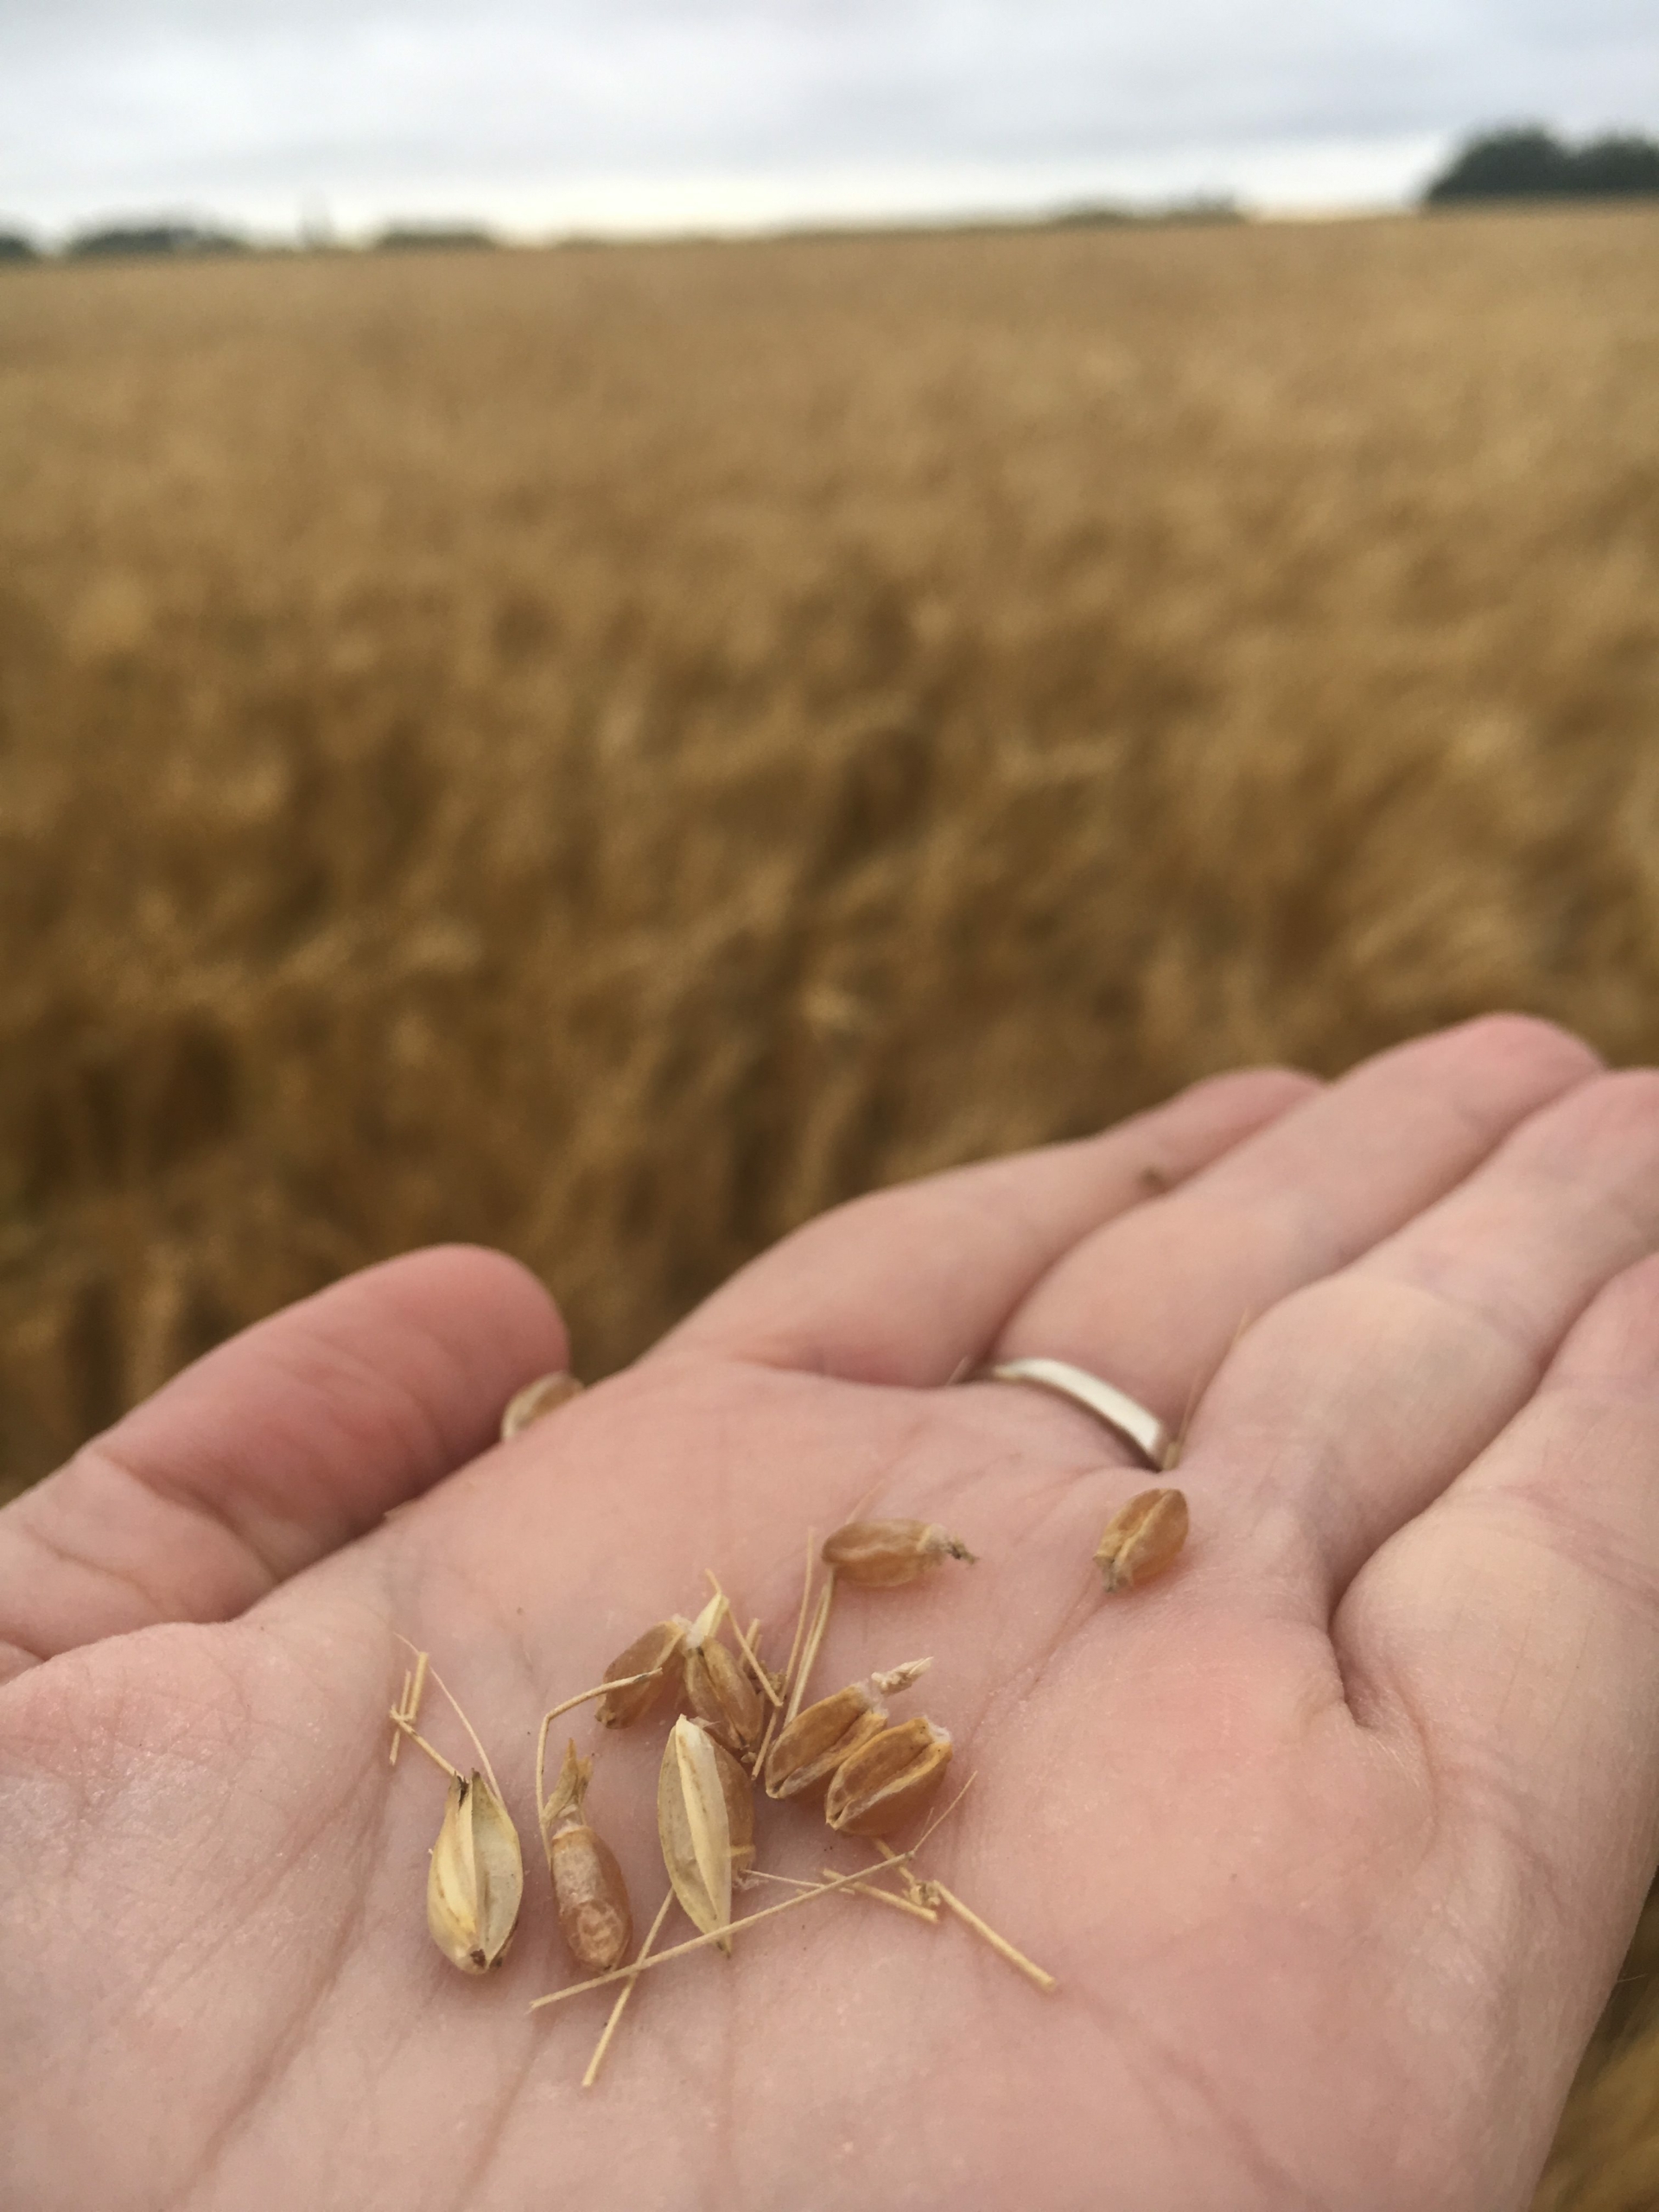
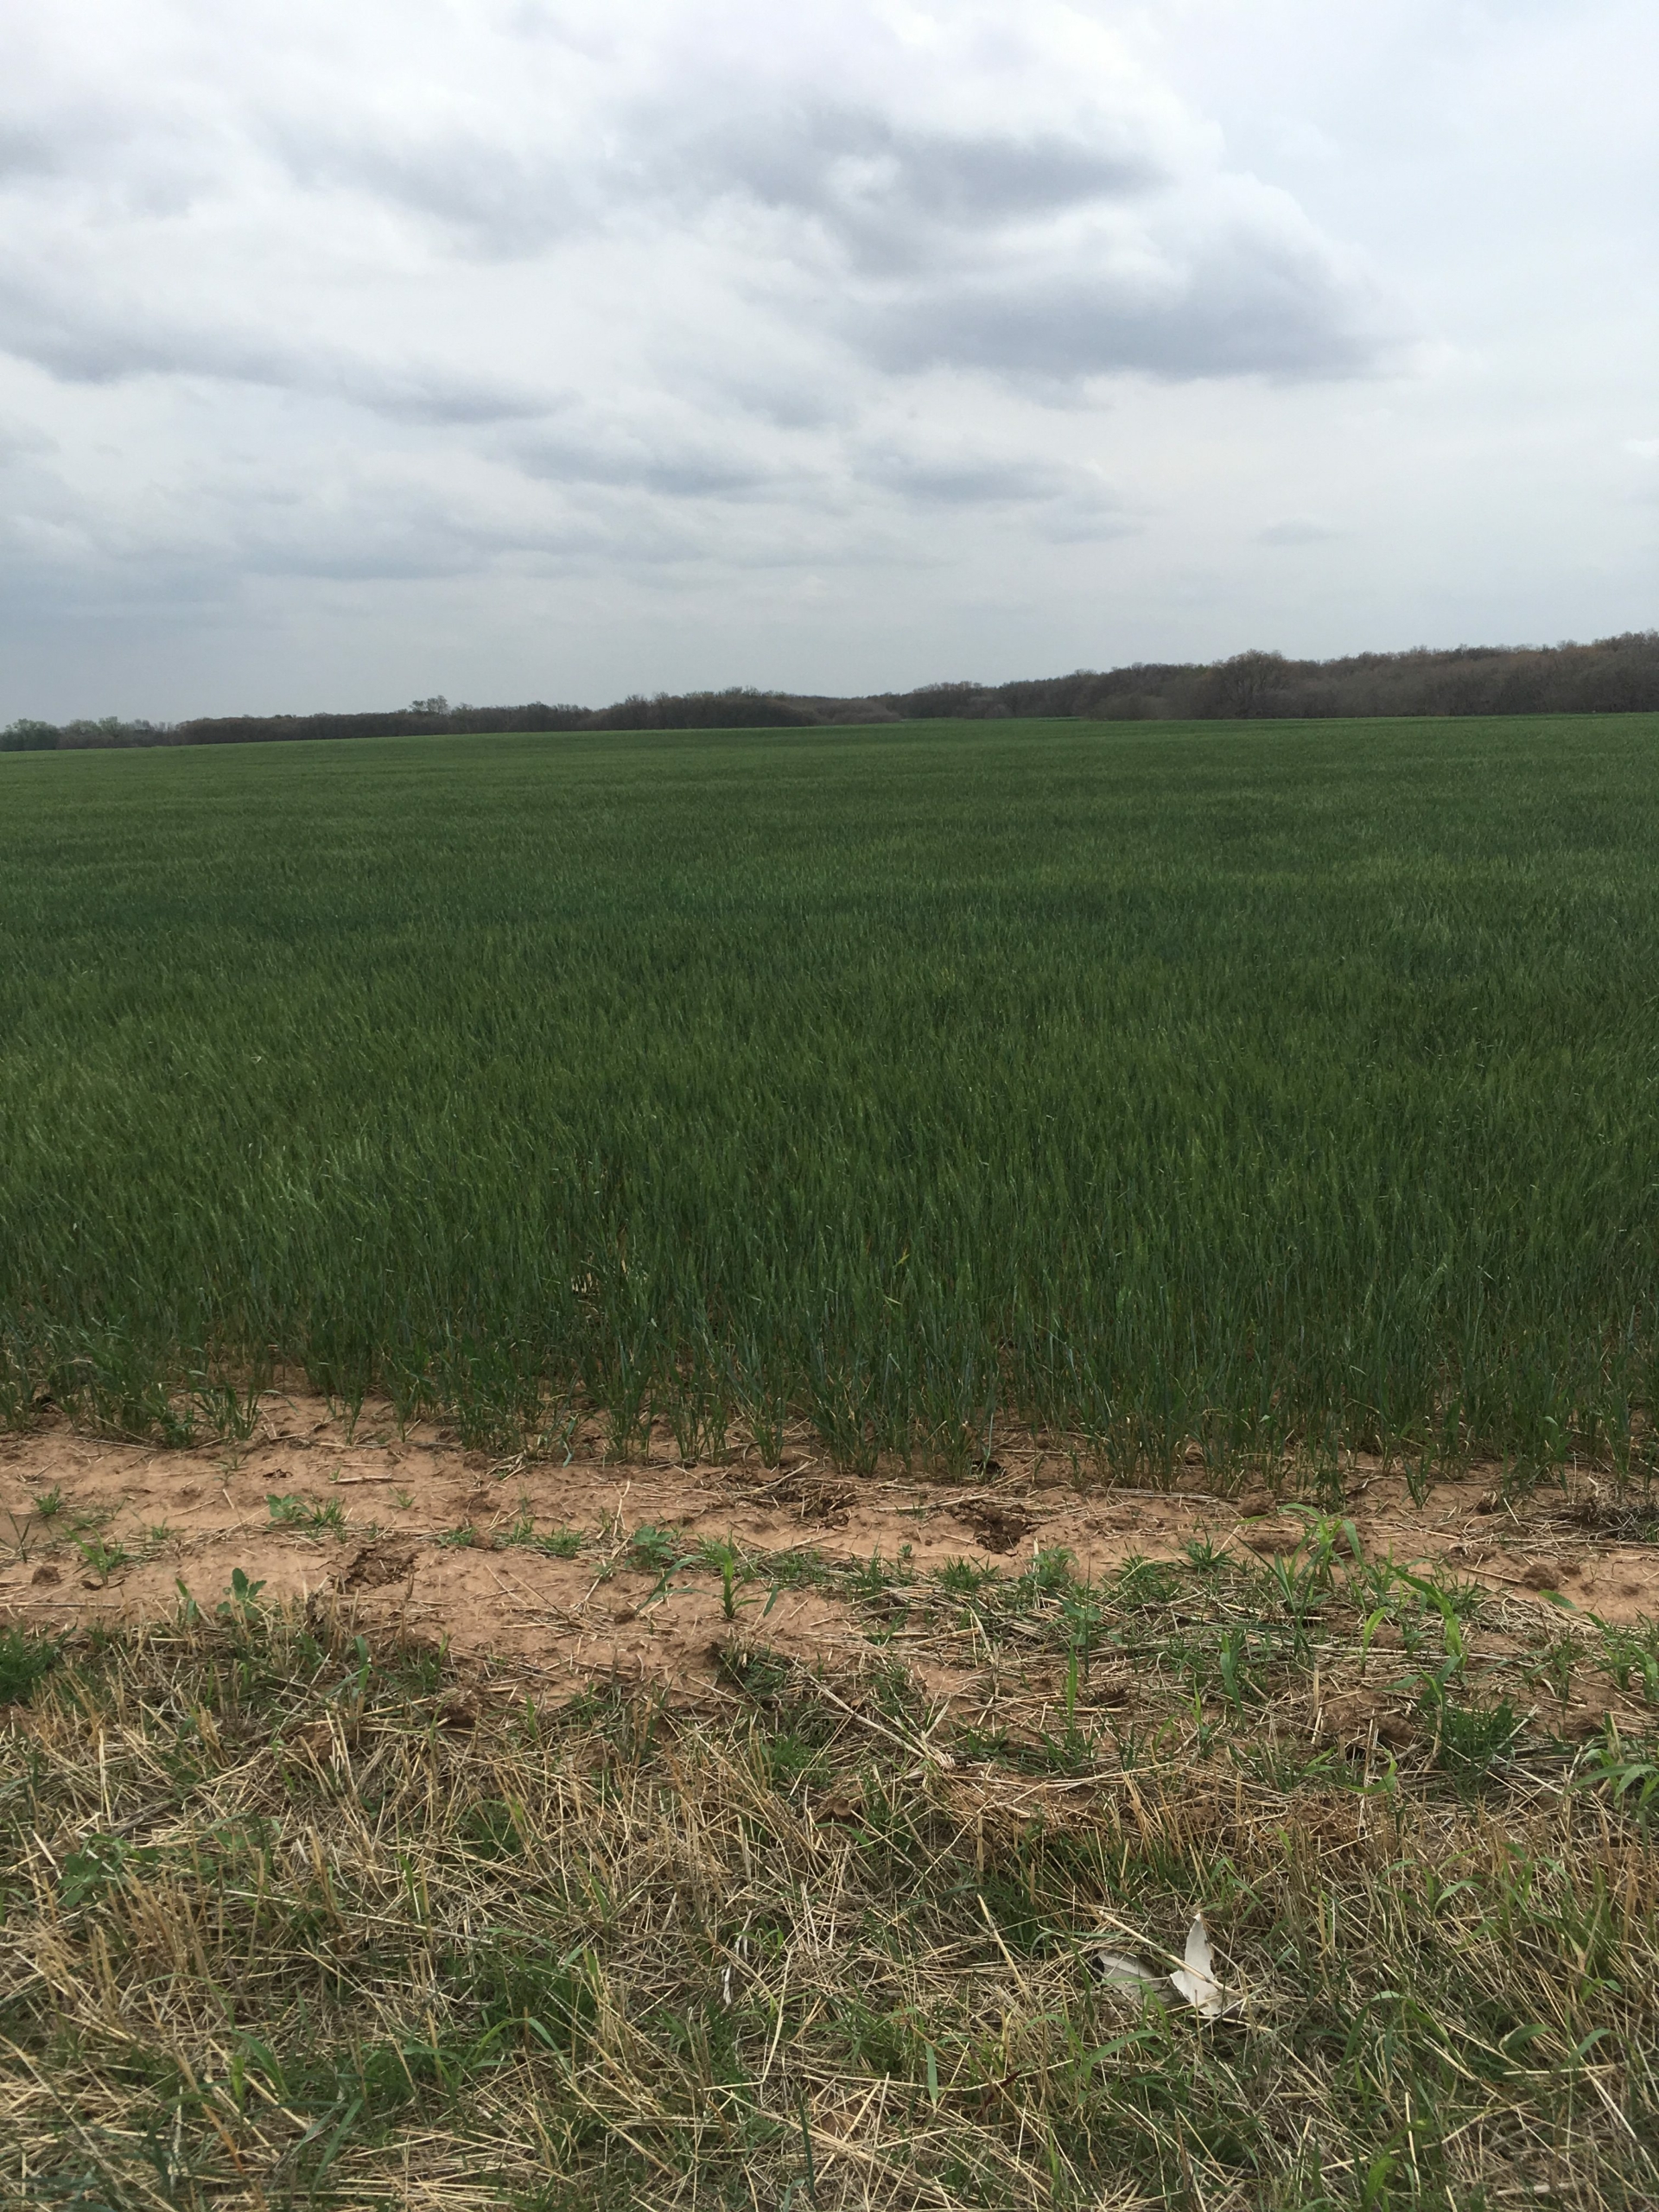
The large decrease in harvested acres is centralized in the U.S. Southern Plains where HRW crop condition ratings remain poor. In top HRW-producing states of Kansas, Oklahoma and Texas, 51 percent, 65 percent, and 59 percent of HRW is rated poor or very poor, respectively. As a consequence of the drought and resulting poor crop conditions, USDA expects harvested area in Oklahoma to fall 31 percent year over year to 2.0 million acres (810,000 hectares). On May 10, USDA rated 25 percent of HRW in the states surveyed in good to excellent condition, while 45 percent is rated poor or very poor. Read more about the all too evident challenge of wheat farming on the High Plains.

Soft red winter (SRW) production is expected to increase to 8.57 MMT in 2018/19. If realized, that would be up 8 percent year over year, but still 22 percent below the 5-year average. 2018/19 U.S. SRW harvested area is expected to increase 8 percent from the year prior to 4.0 million acres (1.62 million hectares). USDA also expects record high yields in Indiana, Kentucky, Maryland and Michigan due to favorable growing conditions this spring.

On May 14, USDA noted week over week crop condition rating improvements in nearly all SRW-growing states, with 67 percent of the SRW acres surveyed rated good to excellent. Week over week improvements were noted in Illinois and Arkansas where 63 percent of SRW was rated good to excellent, up 10 percentage points and 5 percentage points, respectively, from the week prior.

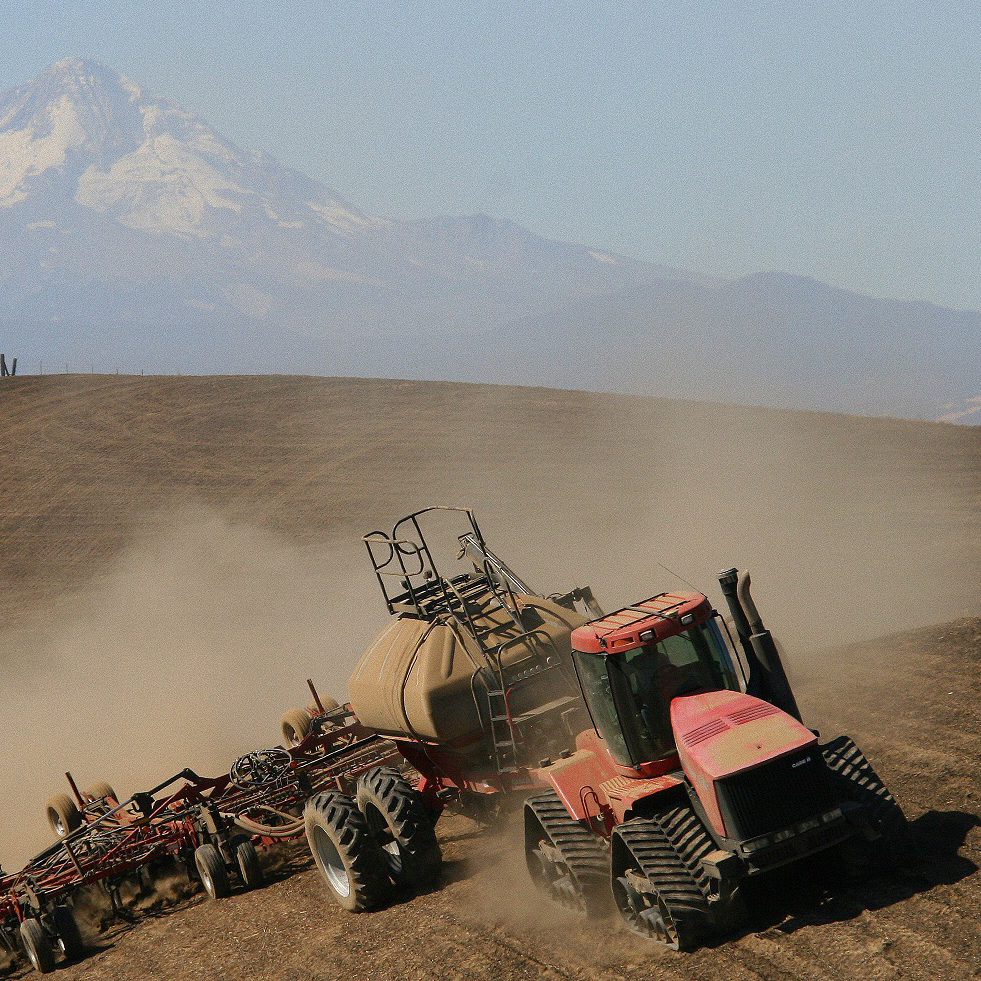
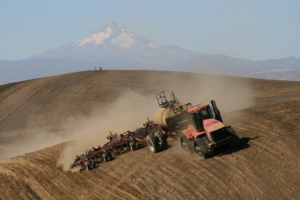
White wheat.* 2018/19 white winter wheat production is forecast at 6.24 MMT, including 5.66 MMT of soft white (SW) winter wheat and 577,000 MT of hard white (HW) winter wheat. If realized, SW winter wheat production would be up 2 percent year over year, due to increased planted area, while HW winter wheat production would be down 11 percent from 2017/18 due to forecast reduction in average yield. SW winter wheat production is centralized in the Pacific Northwest (PNW) states of Idaho, Oregon and Washington. As of May 14, 71 percent of Idaho SW, 80 percent of Oregon SW and 85 percent of Washington SW was rated in good to excellent condition.

Desert Durum®. USDA expects Desert Durum® production — centralized in Arizona and California and planted in the winter — to total 332,000 MT, up 6 percent from 2017/18 due to significantly better yields in California. In Arizona, the Desert Durum® crop was 90 percent headed by April 29, significantly ahead of the year prior’s pace.

Spring wheat and Northern durum. Snow covered, frozen fields delayed spring wheat and Northern durum planting this year, but U.S. farmers are beginning to catch up. As of May 14, spring wheat and durum planting is 58 percent complete, up from just 30 percent complete the week prior, but still behind the 5-year average pace of 67 percent.

With spring planting still underway, USDA did not provide a by-class breakdown of production for hard red spring (HRS) and durum on May 10. However, USDA did note that combined spring wheat and Northern durum production is projected to increase 34 percent year over year due to “both increased area and yield.” With total U.S. wheat production projected at 49.6 MMT and U.S. winter wheat production projected at 32.4 MMT, that puts 2018/19 spring wheat — including soft white spring, HRS, and hard white spring — and durum production at 17.2 MMT.

Back on March 29, USDA projected U.S. HRS planted area at 12.1 million acres (4.9 million hectares). If farmers are able to realize their planting intentions despite the late start, that would be up 17 percent year over year. Northern durum planted area was forecast at 1.88 million acres (760,000 hectares), down 14 percent, if realized. Still, weather will play a role in farmers’ decisions, and a late spring in Montana and western North Dakota tends to favor increased wheat area. Conversely, it tends to favor increased corn and soybean acres in Minnesota.

To stay in touch with U.S. wheat harvest progress, subscribe to the U.S. Wheat Associates Weekly Harvest Reports, which will start later this month.

*In the May 10 report, USDA combined data for soft white winter wheat and hard white winter wheat. Both soft white (SW) and hard white (HW) can be grown in either the spring or fall. USDA will provide a wheat by-class outlook in July. Similarly, data for HRS, SW spring, HW spring and spring-planted durum were combined into a general “spring-planted wheat” category.

thumbnail

By Stephanie Bryant-Erdmann, USW Market Analyst

This week I joined the annual Wheat Quality Council (WQC) Hard Red Wheat (HRW) Tour for an early survey of the new crop. Each year, participants gather in Manhattan, Kan., and spend the next two and a half days in small scout teams, randomly stopping at 14 or more fields in a full day along the same routes followed for many years. The teams measure yield potential, determine an average for the route and estimate a cumulative average for the day when all the scouts come together in the evening. Last year, tour participants faced snow and muddy fields. This year, the snow is a distant memory, as fields on days one and two were all bone dry. A violent storm rolled through central Kansas on Day 2, which cut some scouting short, but brought much needed moisture to the wheat fields.

Just a few hours before U.S. Wheat Associates (USW) published this issue of “Wheat Letter,” the tour estimated a final average yield potential of 37.0 bushels per acre (bu/ac) or about 2.49 metric tons (MT) per hectare for the 2018/19 Kansas HRW crop. This year, the tour participants made 644 stops to scout fields. Combining seeded area with per-acre yield potential, the total production potential estimate was 243.0 million bushels [(6.61 million metric tons (MMT)]. Last year’s total production estimate was 282 million bushels (7.67 MMT).

On the first day, the tour traveled from Manhattan along several routes covering most northern Kansas counties. The cumulative Day 1 average yield potential was 38.2 bu/ac, which is equivalent to about 2.57 MT per hectare, compared to 43.0 bu/ac (2.89 MT per hectare) in 2017. To reach that average, participants surveyed a record 317 fields recording a range from a low of 17 bu/ac to a high of 93 bu/ac. We saw very short wheat that was two to four weeks behind developmentally. Fields were very dry, which has prevented disease establishment, but threatens yield potential.

Participants also received a report on the Nebraska and Colorado wheat crops. Nebraska estimated an average 43.0 bu/ac (2.89 MT per hectare) for a total production estimate of 43.7 million bushels (1.19 MMT), down roughly 7 percent from last year’s tour estimate. Colorado estimated an average of 35.0 bu/ac (2.35 MT per hectare) with total production estimated at 70 million bushels (1.90 MMT), down 19 percent year-over-year, if realized.

On the second day, the tour traveled on routes that led from the city of Colby to Wichita, making 284 stops. The number of observations was up significantly from last year due to much better field conditions this year, though severe weather including tornados and hail, did cut some scouting short. Scouts reported most wheat was one to two weeks behind normal development, but continued to see very little disease pressure. This year, the tour estimated Day 2 average yield at 35.2 bu/ac (2.37 MT per hectare), for a combined two-day average of 36.8 bu/ac (2.47 MT per hectare) across 601 stops. Last year, the combined two-day average was 44.9 bu/ac (3.02 MT per hectare) on 427 stops.

Participants also received a crop report from Oklahoma, where drought conditions severely impacted the panhandle of the state which received less than 0.1 inch (less than 0.5 cm) of rain between September and mid-February. The estimated average yield in Oklahoma is 24.8 bu/ac (1.67 MT per hectare), for a total production estimate of 54.8 million bushels or about 1.49 MMT. If realized, that would be down 44 percent year over year. With decreased yield potential, many farmers have chosen to graze out the wheat fields to feed hungry cattle whose pasture has been impacted by the drought as well. As a consequence, harvested area in Oklahoma is expected to be sharply lower in 2018/19.

The third and final day of the tour was shorter, with each car making three to four field stops on the way from Wichita to Manhattan for the final report. The Day 3 estimated average yield was 39.8 bu/ac, (2.67 MT per hectare) across 43 stops.

View highlights and photos from the tour by searching #wheattour18 on Facebook and Twitter. The WQC also sponsors a spring wheat tour in the Northern Plains in July. For more information, visit the Council’s web site at https://www.wheatqualitycouncil.org.