thumbnail

U.S. wheat farm families grow six distinct classes of wheat across the diverse landscape of the United States. Those farmers take great care in producing the highest quality wheat in the most sustainable ways possible to honor their family legacies and to ensure greater value for their customers at home and abroad. Behind the world’s most reliable supply of wheat are the world’s most dependable people.


The Kleeman/Millershaski Family: Gary Millershaski started farming with his father-in-law Earl Kleeman in 1992 and his sons Jeremy and Kyler joined the operation four years ago. Sadly, Earl passed away in 2019, but not before he proudly helped harvest what was one of the family’s best wheat crops in years. Kyler Millershaski is excited to build on his family’s legacy as the next generation on the farm.

Location: Lakin, Kansas
Classes of Wheat Grown:  Hard Red Winter (HRW) and Hard White (HW)
Leadership:
Gary Millershaski: Past President, Kansas Association of Wheat Growers; Kansas Wheat Commissioner; USW Director
Kyler Millershaski: Vice President, Kansas Association of Wheat Growers 

thumbnail

By Claire Hutchins, USW Market Analyst

Each year in May, the Wheat Quality Council (WQC) hosts a three-day winter wheat tour across Kansas and parts of surrounding states to assess hard red winter (HRW) wheat conditions and yield potential. For the past 50 years, caravans of industry stakeholders including farmers, journalists, economists, millers, traders and agronomists have joined together to report on the crop.

This year, with the uncertainty of the COVID-19 pandemic, WQC could not conduct the traditional tour. Instead, Kansas Wheat and K-State Research and Extension (KSRE), in conjunction with the Kansas Department of Agriculture, and other industry partners held a virtual wheat tour.

Instead of the traditional process, a small group of crop scouts surveyed hundreds of fields in Kansas between May 18 and May 21, and estimated environmental, disease and pest pressures and yield potential by region and for the whole state. These estimates represent a snapshot in time and are subject to change with environmental developments.

Stakeholders followed the tour closely through social media (#wheattour20) and in summaries conducted on the Zoom conference service at the end of each day. The event started with some trepidation as drought in the western third of the state, dryness in the state’s central corridor and broad freeze damage in April had raised concerns about what scouts would find.

“Overall, the crop was in better condition than I personally was expecting,” said Justin Gilpin, CEO, Kansas Wheat. “The last two weeks of moisture have really aided secondary tillers emerging in the central corridor and heads are filling with the added moisture.”

After three days of sampling, the state’s 2020/21 wheat crop potential (planted 2019) was estimated at 7.73 million metric tons (MMT), 7 percent below USDA’s May 12 estimate of 8.33 MMT and 16 percent below last year’s output of 9.20 MMT. The state’s average estimated wheat yield came in at 44.5 bu/acre (2.99 MT/ha), 14 percent below last year’s realized yield average of 52.0 bu/ acre (3.50 MT/ha).

According to Kansas Wheat, the state’s north-central district has been plagued by spring drought, and stripe rust and barley yellow dwarf are starting to emerge. The spring freeze also had a significant effect on the crop in that area. The tour estimated the average yield potential for north central Kansas at 41.1 bu/acre (2.76 MT/ha).

“Quality-wise, good rains will help with yield and test weights in the central corridor,” said Gilpin.

Image courtesy of KSU Wheat and Forage Extension Pathology.  

The crop looked better in northwest Kansas but was still variable. Jeanne Falk Jones, Multi-County Extension Agronomist, KSRE said, “April took a toll on the wheat crop this year with all the cold temperatures.”

She reported cosmetic leaf burn from cold temperatures on April 2 and 3, and again April 12 to 15. The area has suffered from drought stress, weed pressure due to thin stands, low pressure wheat streak mosaic virus, tan spot and stripe rust. The average yield potential was 51.7 bushels per acre (3.48 MT/ha).

In west-central and southwest Kansas, the driest parts of the state, the wheat is thin and short. Gary Millershaski, Kansas Wheat Commissioner from Lakin, Kan., reported that many acres of wheat had been abandoned due to extreme drought conditions in the spring and fall. In addition, planted acres were already down significantly in the area. He said only 30 percent to 40 percent of wheat in the area emerged before winter, which had a negative effect on yield potential.

Severe drought stress in the eastern part of Seward County, Kan. Photo courtesy of Romulo Lollato.

Buyers should keep in mind that crop yield and grain protein content are generally inversely related. Fields that were fertilized for 50.0 bu/acre (3.36 MT/ha) that end up with lower yields should produce a crop with higher protein levels.

Millershaski said, “I believe our quantity is going to be down a little bit, but I feel like our quality is going to be unbelievable.”

Calculated yield potential for west-central Kansas was 42.5 bu/acre (2.86 MT/ha), and the southwest Kansas estimate came in at 32.4 bushels per acre (2.18 MT/ha).

“It is amazing how the crop was still holding on, holding out hope for just one shot of rain. Cool night temperatures have helped the wheat from burning up. In those areas of 20 to 25-bushel wheat, if it catches a rain, it may run up to 35 bushel wheat, which is an amazing testament to the wheat varieties,” said Gilpin.

To see more information about the 2020 virtual wheat tour, click here.

Header Photo: Evidence of freeze damage in central Kansas. Photo courtesy of KSU Wheat and Forage Specialist, Romulo Lollato.

thumbnail

The new crop U.S. wheat harvest is underway in south Texas and U.S. Wheat Associates (USW) will publish its first “Harvest Report” for marketing year 2020/21 on Friday, May 29.

USW Harvest Reports are published every Friday afternoon, Eastern Daylight Time, throughout the season with updates and comments on harvest progress, crop conditions and current crop quality for hard red winter (HRW), soft red winter (SRW), hard red spring (HRS), soft white (SW) and durum wheat.

Anyone may subscribe to an email version of the “Harvest Report” at this link. USW includes links in the email to additional wheat condition and grading information, including the U.S. Drought Monitor, USDA/NASS Crop Progress and National Wheat Statistics, the official FGIS wheat grade standards and USDA’s World Agricultural Supply and Demand Estimates report. Harvest Reports are also posted online on the USW website here.

The weekly Harvest Report is a key component of USW’s international technical and marketing programs. It is a resource that helps customers understand how the crop situation may affect basis values and export prices.

USW’s overseas offices share the report with their market contacts and use it as a key resource for answering inquiries and meeting with customers. USW/Mexico City also publishes the report in Spanish.

USW wants to thank and acknowledge the organizations that make “Harvest Reports” possible, including:

  • California Wheat Commission Laboratory;
  • Durum Wheat Quality and Pasta Processing Laboratory, North Dakota State University (NDSU)
  • Great Plains Analytical Laboratory;
  • Plains Grains, Inc.;
  • State Wheat Commissions;
  • USDA/Federal Grain Inspection Service;
  • USDA/Foreign Agricultural Service;
  • USDA/Agricultural Research Service Hard Winter Wheat Quality Laboratory;
  • USDA/National Agricultural Statistics Service;
  • Wheat Marketing Center;
  • Wheat Quality & Carbohydrate Research, Department of Plant Sciences, NDSU;
  • Wheat Quality Council.


thumbnail

By Claire Hutchins, USW Market Analyst

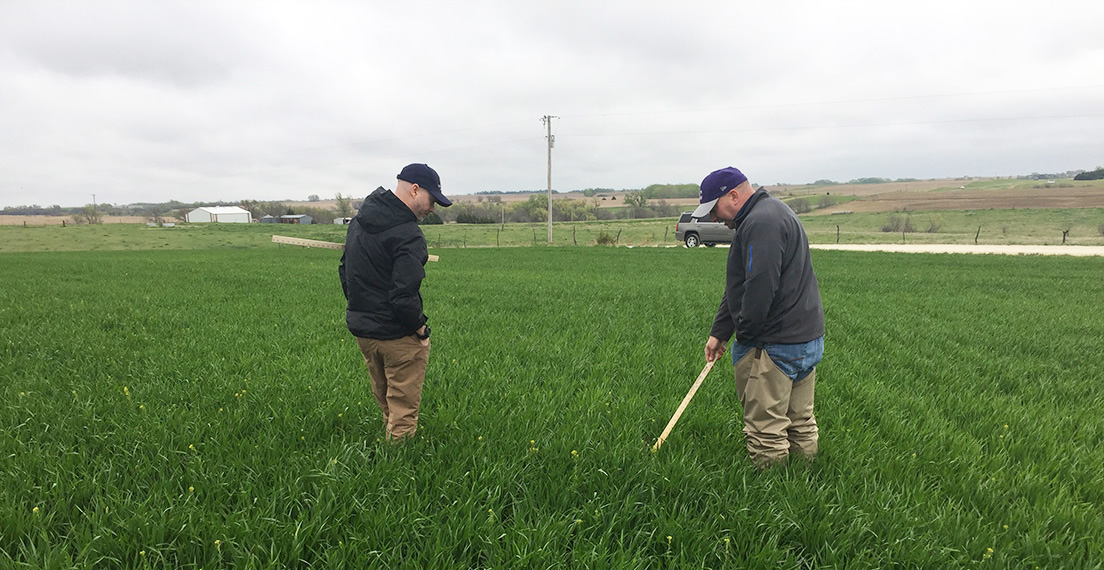
U.S. wheat farmers across the Northern Plains are hard at work trying to plant spring wheat for the 2020 harvest. Their efforts depend on widely varying regional conditions so many producers are behind schedule while some have pulled ahead.

USDA’s most recent crop progress report shows total U.S. spring wheat planting at 42 percent complete, slightly ahead of last year but well behind the 5-year average of 63 percent. Cool temperatures, overly wet field conditions and delayed field work from the 2019 harvest are slowing farmers down in northwestern Minnesota, eastern North Dakota and northeastern South Dakota. More favorable conditions are helping farmers progress across other parts of the Northern Plains.

According to USDA, only 40 percent of Minnesota spring wheat is planted, compared to the 5-year average of 67 percent. Most delays are in the northwestern part of the state.

“We’re only 15 to 20 percent planted in northwestern Minnesota where wetter conditions are slowing field work,” said Charlie Vogel, Executive Director of the Minnesota Wheat Research and Promotion Council.

Conditions are similar in eastern North Dakota.

According to Dr. Frayne Olson, Crop Economist and Marketing Specialist at North Dakota State University, eastern North Dakota had a very wet fall and not all of the region’s wheat, canola, corn and soybeans were harvested on time which pushed fall field work into spring 2020.

“Spring weather has remained cool and wet with very few days suitable for field work,” he said.

As of May 10, North Dakota spring wheat is only 27 planted compared to the 5-year average of 63 percent. Overly wet field conditions could drive farmers to opt for “Prevent Plant,” or fallow out, spring wheat acres. Farmers are eligible for crop insurance payments on fields when extreme conditions prevent them from planting the crop by a final, prescribed planting date.

“Even if some fields will be planted past the optimum seeding dates, there is still good yield potential,” Dr. Olson said. “Weather during the growing season will have a major impact on final yields and quality.”

In northeastern South Dakota, wet weather and colder soil temperatures are also delaying farmers’ ability to do spring field work. In this part of the state, farmers are also likely to Prevent Plant a portion of spring wheat acres. USDA estimates South Dakota producers will plant 850,000 acres (about 344,000 hectares) of spring wheat this year.

“At the beginning of the season, I thought we would come in a lot lower than USDA’s number due to overly wet field conditions, but recently, in the central part of the state, dealers sold of out spring wheat seed,” said Reid Christopherson, Executive Director of the South Dakota Wheat Commission. “Overall, we could end up close to USDA’s numbers.”

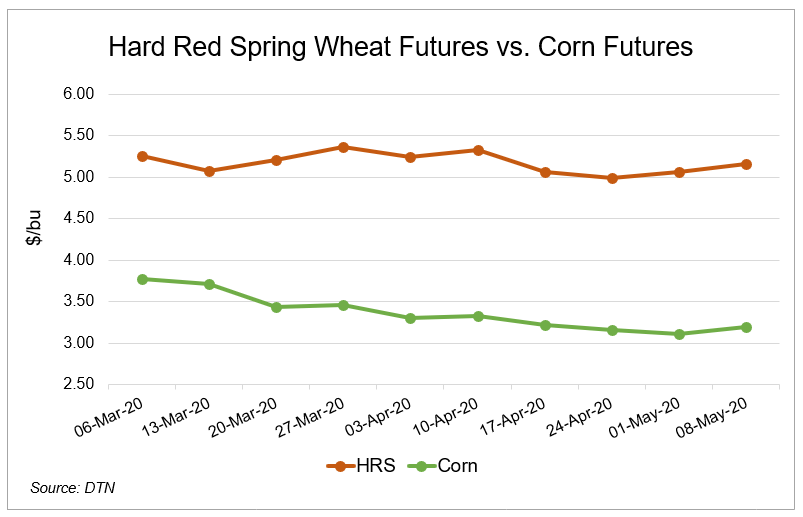
According to Christopherson, farmers are closely watching the decline in corn and ethanol demand and its impact on corn prices compared to spring wheat.

“Early in the planting window, producers may choose spring wheat over corn. Late in the planting window, they may choose soybeans,” said Christopherson.

Despite challenges in the eastern Northern Plains, spring wheat producers further west and south are making strong progress in the 2020 planting season.

“Warmer, drier weather, better harvest progress in fall 2019 and an earlier start are giving farmers a boost in central-western and southwestern Minnesota,” said Vogel.

About 85 percent of intended spring wheat acres are planted in that part of the state. Vogel estimates Minnesota’s southwestern region could add 50,000 “new” spring wheat acres this year (acres that would traditionally would have gone to either corn or soybeans) as producers explore spring wheat and cover cropping rotational opportunities that could add value to overall farm profitability.

“In the north, we saw record seed corn sales in January, but we have recently seen record seed corn returns so some of those acres will go to spring wheat,” said Vogel.

In late March, USDA estimated Minnesota producers would plant 1.35 million acres (about 546,000 hectares) of spring wheat, down 7 percent year-over-year, if realized. Given recent marketing and price challenges with corn and the interest in new crop rotation systems, Vogel estimates Minnesota producers could actually plant up to 1.44 million acres (about 583,000 hectares) of spring wheat this year, in line with 2019.

In western North Dakota, “Producers are seeing better progress due to warmer, drier conditions,” said Erica Olson, the North Dakota Wheat Commission’s Market Development and Research Manager. Despite the possibility for more Prevent Plant acres in the eastern part of the state, she believes North Dakota spring wheat acres could still reach USDA’s estimate of 6.10 million acres (about 2.5 million hectares) in 2020.

Favorable planting weather in central South Dakota is helping farmers get into the fields and plant more quickly than their peers in the northeastern part of the state. According to USDA, 75 percent of the state’s spring wheat is planted compared to 38 percent last year and the 5-year average of 78 percent.

Dry weather is helping Montana producers work through their spring wheat planting efforts. Though only 50 percent of the state’s spring wheat is in the ground compared to the 5-year average of 62 percent, progress is right in line with last year. Additionally, according to Cassidy Marn, Executive Vice President of the Montana Wheat and Barley Committee, Montana could see more spring wheat planted area than USDA’s initial estimate of 3.30 million acres (about 1.34 million hectares) due to potentially less acres planted to barley in 2020.

“We could easily reach 3.30 million acres this year, and I wouldn’t be surprised if we reached 3.40 to 3.50 million acres,” said Marn, which would be up to 1.42 million hectares.

thumbnail

For the first time in its 50-year history, the Wheat Quality Council (WQC) Hard Winter Wheat Tour has been cancelled this year due to the COVID-19 outbreak. U.S. Wheat Associates (USW) knows that its customers around the world look forward to the snapshot of new hard red winter (HRW) wheat crop yield potential the tour provides.

We want our customers to know that plans are being made to conduct a limited, virtual tour of the Kansas wheat crop during the week of May 18. Organizers are working with certified crop advisors, Extension agents, elevators, farmers and others in the field to make yield and quality observations of the crop and share information during the tour.

The organizers and USW will provide more information about the planned virtual hard winter wheat tour as soon as it is available. Stay tuned to #wheattour20 for future updates.

This week in Wheat Letter, USW Market Analyst Claire Hutchins shared information about challenges from freeze damage and increasingly dry conditions to the crop in the Central and Southern Plains. In addition, several state organizations report on new crop progress at the following links:

Colorado – https://coloradowheat.org/category/news-events/winter-wheat-crop-progress-report/

Kansas – https://twitter.com/KansasWheat/

Idaho – https://twitter.com/IdahoWheat

Montana – https://wbc.agr.mt.gov/Home/News

Nebraska – https://nebraskawheat.com/producers/crop-reports/

North Dakota – https://www.ndwheat.com/buyers/cropprogressreport

Oklahoma – https://twitter.com/OSU_smallgrains

South Dakota – https://sdwheat.org/

Texas – https://texaswheat.org/news-events/

thumbnail

By Claire Hutchins, USW Market Analyst

The condition of the U.S. hard red winter (HRW) wheat crop is not improving. Farmers – and the markets – are concerned about the threats to yield potential from wide-spread April freezes and increasing dryness across a significant portion of the Central and Southern Great Plains.

USDA’s most recent crop condition ratings reflect the weather effects on the 2020-21 winter wheat crop, reducing the total crop rated good to excellent from 62 percent to 57 percent. According to Romulo Lollato, Kansas State University Wheat and Forages Specialist, drought weakens winter wheat’s ability to recover from freeze damage and both conditions challenge winter wheat yield potential. So the change in ratings is focused on the HRW crop, based on the worsening dryness in north central and southwestern Kansas, eastern Colorado and south central Nebraska. And this week, the extent of freeze damage is being monitored carefully in the following states.

Kansas.  Between April 20 and April 27, USDA reduced its Kansas winter wheat rating from 46 good to excellent to 40 percent as localized freezes and expanding dryness threaten crop progress.

“About 50 to 60 percent of the state’s wheat was impacted to varying degrees by freeze damage,” said Lollato. In north-central Kansas, several counties showed varying but considerable freeze damage. According to researchers at Kansas State University, the crop in that region needs moisture soon to help with freeze damage recovery. In parts of central Kansas, late-sown fields, following a soybean crop, showed severe leaf and tiller damage from recent freeze events. In parts of northwestern Kansas, dry soil conditions predisposed plants to freeze damage and in some cases severely damaged fields turned yellow and brown as plant tissue deteriorated. Southwest Kansas is still extremely dry and could impact the crop’s ability to recover from freeze damage. Looking ahead, hot, dry temperatures across the state could further challenge the crop’s ability to recover from freeze damage.

Late-sown fields in north central Kansas showed severe leaf and tiller damage from recent freeze events. Photos courtesy of Romulo Lollato.

Colorado. “Our story is dryness – we need rain,” said Brad Erker, Executive Director of the Colorado Wheat Administrative Committee.

Several weeks ago, USDA rated 54 percent of Colorado’s winter wheat in good to excellent condition. As of April 27, only 37 percent of the state’s crop is in top condition. Moderate to severe drought plagues the eastern third of the state, where the winter wheat is grown. There is little evidence yet that freeze damage has impacted the crop, but reports are still developing. Looking ahead, high temperatures and no moisture in eastern Colorado could continue to pressure the state’s yield potential.

The April 23 UNL Drought Monitor showed a significant expansion of abnormal dryness and severe drought across the Central and Southern Plains, with dry conditions expanding in North Dakota and the Pacific Northwest.

Nebraska. HRW conditions in Nebraska are better than in Kansas and Colorado, with 69 percent of the crop rated good to excellent. However, freezing temperatures impacted wheat across the state. According to Sarah Morton, Agriculture Promotion Coordinator for the Nebraska Wheat Board, temperatures close to 10 degrees Fahrenheit (-12 degrees Celsius) in Nebraska’s southern Panhandle “knocked the wheat back and turned it brown,” slowing growth. Freezing temperatures in southwest Nebraska also burned back the wheat. Adequate soil moisture levels and warmer temperatures in the western part of the state are expected to help the crop recover from recent freezes. On April 23, the University of Nebraska – Lincoln Drought Monitor introduced abnormal dryness into the south-central portion of the state.

Oklahoma. Reports from Oklahoma show significant freeze damage in some of the state’s southwest and south-central counties. Some counties in southwestern Oklahoma reported freeze damage across 40 to 70 percent of the crop. In several extreme cases, some areas in south-central Oklahoma showed freeze damage in virtually every field. The April 23 Drought Monitor expanded areas under abnormal dryness and severe drought in the Oklahoma Panhandle. As of April 27, 62 percent of the state’s HRW is in good to excellent condition, down from 65 percent the week before, with expectations that the condition will continue to deteriorate.

“It’s an extremely challenging time for southwestern Oklahoma producers,” said Mike Schulte, Executive Director of the Oklahoma Wheat Commission.

Header photo courtesy of Romulo Lollato.

thumbnail

By Claire Hutchins, USW Market Analyst

According to the March 31 USDA Prospective Plantings report, U.S. total spring-planted wheat area is expected to fall to 12.6 million acres (5.1 million hectares), down 1 percent from 2019/20, if realized. This estimate includes 11.9 million acres (4.82 million hectares) of hard red spring (HRS), down slightly from last year. USDA expects U.S. durum planted area to total 1.29 million acres (522,000 hectares), down 4 percent from 2019/20. For all U.S. wheat, USDA now expects all wheat planted area for harvest in 2020 to total 44.7 million acres (18.1 million hectares), down 1 percent from 2019 and the lowest all wheat planted area since records began in 1919.

North Dakota farmers are expected to plant 6.10 million acres (2.47 million hectares) of HRS, 9% below last year. Last year’s overly wet field conditions affected HRS quality and led to significant cash price discounts at country elevators. According to Dr. Frayne Olson, Crop Economist and Marketing Specialist at North Dakota State University, farmers are “getting very frustrated with HRS quality discounts and the net price they receive at the elevator,” which he says is a disincentive for farmers to plant more HRS.

“I think the North Dakota HRS acreage number is a little low, but it may also reflect USDA concerns about Prevented Planting this spring,” said Dr. Olson. Farmers are eligible for crop insurance payments on fields when extreme conditions prevent them from planting a crop by a final, prescribed planting date, “There are areas in eastern North Dakota and western Minnesota that are going to have potential problems with Prevented Planting. However, that should not be an issue from central North Dakota to eastern Montana.”

The risk of quality challenges with HRS and more favorable marketing opportunities for soybeans compared to HRS also adds pressure to North Dakota HRS planted area. North Dakota producers are expected to plant 6.60 million acres (2.67 million hectares) of soybeans for harvest in 2020, up 18 percent from last year.

Of USDA’s prediction of reduced durum planted area, North Dakota Wheat Commission’s Market Development and Research Manager Erica Olson said, “North Dakota’s durum numbers surprised us a little bit, they were very low last year and we expected to see an increase this year.” USDA expects durum planted area in North Dakota to fall 11 percent on the year to 674,000 acres (273,000 hectares) as producers recoil from last year’s difficult, delayed harvest and cash price quality discounting.

Similar to the situation with HRS, North Dakota farmers are getting “very frustrated with durum quality cash price discounts” at North Dakota elevators, Dr. Olson said, “Farmers look at net income versus risk for growing each crop when deciding what to plant. If a farmer can raise Choice durum, net income is good. However, if you raise Ordinary durum, the math does not work. The risk to reward tradeoff has not been good the past several years.” Stable to slightly higher durum planted area in Canada adds pressure to U.S. durum prices which also discourages U.S. durum planted area.

In Minnesota, USDA predicts HRS planted area will fall 7 percent to 1.35 million acres (550,000 hectares), while soybean planted area will increase 8 percent to 7.40 million acres (3.0 million hectares) and corn planted area will increase 8 percent to 8.40 million acres (3.40 million hectares).

Charlie Vogel, Executive Director of the Minnesota Wheat Research and Promotion Council, has a slightly different opinion about the outlook for HRS.

“We expected HRS planted area to go down in Minnesota—two weeks ago, but it’s a different world now,” he said, citing the recent strong HRS futures rally attributed mainly to increased nearby domestic demand for bulk products.

“Given the futures rally, I now expect Minnesota HRS planted area could be in line with or slightly above last year’s acreage, if we get warm, dry planting conditions through spring,” said Vogel. However, if western Minnesota receives too much precipitation in the coming weeks, he does think farmers in certain areas may also be expected to make Prevented Planting claims for HRS.

Montana producers are expected to plant 3.30 million acres (1.34 million hectares) of HRS this spring, up 14% from last year and the highest since 2002.

According to Sam Anderson, Industry Analyst and Outreach Coordinator at the Montana Wheat and Barley Committee, “It is important to think about harvest and planting conditions last autumn: with lots of moisture, it was hard to get in the field and snow came very early. Those conditions explain most of the changes in this year’s prospective plantings estimate. Farmers were not able to get all their winter wheat in the ground last fall, resulting in the 400,000-acre (162,000-hectare) shift from winter wheat to spring wheat.”

Montana winter wheat planted area is down 20 percent on the year to 1.60 million acres (648,000 hectares).

Updated Winter Wheat Estimates

On March 31, USDA also made minor revisions to the country’s winter wheat planted area from its January forecast, which still hovers around 30.8 million acres (12.5 million hectares), down 1 percent from last year. The hard red winter (HRW) wheat planted area forecast fell slightly from January’s estimate to 21.7 million acres (8.79 million hectares). The soft red winter wheat planted area estimate increased slightly from January to 5.69 million acres (2.30 million hectares), up 9 percent from last year. The white winter wheat planted area forecast increased slightly from January to 3.42 million acres (1.38 million hectares). USDA expects total white wheat acres, planted in both winter and spring, to total 4.10 million acres (1.66 million hectares), in line with last year.

thumbnail

Over the years, U.S. Wheat Associates (USW) has described the value of U.S. wheat to overseas buyers, millers and wheat food processors in many ways. We have called it “the world’s most reliable choice.” We have suggested it is “the wheat you want from producers you can depend on.” And we have offered it as “high quality wheat for every need with unmatched service and value.”

What we have said about U.S. wheat is not an empty promise. Through seasons of surplus and scarcity, and wide variability in prices, USW continues to make this case because U.S. wheat farmers have consistently produced abundant supplies of excellent quality wheat that has earned an enduring reputation for reliability and value over many years.

Every year, productive U.S. wheat farm families produce enough wheat to fill dinner tables at home, and still have more than half their crops to share with milling and food industries around the world.

As part of our celebration of 40 years operating as USW, we remain true to the differential value of U.S. wheat in this simple expression: “Dependable People. Reliable Wheat.”

Ultimately, USW believes customers from around the world continue to turn to the United States for wheat because buying it carries less risk. U.S. wheat quality is predictable and the Federal Grain Inspection Service (FGIS), as an objective third party, certifies that all exported wheat meets import specifications. Their inspectors create a shipping log that is available to the buyer as an additional risk management tool.

The Federal Grain Inspection Service (FGIS), as an objective third party, certifies that all exported wheat meets import specifications.

The U.S. wheat store also offers six distinct classes that are proven specific, high-quality ingredients for any end-product need. Hard red winter, hard red spring, soft white, hard white, soft red winter wheat and durum each offer inherent quality and functional value.

That is reliable wheat.

Moreover, no other wheat seller does more than the United States to add value to its wheat through customer support. At its very base, this support comes from the farm families who take great care in producing the highest quality wheat in the most sustainable ways possible. They work hard each year to grow their farms, honor their family legacies and to ensure greater value for their customers at home and abroad.

In good years and bad, U.S. wheat farmers have supported USW’s effort to work directly with buyers to answer questions and resolve issues in purchasing, shipping or using their six classes of wheat. Their contributions to state wheat commissions who in turn contribute a portion of those funds to USW, which in turn qualifies USW to apply for export market development funds managed by USDA’s Foreign Agricultural Service.

With USW, buyers also get professional technical assistance, education, information and personalized consulting that help strengthen overseas milling, storage and handling, and end product industries.

The highest quality food for the world demands the highest quality wheat. For 40 years dependable people have made the difference.

Today, we remain fixed on the mission of the farmers who created an enduring legacy of commitment and partnership to provide the highest quality wheat for almost every customer need, backed by transparent pricing, trusted third-party certification and unmatched service before and after the sale.

Those are dependable people.

We invite our customers to join us in celebrating our 40th year as USW. We will continue to share the many ways in which the reliability of U.S. wheat and the dependability of U.S. farmers, USW, and our government and educational partners make a positive difference for our customers all over the world.


View video on Vimeo.

thumbnail

Pacific Northwest (PNW) farmers produced another fine soft white wheat (SW) and white club (WC) crop with good test weight and very acceptable finished product characteristics for 2019. Adequate soil moisture at planting and throughout the growing season did contribute to higher moisture and protein content compared to 2018 but protein remained lower than the 5-year average. In fact, the higher SW protein segment provides opportunities in blends for crackers, Asian noodles, steamed breads, flat breads, and pan breads. Variations in performance data for 2019 compared to 2018 and the 5-year averages are included below for this 6.09 million metric ton (MMT) crop, including 170,000 MT of WC.

That is a summary of results from the U.S. Wheat Associates (USW) 2019 SW and WC crop quality analysis to be posted soon at https://www.uswheat.org/market-and-crop-information/crop-quality/. To complete the analysis, the Wheat Marketing Center (WMC) received and tested SW and WC samples from Idaho, Oregon, and Washington. The Federal Grain Inspection Service (FGIS) graded and ran wheat protein on each sample. WMC conducted wheat, flour, Solvent Retention Capacity (SRC), dough, and finished product tests on composites based on production zones and protein levels. Funding for the annual survey come from state wheat commission USW members and the USDA Foreign Agricultural Service.

As always, buyers are encouraged to review their quality specifications to ensure that their purchases meet their expectations.

Wheat and Grade Data: The Overall average grade of the 2019 SW and WC crops is U.S. No. 1. The average SW test weight of 61.6 lb/bu (81.0 kg/hl) is slightly lower than last year’s 61.7 lb/bu (81.1 kg/hl); WC test weight of 60.6 lb/bu (79.7 kg/hl) is slightly higher than 2018’s 60.4 lb/bu (79.5 kg/hl). SW has fewer damaged kernels, fewer shrunken and broken kernels, and less foreign material than the 5-year averages. WC shrunken and broken kernel percentages are lower than last year and the 5-year averages. WC foreign material is higher than last year and 5-year averages. WC dockage is slightly higher than last year and the 5-year averages. Other WC grade factors are similar to past averages. Wheat moisture for both SW and WC is above last year and the 5-year averages.

The Overall SW and WC wheat protein content (12% mb) of 10.0 and 9.8%, respectively, are 0.7 and 0.8 percentage points above the respective 2018 values, but below those of 5-year averages. SW and WC wheat ash contents (14% moisture basis) are similar to last year and the 5-year averages. Thousand kernel weight for SW is above 2018 and the 5-year average levels; WC is lower than last year and higher than the 5-year average. SW kernel diameter is the same as last year, but larger than the 5-year average. WC kernel diameter is smaller than last year, but larger than the 5-year average. Falling number values are 317 sec for SW and 355 sec for WC.

Flour, Dough, and Bake Data: The 2019 Buhler Laboratory Mill flour extraction average for SW and WC at 72.1% and 72.8% respectively are lower than last year and the 5-year averages. Flour protein content (14% mb) is 8.9% for both SW and WC. Flour ash content (14% mb) for both SW and WC are higher than last year but the same as 5-year averages. Amylograph peak viscosity value for SW is 485 BU, slightly lower than last year; WC is 523 BU, much higher than last year. Starch damage value is slightly higher for SW than last year but lower than the 5-year averages. WC starch damage is lower than last year and the 5-year averages.

Solvent retention capacity (SRC) water values for SW and WC are less than last year and 5-year averages. SW lactic acid and sodium carbonate values are similar to last year and the 5-year averages. WC lactic acid values are higher than last year, but same as 5-year average. SW and WC gluten performance index (GPI) values are similar to last year and 5-year averages. SW farinograph peak and stability times are shorter than last year and the 5-year averages. WC peak time is slightly longer than last year and 5-year averages. SW and WC water absorptions are similar to last year, but less than the 5-year averages. The SW and WC alveograph L values are considerably longer than last year and 5-year averages. SW and WC extensograph resistance is larger than last year and the 5-year averages. SW and WC extensibility values are longer than last year and the 5-year averages.

Sponge cake volume for SW at 1104 cc is larger than last year, but smaller than the 5-year average, and the total score is slightly lower than last year and the 5-year averages. The sponge cake volume for WC at 1141 cc is slightly larger than last year, but smaller than the 5-year average, and total score the same as last year and much higher than the 5-year averages. SW and WC cookie diameter values are smaller than last year, but similar to the 5-year averages. SW and WC cookie spread factors are more than last year and the 5-year averages.

Chinese Southern-Type Steamed Bread: In southern-type steamed bread compared to a control flour, the 2019 SW and WC specific volumes are slightly less than last year and the 5-year averages. The SW total score is higher than last year and the 5-year averages; WC is the same as last year, but lower than the 5-year average.

thumbnail

Every year, several trade delegations of overseas buyers, millers, bakers and government officials visit the Pacific Northwest (PNW). Its proximity to many stops along the wheat supply chain allows customers to witness the reliability and transparency of the U.S. grain marketing system firsthand. This includes Padget Ranches, on the arid Columbia Plateau above the John Day River, where Darren Padget’s family has farmed since 1910. As one of many U.S. farm families who contribute to the wholesome quality of U.S. wheat for dozens of food products around the world, U.S. Wheat Associates (USW) traveled to Oregon to include Padget’s story and the PNW supply chain in a video it is producing. With previous visits to Kansas, Ohio, Washington state, North Dakota and Oklahoma the project will be completed in 2020 and include additional farm families and information about the U.S. wheat supply system.


Darren Padget

Darren Padget stops for an interview during seeding.

Today, Darren farms with his wife Brenda and their son Logan, as well as his dad Dale, a retired wheat farmer who recently participated in his 67th wheat harvest. Their dryland wheat and summer fallow rotation currently produces registered and certified seed on 3,400 acres annually. Darren started his involvement in wheat leadership with the Oregon Wheat Grower’s League and the National Association of Wheat Growers, before being appointed to the Oregon Wheat Commission by the state’s Director of Agriculture. Currently, he serves on the USW Board of Directors as Vice Chairman and is slated to serve as Chairman in 2020/21.

Darren Padget and USW Director of Communications Amanda Spoo

USW and the video crew also visited United Grain Corporation (UGC) in Vancouver, Wash., to speak with UGC President and CEO Augusto Bassanini – a long-time friend of USW – and capture footage of the receiving and export process at UGC’s export terminal. The team’s final stop on this trip was at the Federal Grain Inspection Service (FGIS) in Portland, Ore., to capture footage demonstrating the U.S. wheat industry’s differential advantage in its effort to consistent meet high quality grain standards.

USW with its video crew and creative agency, 502, at United Grain Corporation.

Capturing barge and rail footage along the Columbia River.

USW wants to thank Oregon Wheat’s Chief Executive Officer Blake Rowe and Director of Communications Shanna Hamilton for their help and participation in this project, as well as UGC and FGIS staff for hosting us at their facilities. And many thanks to the Padget family for graciously taking the time out of their day to share their story and welcome us to their ranch.

Federal Grain Inspection Service