thumbnail

By Steve Mercer, USW Vice President of Communications

Grown in the eastern United States, soft red winter (SRW) wheat is a profitable choice for producing confectionary products like cookies (biscuits), crackers and cakes, and to blend its flour for baguettes and other bread products. U.S. Wheat Associates (USW) wants to share some key points about SRW exportable supply in marketing year 2018/19 and look ahead to its potential for 2019/20.

1. Good Quality. While excessive rain on the 2018/19 SRW crop did slightly lower average test weight and falling number, protein (9.9% on 12% moisture basis, composite) is above average and DON level (0.7 ppm composite) is slightly below average. Processors should find good qualities for crackers and segments of the crop with good cookie and cake qualities. The higher protein and good extensibility in the crop should add value in blending for baking applications. See more information at https://www.uswheat.org/market-and-crop-information/crop-quality/.

2. Least Cost. SRW is the lowest cost milling wheat in the world today, offered at an average FOB export price of US$202 per metric ton* for June delivery from U.S. Gulf ports. The International Grains Commission in its March Grain Market Report estimated SRW FOB price at $211, which is $6 less than French soft wheat. SRW exportable supplies are also available from Lakes ports (Toledo, Ohio), and Atlantic ports (Norfolk, Virginia, and Wilmington, North Carolina). See more information at https://www.uswheat.org/market-and-crop-information/price-reports/.

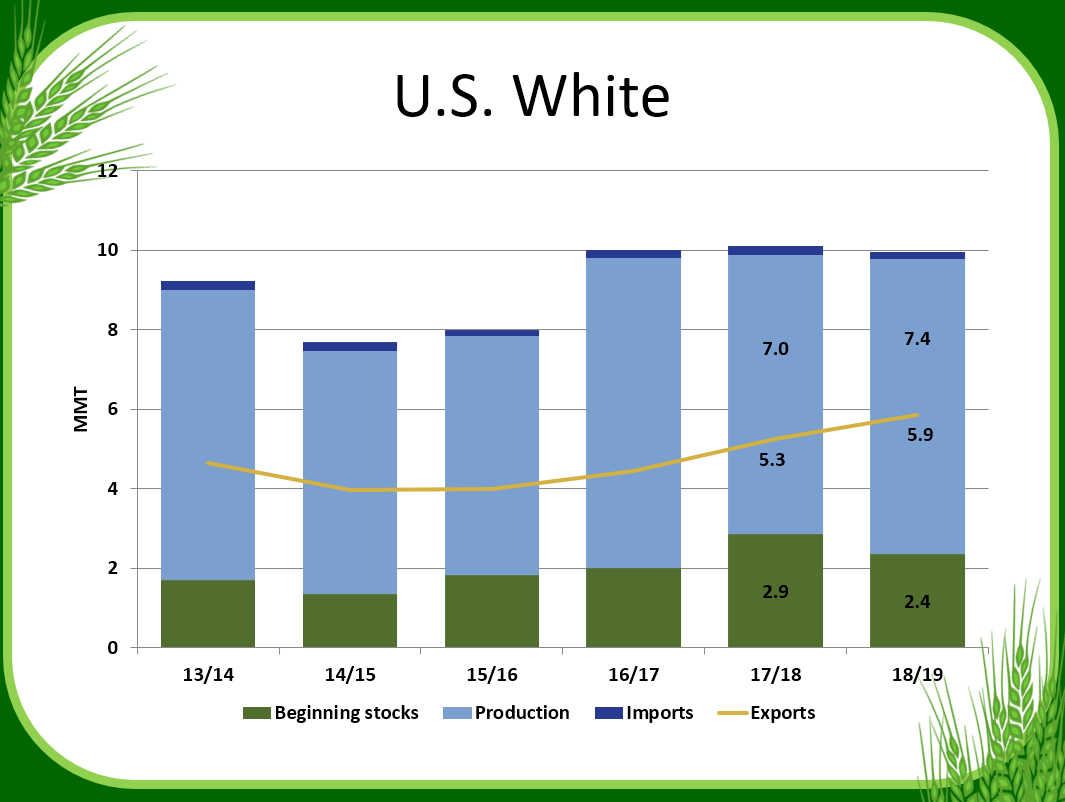
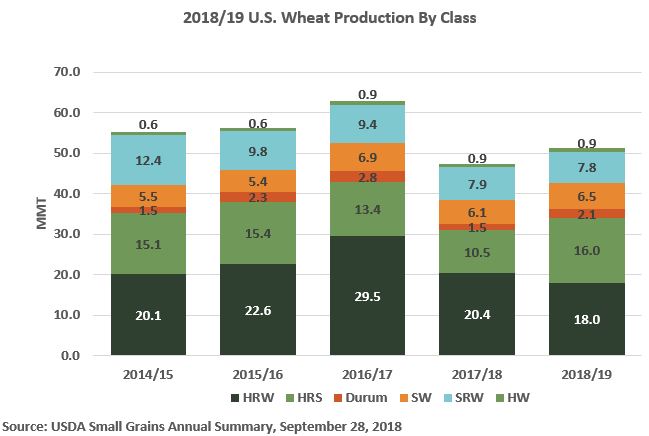
3. Supply is Down. Ending stocks of SRW have declined from 5.9 MMT in 2016/17 to USDA’s latest estimate of 4.6 MMT for 2018/19 (by comparison, SRW ending stocks in 2013/14 were 3.1 MMT after China imported 3.6 MMT that marketing year). Reduced supply relates to a near 50% decline in total production from 15.4 MMT in 2013/14 to USDA’s current estimate of 7.8 MMT in 2018/19, as well as an upturn in exports (see below). See more information at https://www.uswheat.org/market-and-crop-information/supply-and-demand/.

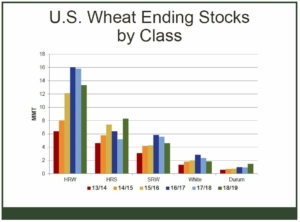
SRW ending stocks have declined steadily since 2016/17 on less production and more exports. Source: USDA

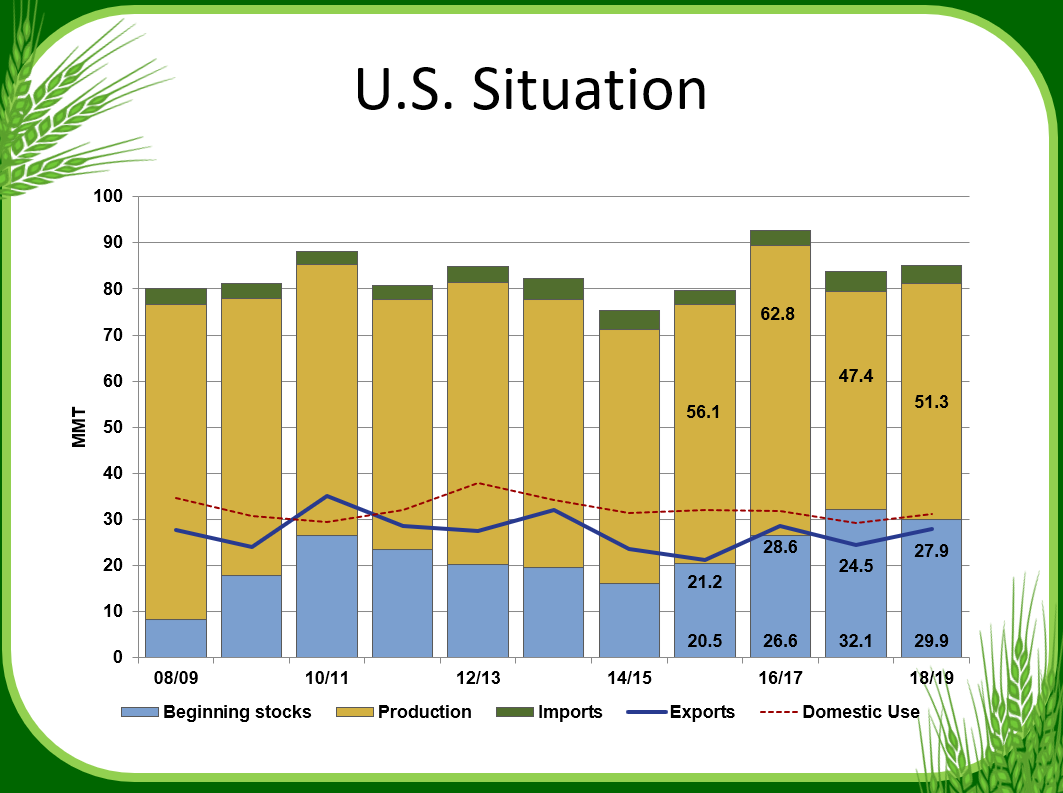
4. Demand is Up. As of April 4, SRW exports of 3.3 million metric tons (MMT) are 36% more than at the same time in marketing year 2017/18. This represents the most volume SRW sales year to date since 2014/15. Commercial SRW sales to Mexico, Colombia, Peru, Ecuador and Brazil are up significantly, as are imports by Central American and Caribbean countries and Nigeria. See more information at https://www.uswheat.org/market-and-crop-information/commercial-sales/.

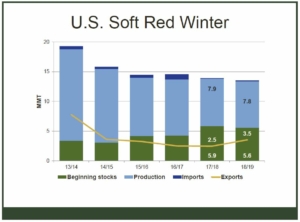
U.S. SRW wheat supplies are down; export demand takes an upturn. Source: USDA

5. Planted Area is Down. In February 2018, USDA reported that SRW seeded area for 2019/20 is 5.7 million acres (2.4 million hectares), or down 7% from last marketing year. Most of the states that typically produce the most exportable SRW supplies planted less. This decline is not more significant only because some farmers can harvest SRW and then quickly plant soybeans to get a double crop from the same acre. In general, U.S. crop farmers, who are driven by economic circumstances to minimize their net losses at best this year, are turning away from winter wheat to other crops that offer better returns. Total U.S. winter wheat seeded area for 2019/20 is at its second lowest level on record. See more information at https://www.nass.usda.gov/Publications/Todays_Reports/reports/wtrc0219.pdf.

*Source: USW Price Report, April 12, 2019

thumbnail

More than 90 U.S. wheat industry stakeholders will soon get a close-up view of the new wheat crop in Kansas, southern Nebraska, eastern Colorado and northern Oklahoma on the annual Wheat Quality Council (WQC) Hard Winter Wheat Tour April 29 to May 2. This tour and a second one in July focused on U.S. spring wheat are educational for the participants and news worthy as a first snapshot of each year’s new crops.

Tour participants come from as far away as Australia and represent all facets of the wheat industry, including millers, traders, media, farmers, researchers and government officials. By traveling across the region in scout teams that stop at random fields to evaluate crop progress and yield potential, they learn more what it takes for farmers to grow, manage, harvest and market the crop. U.S. Wheat Associates (USW) is sending two colleagues on the tour this year: Director of Programs Erica Oakley and Market Analyst Claire Hutchins.

Domestic and overseas buyers and end-produce processors pay close attention to personal observations and photos during the tour by following #wheattour19 on Twitter and Facebook, through summarized daily reports on Tuesday and Wednesday evenings and in the final report with an estimate of average yield per acre across the region.

The tour provides a statistically significant, early idea of what buyers can expect in new crop yields from the surveyed area. In 2018, for example, 24 WQC scout teams made evaluations at 644 fields and estimated average regional yield at 37 bushels per acre (49.2 kilograms per hectoliter). Official data from USDA’s National Agricultural Statistics Service estimated the average Kansas wheat yield in 2018 at 38 bushels per acre (50.5 kilograms per hectoliter). High Plains Journal posted more about the 2018 Hard Winter Wheat Tour by WQC Executive Vice President Dave Green at https://bit.ly/2XbAmu5.

Watch for observations from Anderson and Hutchins during this year’s tour on USW’s Facebook and Twitter pages and a full report of the 2019 tour May 2 in USW’s Wheat Letter blog.

thumbnail

By Claire Hutchins, USW Market Analyst

(Revised April 5, 2019)

According to the March 29 USDA Prospective Plantings report, U.S. total spring-planted wheat area will fall to an estimated 14.2 million acres (5.75 million hectares), 7% below 2018/19, if realized. The estimate includes 12.4 million acres of hard red spring (HRS), down 2% from last year, if realized. USDA expects U.S. durum planted area to total 1.42 million acres (575,000 hectares), 25% below 2018/19 and 30% below the 5-year average. Farmers in the top four spring wheat producing states of North Dakota, Montana, South Dakota, and Minnesota are expected to decrease total spring wheat planted area year over year on price and weather concerns.

USDA expects a 150,000 acre (61,000 hectare) increase in North Dakota HRS area from 2018 to 6.7 million acres (2.71 million hectares), a 7% increase over the 5-year average, if realized. At the same time, USDA expects the state to decrease its planted durum area by 32% from last year. Currently, HRS commands a premium over durum at local elevators, prompting the decline in North Dakota’s durum planted area from 1.10 million acres (445,000 hectares) in 2018 to 750,000 acres (304,000 hectares) in 2019. Farmer frustration is evident in recent planting trends. In 2019, 11% of North Dakota spring wheat acres will go to durum compared to 23% in 2017.

Dr. Frayne Olson, crop economist and marketing specialist at North Dakota State University, told U.S. Wheat Associates (USW) the increase in HRS over durum planted area in the past few years is driven by the inversion in cash premiums for both classes.

“Four years ago, in 2015, farmers received $1.90 per bushel more for durum than HRS. And three years ago, in 2016, the durum premium over HRS was $1.20 per bushel,” Dr. Olson said. “Now, HRS commands a premium of between $0.12 per bushel to $0.41 per bushel premium over the top durum grade.”

USDA forecast Montana spring wheat planted area at 2.60 million acres (1.05 million hectares), down 10% from 2018/19. According to Cassidy Marn, marketing program manager with the Montana Wheat & Barley Committee, farmers are on track to begin planting by the third week in April, barring an unforeseen weather event, but are seeking more profitable alternatives to spring wheat. However, Marn added, more profitable choices are difficult to find because “the pulse market isn’t strong, and neither is the market for durum.” Mike Krueger, an independent market analyst based in North Dakota, suggests Montana farmers are more likely to leave would-be spring wheat acres fallow than to plant alternative crops like dry peas or barley.

Minnesota HRS planted area is expected to decrease 5% from 2018/19 levels to 1.53 million acres (62,000 hectares). Krueger believes the state’s final area planted to HRS in 2019 will fall below the USDA’s estimate due to price and weather concerns.

“In the fall, there was a lot of enthusiasm for HRS because the initial 2019 CRC insurance price for spring wheat is $5.77.  That compares to $6.31 a year ago,” Krueger said.

He believes Minnesota farmers will convert more 2019 spring wheat acres to soybeans because, despite trade disputes with China, the domestic soybean market is firmer on average than the markets for corn and wheat. Soybeans may be the most viable alternative if record precipitation keeps Minnesota farmers out of the fields for the next 20 to 30 days, forcing them out of the ideal spring wheat planting window.

Competitive Soybeans. Comparing average and recent cash prices, relative stability can offer an incentive for farmers in North Dakota and Minnesota to plant more soybeans than spring wheat. This year, wet conditions could also favor more soybean planting. 


South Dakota 2019/20 HRS planted area is forecast at 1.02 million acres (41,000 hectares), down 3% from last year. Reid Christopherson, executive director of the South Dakota Wheat Commission, said the USDA’s estimate may be a little optimistic given current weather and price conditions in the state. In the fall, producers were enthusiastic about converting harvested soybean acres to winter wheat, before extremely wet conditions delayed harvest and winter planting. Then, he said, hope for strong wheat markets persisted into the spring until the “bomb cyclone” hit the state, leaving many would be HRS acres buried under 30 to 43 cm. of snow. Now, he expects, spring wheat planting in South Dakota to be delayed until the third or fourth week in April. Christopherson said, “Late planting and low market prices will prompt producers to plant more row crops in 2019 than spring wheat, despite earlier intentions.”

On April 1, USDA also updated the country’s winter wheat planted area from the February forecast. Total U.S. winter wheat area is now expected to hit 31.5 million acres (12.8 million hectares), up 200,000 acres (81,000 hectares) from the February forecast, but still 3% below the planted area for 2018/19 harvest. USDA now forecasts HRW planted area at 22.4 million acres (9.07 million hectares), up slightly from the previous projection, but still 3% below the year prior and 10% below the 5-year average on delayed planting. Soft red winter (SRW) planted area for 2019 harvest decreased from the previous estimate to 5.55 million acres (2.25 million hectares), 5% below 2018/19 planted area. The first USDA Crop Progress report of 2019, released April 1, indicated 56% of the country’s winter wheat to be in good to excellent condition.

USDA expects white wheat acres, planted in both winter and spring, to fall to 3.9 million acres (1.57 million hectares) for 2019/20, down 5% from 2018/19 and the 5-year average of 4.1 million acres (1.66 million hectares). The U.S. Drought Monitor shows adequate moisture for wheat-growing regions clustered in northeastern Oregon, southeastern Washington and north-central Idaho. However, central Washington and Oregon are experiencing abnormally dry to moderate drought conditions. Still, USDA reported that the majority of the white wheat crop in those three states is in good to excellent condition.

Planted area reductions for all classes bring the total wheat planted area for 2019 harvest down to 45.8 million acres (18.5 million hectares), 4% below 2018 and 7% below the 5-year average, making this year’s total wheat planted area the lowest since USDA records began in 1919.

thumbnail

Last week, an unusual combination of weather conditions created historic flooding in Eastern Nebraska, Western Iowa and parts of Northeast Missouri that literally wiped out many farms and ranches. In Western Nebraska, where most of the winter wheat in the state is grown, farmers suffered through a very bad blizzard at a time when wheat is normally coming out of dormancy.


Nebraska Gov. Pete Ricketts detailed more than $1.3 billion in damage to the state’s infrastructure, agriculture, businesses and homes on March 20. That estimate includes $400 million in projected livestock losses and $440 million in crop losses, including large volumes of stored grain. Tragically, a farmer in Eastern Nebraska, James Wilke, lost his life trying to help others during the flood.


This is happening at a very challenging time for many farmers facing low commodity prices and rising levels of debt.


“There’s not many farms left like this, and it’s probably over for us too, now,” Anthony Ruzicka, a farmer and rancher near Verdigre, Neb., said to the New York Times. “Financially, how do you recover from something like this?”


Royce Schaneman, Executive Director of the Nebraska Wheat Board, told U.S. Wheat Associates (USW) that wheat farmers did not suffer the worst of the storm, although some had livestock losses in the blizzard. Looking ahead, the long-lasting winter of 2019 increases the chance of flooding along the Red River that borders Minnesota and North Dakota and flows into Canada’s Manitoba province — and that is spring wheat country.


The federal government is developing a response to last week’s disaster. USDA Secretary Sonny Perdue sent this Tweet recently: “We are on the job helping folks in the Midwest get back on their feet and recover from these devastating floods. Farmers can expect assistance from a variety of programs we offer in the wake of disasters. More here: https://www.farmers.gov/recover.”


Other ways to help those affected by the storm include the Nebraska Farm Bureau’s Disaster Assistance Exchange that accepts donations and helps match donors with those in need.


Farmers and ranchers gladly accept the inherent risk of their work and suffer with those who experience these storms. Everyone else, including our colleagues from USW and the National Association of Wheat Growers, and our customers around the world cannot forget how much we all depend on the people who produce our food.


thumbnail

By Vince Peterson, USW President

Recently, I was searching online for some wheat market information to share at an upcoming meeting. I saw a headline that asked: “What country exports the most wheat?” Great, I thought, here we go again with more propaganda about Russia beating the United States in the global wheat export market contest.

Instead, I was quite pleased to scroll down to find that the United States was still the world’s largest wheat exporter in 2017 in terms of “value” according to the “World’s Top Exporters.” Russia produced almost twice the volume of wheat than the United States and more than matched U.S. export volume that year; but at an estimated $6.1 billion, U.S. wheat exports generated $300 million more value than Russian wheat exports.

The reason is clear: there are many private and public wheat buyers, millers and processors around the world that prefer the quality, variety and value of U.S. wheat; and that remains a primary asset to our farmers.

U.S. Wheat Associates (USW) has adjusted its allocation of wheat farmer dollars and program funds from USDA’s Foreign Agricultural Service to activities in markets that have a growing need for a variety of flour products with high quality functional characteristics. There our differential advantages shine through and where the investment offers the most return. On the other hand, USW continues to provide the trade servicing needed in the more cost-sensitive markets that are buying Russian wheat. There is value there, too, with a market environment like today’s in which the price spread between U.S. wheat classes and Black Sea supplies has narrowed. We continue to provide technical support to those buyers to demonstrate and build more knowledge about the true functional value of U.S. wheat. In addition, we are strong advocates for continuous improvement in wheat quality.

Looking ahead, I believe this is the right position for U.S. wheat in a global market with growing income levels, increasing urbanization and record setting consumption every year. It also reflects our mission: to enhance wheat’s profitability for U.S. producers and its value for their customers.


USW President Vince Peterson

thumbnail

By Claire Hutchins, USW Market Analyst

U.S. Wheat Associates (USW) reports on global wheat supply and demand to its farmer directors at each of their board meetings. The directors meet in Washington, D.C., the week of Feb. 11 and the report will include the following update on marketing year 2018/19 wheat production, with one exception: the latest U.S. supply and demand data will be added after USDA issues catch-up reports on Feb. 8.

Canada. In its January “Principle Field Crops” report, Agriculture and Agri-Food Canada (AAFC) tallied total 2018/19 Canadian wheat production at 31.8 million metric tons (MMT) (1.20 billion bushels), up 6 percent year over year. AAFC estimated the average yield for all wheat was 3.22 MT/ha (47.9 bu/acre). That is down 4 percent from 2017/18 though significantly offset by a 10 percent increase in harvested area to 9.90 million hectares (24.5 million acres). Production of all wheat excluding durum increased 4 percent from 2017/18 levels to 26.0 MMT due to increased harvested area, despite slightly lower yields in 2018/19.

Increased planted area helped push durum production up by 16 percent to 5.70 MMT, while quality decreased slightly. The Canadian Grains Commission (CGC) reported 85 percent of the Canadian Western Amber Durum (CWAD) samples tested graded No. 1 or No. 2 CWAD, compared to 91 percent in 2017/18. For Canadian Western Red Spring (CWRS), CGC reported 56 percent of samples were No. 1 CWRS, compared to 78 percent in 2017/18. The percentage of samples tested as feed grade increased to 11 percent compared to last year’s 4 percent.

AAFC expects 2018/19 Canadian total wheat exports (including durum) to reach 22.9 MMT, up 5 percent from last year if realized.

European Union. Stratégie Grains (SG) forecasted total European Union (EU) wheat production at 136 MMT, down 11 percent year over year due to adverse weather conditions and decreased harvested area. Total EU harvested wheat area fell 2 percent year over year and total average yields for the region fell 9 percent. Common (non-durum) wheat production fell 10 percent from 2017/18 levels to 127 MMT due to significant weather challenges in Germany, France, and the Baltic countries.

Durum production fell 7 percent to 8.60 MMT in 2018/19, however this year’s total still sits slightly above the 5-year average of 8.50 MMT. SG noted that Italian durum yields were their lowest since 2010 at 3.09 MT/ ha (46.0 bu/acre), and the situation was exacerbated by a low-protein harvest that failed to match the excellent quality recorded in 2017. French durum yields were also the lowest they have been since 2011, not counting the disastrous harvest recorded in 2016.

SG expects total EU wheat exports to fall to 19.2 MMT, down 18 percent year over year, if realized due to increased animal feed consumption, following poor quality harvest years in Spain and France, and decreased overall supplies.

Australia. The Australian Bureau of Agricultural and Resource Economics and Sciences (ABARES) forecasted 2018/19 wheat production at 17.0 MMT, its lowest volume since 2007/08 due to extreme drought in New South Wales and Queensland. Wheat exports will decrease sharply year over year due to lower production and increased demand for domestic feed supplies. Domestic demand for feed wheat, due to forage pressure on livestock herds, is expected to increase 20 percent year over year to 5.0 MMT. ABARES estimates total Australian wheat exports will fall 31 percent below 2017/18 levels and 40 percent below the 5-year average, down to 10.6 MMT.

Argentina. Bolsa de Cereales, the Buenos Aires Grain Exchange, reported a record Argentinian harvest of 19.0 MMT, despite concerns in late December 2018 that yield and quality could suffer from hard rains and hail storms. Final average yields are right in line with the 5-year average at 3.10 MT/ha (46.2 bu/acre) but fall below last year’s 3.20 MT/ha (47.7 bu/acre). Total production is up 10 percent from 2017/18 with increased planted and harvested area, which offset lower yields. Planted area increased 9 percent year over year to 6.0 million hectares (14.8 million acres). USDA expects 2018/19 Argentina wheat exports to total 14.2 MMT, 15 percent above last year’s export volume and 40 percent above the 5-year average, if realized.

Black Sea. SG estimated Russian wheat production at 72.0 MMT, down 18 percent from last year’s 85.0 MMT due to decreased harvested area and notably lower yields across the board. Russia’s harvested area dropped by 5 percent year over year to 26.3 million hectares (65.0 million acres) and average yields decreased by 12 percent to 2.73 MT/ha (40.6 bu/acre). Most significant yield losses were reported in Russia’s southeastern Volga region, which fell 33 percent below last year’s figures. Though Russian production fell significantly below 2017/18 levels, this year’s 72.0 MMT still lands 3 percent higher than the 5-year average of 70.0 MMT. The Russian Ministry of Agriculture readjusted its 2018/19 total wheat export estimates to 36.0 MMT, a 12 percent drop from 2017/18 export levels, if realized. As of late January 2019, IKAR reported total Russian exports at 26.2 MMT, or 73 percent of the country’s total expected export volume. SG estimates that the influence of Russia’s decreased production and exports will bolster global wheat prices until the start of MY 2019/20.

The State Statistics Service of Ukraine (SSSU) estimated the 2018/19 wheat harvest at 24.6 MMT, right in line with the 5-year average, but down 8 percent from last year’s record harvest due to decreased yields which offset increased harvested area. SG reports Ukraine’s 2018/19 average yield at 3.72 MT/ha (55.3 bu/acre), 7 percent below last year’s record of 4.16 MT/ ha (61.9 bu/acre). Ukraine’s Ministry of Agriculture tallied total wheat exports, as of late January 2019, at 11.2 MMT. Last year, the Ukrainian government issued a memorandum establishing a 2018/19 export ceiling at 16.0 MMT, its lowest export volume since 2014/15, if realized.

SG estimated Kazakh wheat production at 14.3 MMT, down slightly from last year due to decreased harvested area. However, the Kazakh Agriculture Ministry estimated the country will export a record 9.0 MMT in 2018/19, 1.20 MMT more than left the country last year. If realized, this year’s total Black Sea exports from all three countries will amount to 61.0 MMT, down 12 percent from last year, but still 11 percent above the 5-year average.

By Stephanie Bryant-Erdmann, USW Market Analyst

USDA expects global wheat consumption to remain at record high levels in 2018/19 due to increased human consumption. Human wheat consumption is expected to reach a record high 602 million metric tons (MMT), 4 percent above the 5-year average. Over the past ten years, global human wheat consumption has increased 90 MMT, while feed wheat usage has increased 16 MMT.

However, the global supply of milling wheat is expected to fall this year due to challenging growing and harvesting conditions that hurt both quality and yields in many of the major wheat exporting countries. USDA expects global wheat production to fall to the lowest level in 5 years at 734 MMT, down 4 percent from the record high of 763 MMT in 2017/18. If realized, it would be 1 percent below the 5-year average and the first-time global wheat consumption has exceed global wheat production since 2012/13.

The decline in global wheat production is due to decreased production in half of the major wheat exporting countries including the European Union (EU), Russia, Australia and Ukraine. If realized, Russian wheat production would still the third highest on record, but Australian wheat production is expected to fall its lowest level since 2007/08.

Australian wheat production is expected to fall 18 percent year over year to 17.5 MMT due to consecutive years of devastating drought in New South Wales and Queensland where Australian Prime Hard (APH) and Australia Hard (AH) production is centralized. Increased wheat production in Western Australia is expected to partially offset the decrease from the rest of the country. Australian wheat harvest typically occurs in December. USDA expects Australian exports to decrease to 11.5 MMT, 35 percent below the 5-year average and also the lowest level since 2007/08.

With exportable wheat supplies (production plus beginning stocks minus domestic consumption) decreasing in half of the world’s major exporters, USDA expects the United States to have the largest exportable supply of wheat in the world in 2018/19 at 49.9 MMT.

As a consequence, USDA expects 2018/19 U.S. wheat exports to reach 27.9 MMT, up 14 percent from 2017/18 and 7 percent above the 5-year average, if realized. Still, U.S. wheat export sales pace will need to increase to meet this goal, as year-to-date U.S. wheat export sales total just 13.8 MMT or 49 percent of USDA’s anticipated total.

To learn more about 2018 U.S. wheat quality, visit the USW Crop Quality page.

thumbnail

By Stephanie Bryant-Erdmann, USW Market Analyst

This week, U.S. Wheat Associates (USW) holds its 2018 Fall Board of Directors meeting. At each board meeting, the USW Market Analyst presents an update on world and U.S. wheat supply and demand factors based on information from the U.S. Department of Agriculture, as of Oct. 11, 2018. Following are some highlights from the current report to the board.

  • 2018/19 global wheat production to fall for first time in 5 years.
  • Global supplies estimate to fall to 1,006 million metric tons (MMT); down 1 percent from the 2017/18 record.
  • Wheat production in Australia to fall to 18.5 MMT, 26 percent below the 5-year average.
  • U.S. wheat production estimated at 51.3 MMT, 8 percent above 2017/18.


  • Consumption forecast at a record 746 MMT, 4 percent above the 5-year average.
  • Chinese domestic consumption expected to reach 122 MMT, 5 percent above the 5-year average.
  • U.S. domestic consumption to grow 6 percent year over year to 31.1 MMT.


  • World wheat trade projected at 180 MMT, 4 percent above the 5-year average.
  • Australian exports to drop to 13.0 MMT, 10 percent below 2017/18, and the lowest level since 2007/08.
  • Exports from Russia to fall 15 percent year over year 35.0 MMT, still 28 percent above the 5-year average.
  • U.S. 2018/19 exports to increase to 27.9 MMT, up 14 percent from 2017/18, if realized.


  • World beginning stocks estimated at record 275 MMT, up 7 percent year over year.
  • Beginning stocks in Argentina forecast at 1.00 MMT, down 42 percent the 5-year average.
  • U.S. beginning stocks will fall to an estimated 29.9 MMT, 7 percent below 2017/18 levels.


  • Global ending stocks projected at 260 MMT, 5 percent below the record 2017/18 level, if realized.
  • Estimated Chinese ending stocks of 136 MMT account for 52 percent of global ending stocks.
  • Exporter ending stocks forecast at 58.8 MMT, down 24 percent year over year.
  • Ending stocks in importing countries to fall to 65.6 MMT, 15 percent below the 5-year average of 76.8 MMT.


  • Total U.S. wheat export sales for 2018/19 predicted to reach 27.9 MMT.
  • As of Oct. 11, 2018/19, U.S. wheat export sales were 18 percent behind last year’s pace.
  • About 27 percent of that difference represents temporary loss of the Chinese market.
  • Sales of soft red winter and durum are ahead of last year’s pace.


thumbnail

By Stephanie Bryant-Erdmann, USW Market Analyst

USDA updated its monthly World Agricultural Supply and Demand Estimates (WASDE) on Oct. 11, showing the United States to have the largest exportable supply of wheat in the world in 2018/19 following devastating losses in the European Union (EU) and Australia, and decreased production in Russia. Due to the decreasing exportable wheat supplies in these three countries (production plus beginning stocks minus domestic consumption), USDA expects the United States to have the largest exportable supply of wheat in the world in 2018/19 at 50.1 million metric tons (MMT).

Decreased production in half of the major exporting countries — Australia, the EU, Russia and Ukraine —   will result in global wheat production decreasing to 731 MMT, down 4 percent year over year and the lowest level since 2014/15, if realized. While global wheat production will fall for the first time in 5 years, USDA noted that global wheat consumption will reach a new record high of 746 MMT, 4 percent above the 5-year average.

Drought devastated wheat areas in the EU earlier this year and has now spread south to Australia.  USDA expects Australian total wheat production to fall to 18.5 MMT, 13 percent below last year and 26 percent below the 5-year average. Smaller Australian wheat production is also expected to result in 2018/19 Australian wheat exports falling to 13.0 MMT. If realized, that would be the lowest level of Australian exports since 2007/08, 26 percent below the 5-year average.

With Australian wheat exports decreasing sharply year-over-year, USDA expects U.S. white wheat exports to increase 11 percent from 2018/19 to 5.85 MMT, the highest level since 2011/12.

USDA expects 2018/19 U.S. wheat exports to reach 27.9 MMT, up 14 percent from 2017/18 and 7 percent above the 5-year average, if realized. Exports of five of the six U.S. wheat classes are expected to increase year-over-year, and hard red winter (HRW) exports are expected to remain above the 5-year average. Still, U.S. wheat export sales pace will need to increase to meet this goal, as year-to-date U.S. wheat export sales total just 11.6 MMT or 42 percent of USDA’s anticipated total.

thumbnail

By Stephanie Bryant-Erdmann, USW Market Analyst

On Sept. 28, USDA released its Small Grains Summary noting that 2018/19 U.S. wheat production increased to 51.3 MMT, up 8 percent from last year due to improvements in both average yield and harvested area. While this is still 8 percent below the 5-year average of 55.8 MMT, the 2018/19 production coupled with significant carry-in stocks ensure that the U.S. wheat store will remain open and well-stocked throughout 2018/19. Here is a look at 2018/19 U.S. wheat production by class.

Hard red winter (HRW). Last fall, U.S. farmers increased HRW planting in the U.S. Southern Plains due to favorable moisture conditions. That slight increase was not enough to offset decreased planted area in the U.S. Northern Plains where a long-term drought delayed, and in some cases, prevented winter wheat planting. Planted area in Montana fell 6 percent year over year. USDA reported HRW planted area at 23.2 million acres (9.39 million hectares), down 2 percent from 2017. Unfortunately, most of the Southern Plains received little to no moisture until spring, with some areas going from October to April without measurable precipitation. The poor weather caused Oklahoma wheat farmers to abandon 43 percent of their winter wheat area, up from both the 5-year average and the 2017/18 abandonment rate of 36 percent. The average HRW yield in Kansas and Oklahoma, the top two HRW-producing states, decreased 21 percent and 18 percent from 2017/18, respectively. With the drought causing both harvested area and average yields to fall, USDA estimates total 2018/19 HRW production dropped 12 percent to 662 million bushels (18.0 MMT). Though smaller in volume, 2018 HRW quality i is excellent. Read more here.

Hard red spring (HRS). Wet conditions slowed HRS planting but replenished depleted soil moisture across the drought stressed Northern Plains. USDA says U.S. farmers planted 12.1 million acres (4.90 million hectares) to HRS, up 17 percent from the year prior. The beneficial moisture boosting average HRS yields and harvested area. In North Dakota, the top HRS producing state, the average yield climbed 20 percent year over year to a record high 49.0 bu/acre (3.29 MT per hectare), up 41 percent from 2017/18. Idaho farmers also produced record high HRS yields. USDA now reports HRS production at 587 million bushels (16.0 MMT), up 53 percent from 2017/18.

Soft red winter (SRW). Last fall, U.S. farmers planted 5.85 million acres (2.37 million hectares) of SRW, up 4 percent from the year prior, but still 23 percent below the 5-year average. While planting conditions were generally favorable, depressed prices kept planted area low. In early 2018, several U.S. SRW growing areas received excessive moisture that decreased yield potential and the wet weather continued through harvest. USDA reported SRW production totaled 286 million bushels (7.78 MMT), down 2 percent from 2017/18 and 33 percent below the 5-year average of 429 million bushels (11.7 MMT). Read more here.

White wheat (including soft white, club and hard white). U.S. white wheat planted acres stayed close to the 5-year average at 4.15 million acres (1.68 million hectares) in 2018/19. A wet winter boosted yield potential for both the winter and spring crops. The average spring white wheat yield in Washington increased 20 percent to 54.0 bu/acre (3.63 MT per hectare). The slight increase in harvested area and significant improvement in average yields pushed 2018/19 total white wheat production to 272 million bushels (7.41 MMT), a 5 percent increase year over year, and 8 percent above the 5-year average of 252 million bushels (6.86 MMT).

Durum. Farmers planted less durum area this year in response to lower prices and large carry-out stocks during spring planting. USDA estimates 2.00 million acres (810,000 hectares) were planted to durum, down 13 percent from 2017/18 but still 9 percent above the 5-year average of 1.84 million acres (745,000 hectares). USDA estimated total 2018/19 U.S. durum production at 77.3 million bushels (2.10 MMT), up 41 percent from last year. Generally favorable weather boosted yields in the U.S. Northern Plains, with average durum yields increasing to 39.3 bu/acre (2.64 MT per hectare), up 13.3 bu/acre from last year when drought severely impacted the crop. Desert Durum® production fell 8 percent year over year to 10.5 million bushels (385,000 MT) due to sharply lower planted area in both Arizona and California.