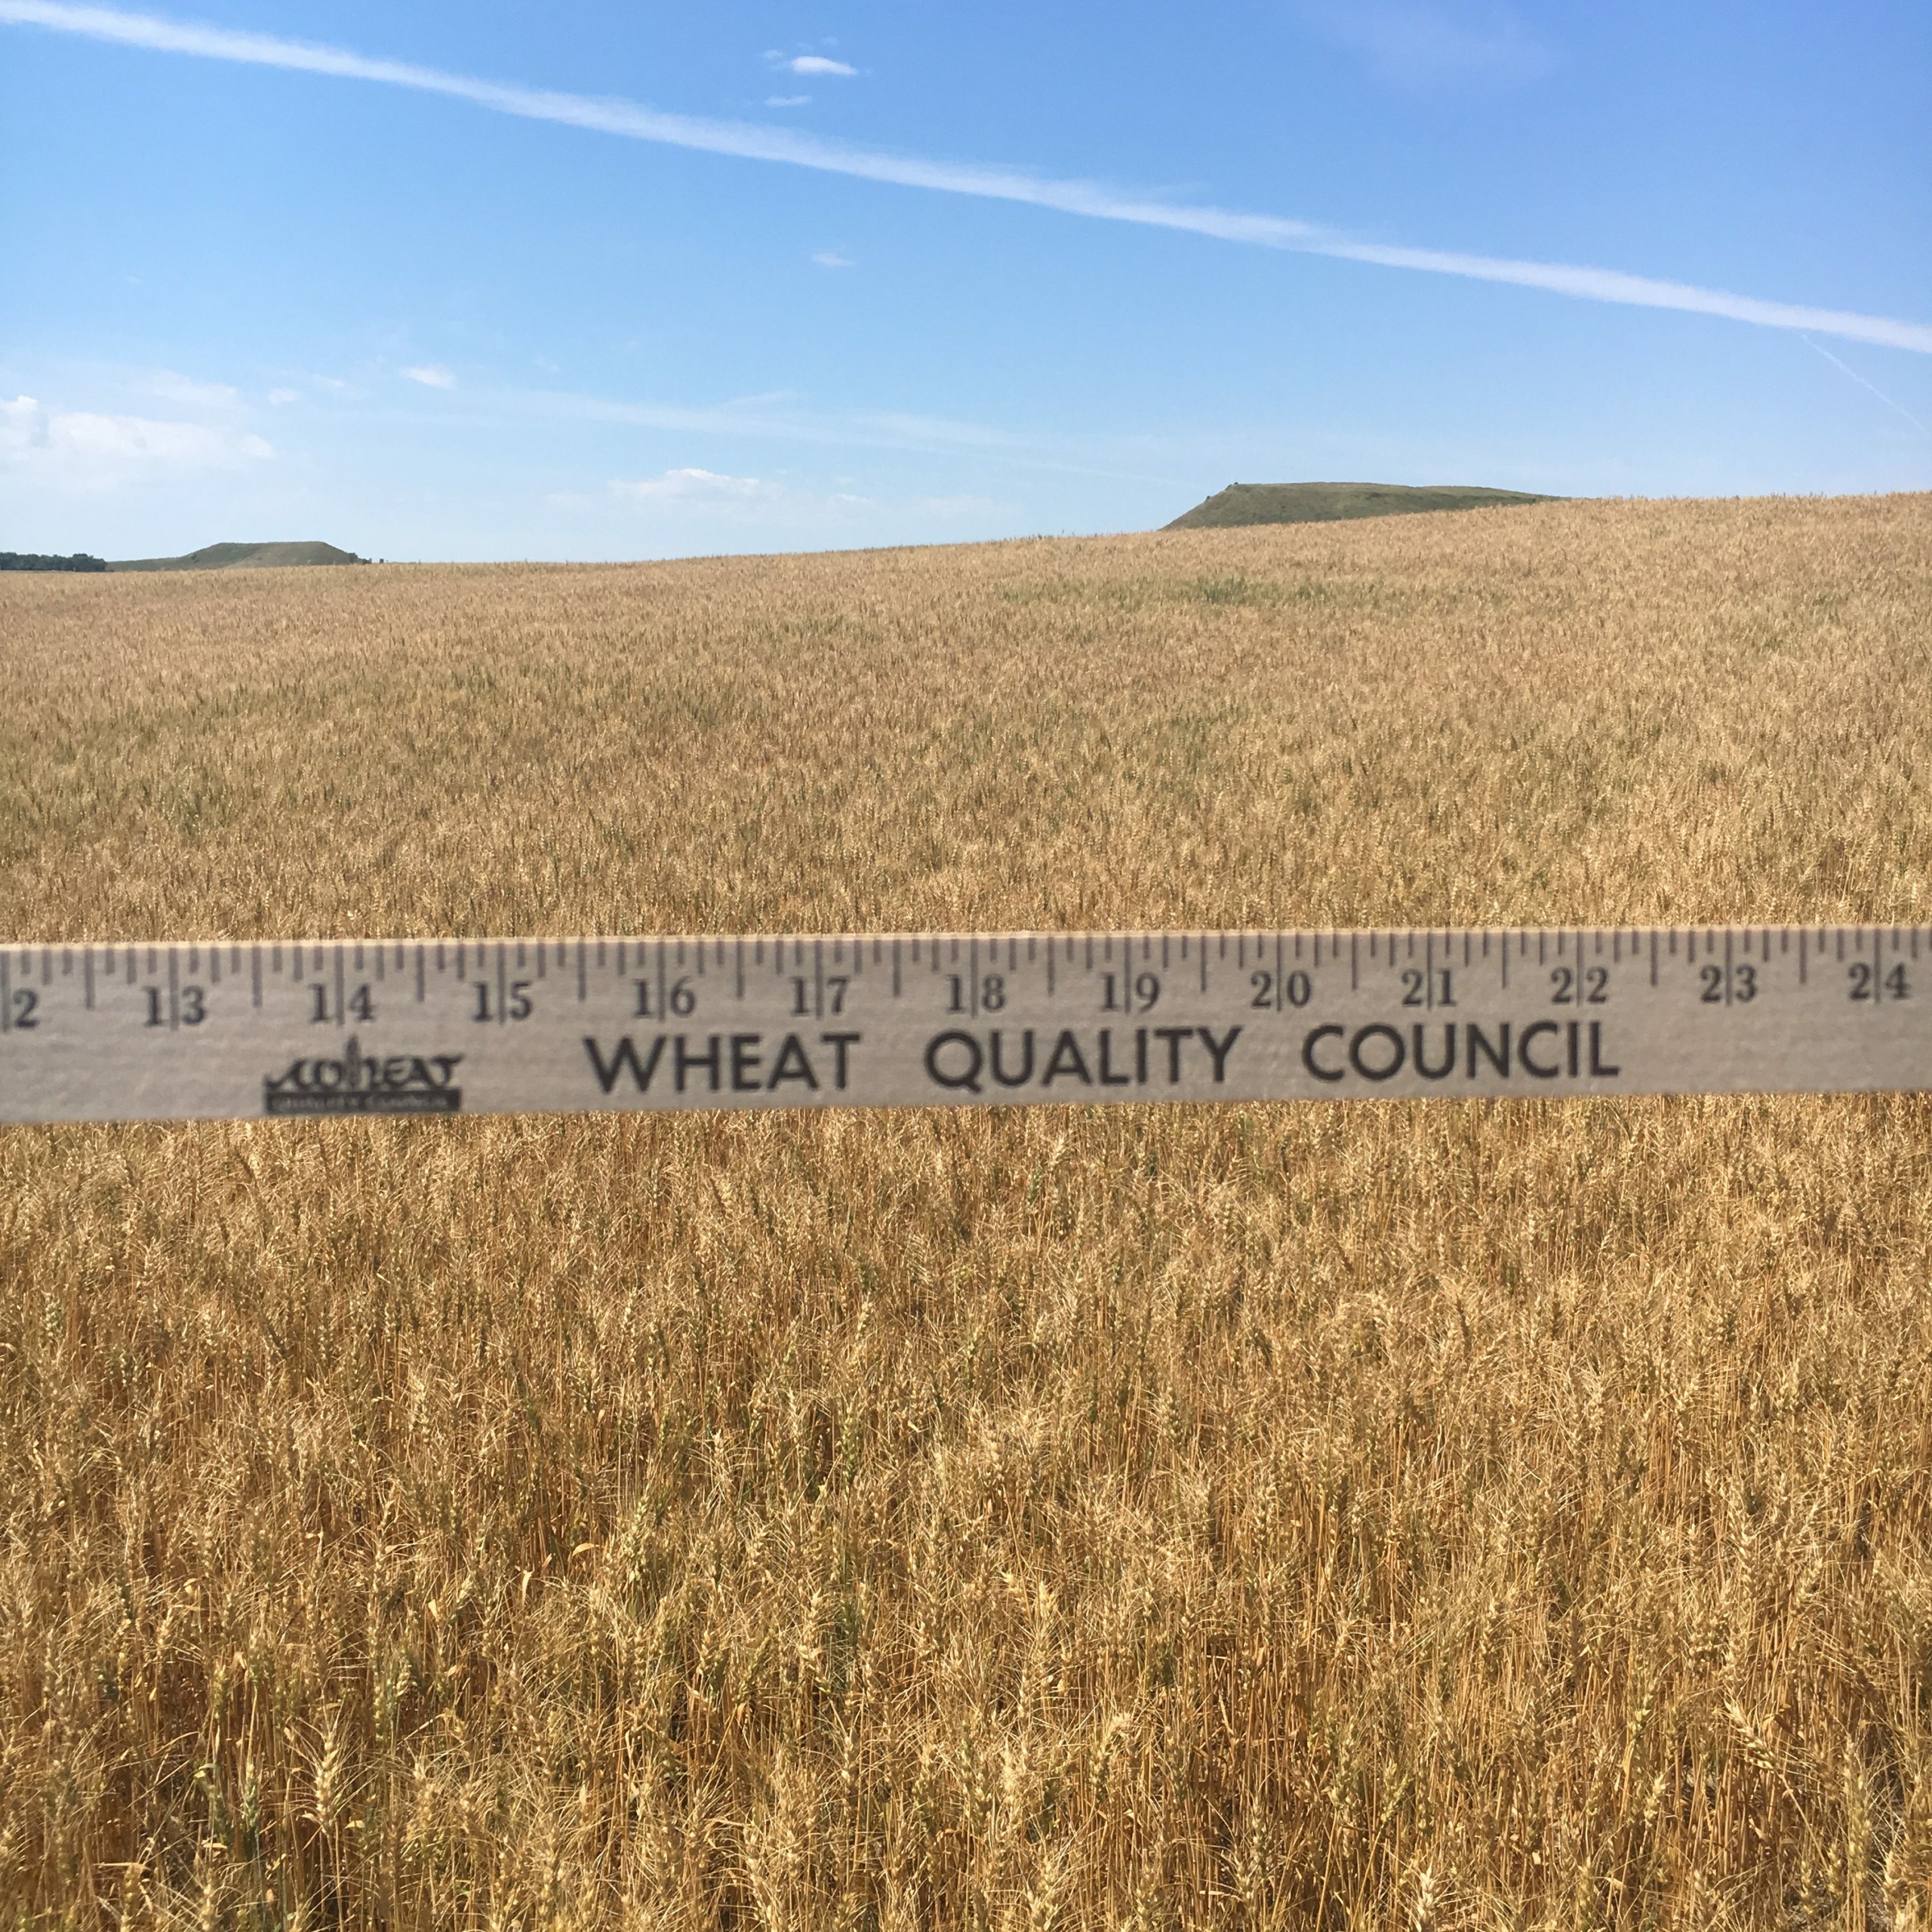
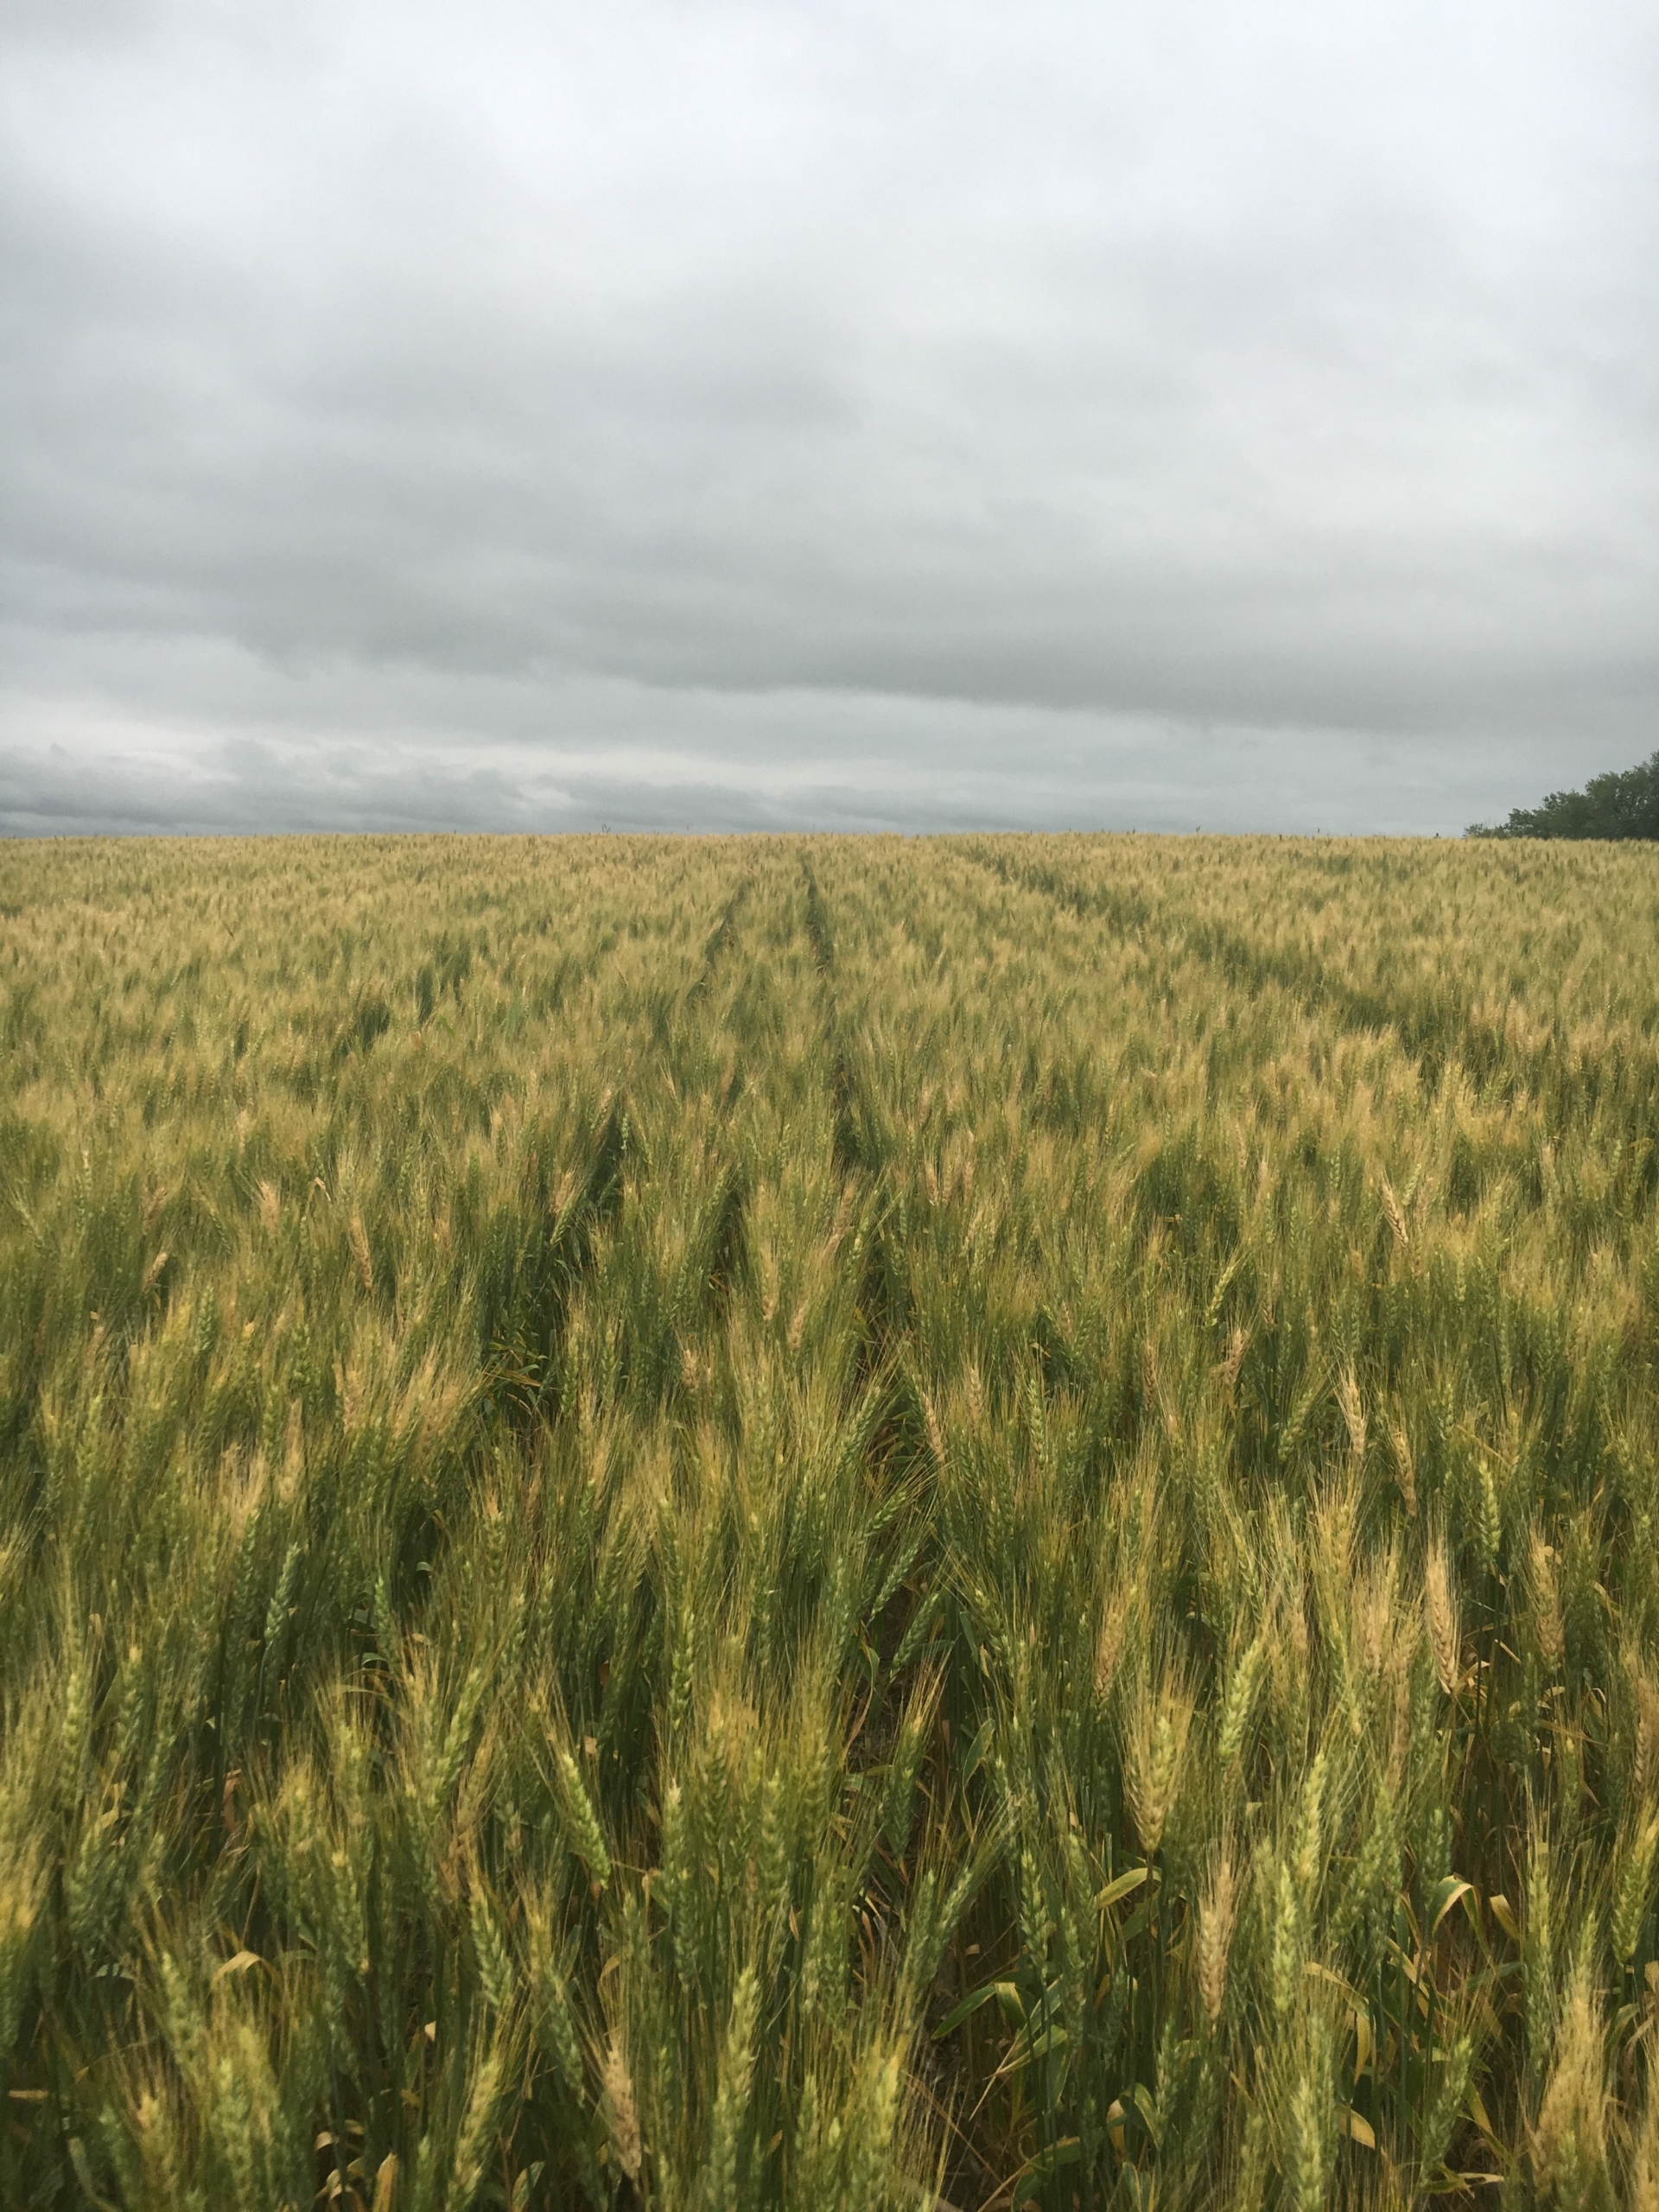
U.S. farmers growing soft red winter (SRW) wheat, especially in the East Coast states, experienced difficult growing conditions in 2018 with excessive moisture affecting test weight, falling number and DON values. Overall, however, several grade factors in the 2018 SRW crop are better than the 5-year averages, protein is somewhat above average, and DON is somewhat below average. Processors should find good qualities for crackers and segments of the crop with good cookie and cake qualities. With higher protein and good extensibility, the crop should also be valuable in blending for baking applications.
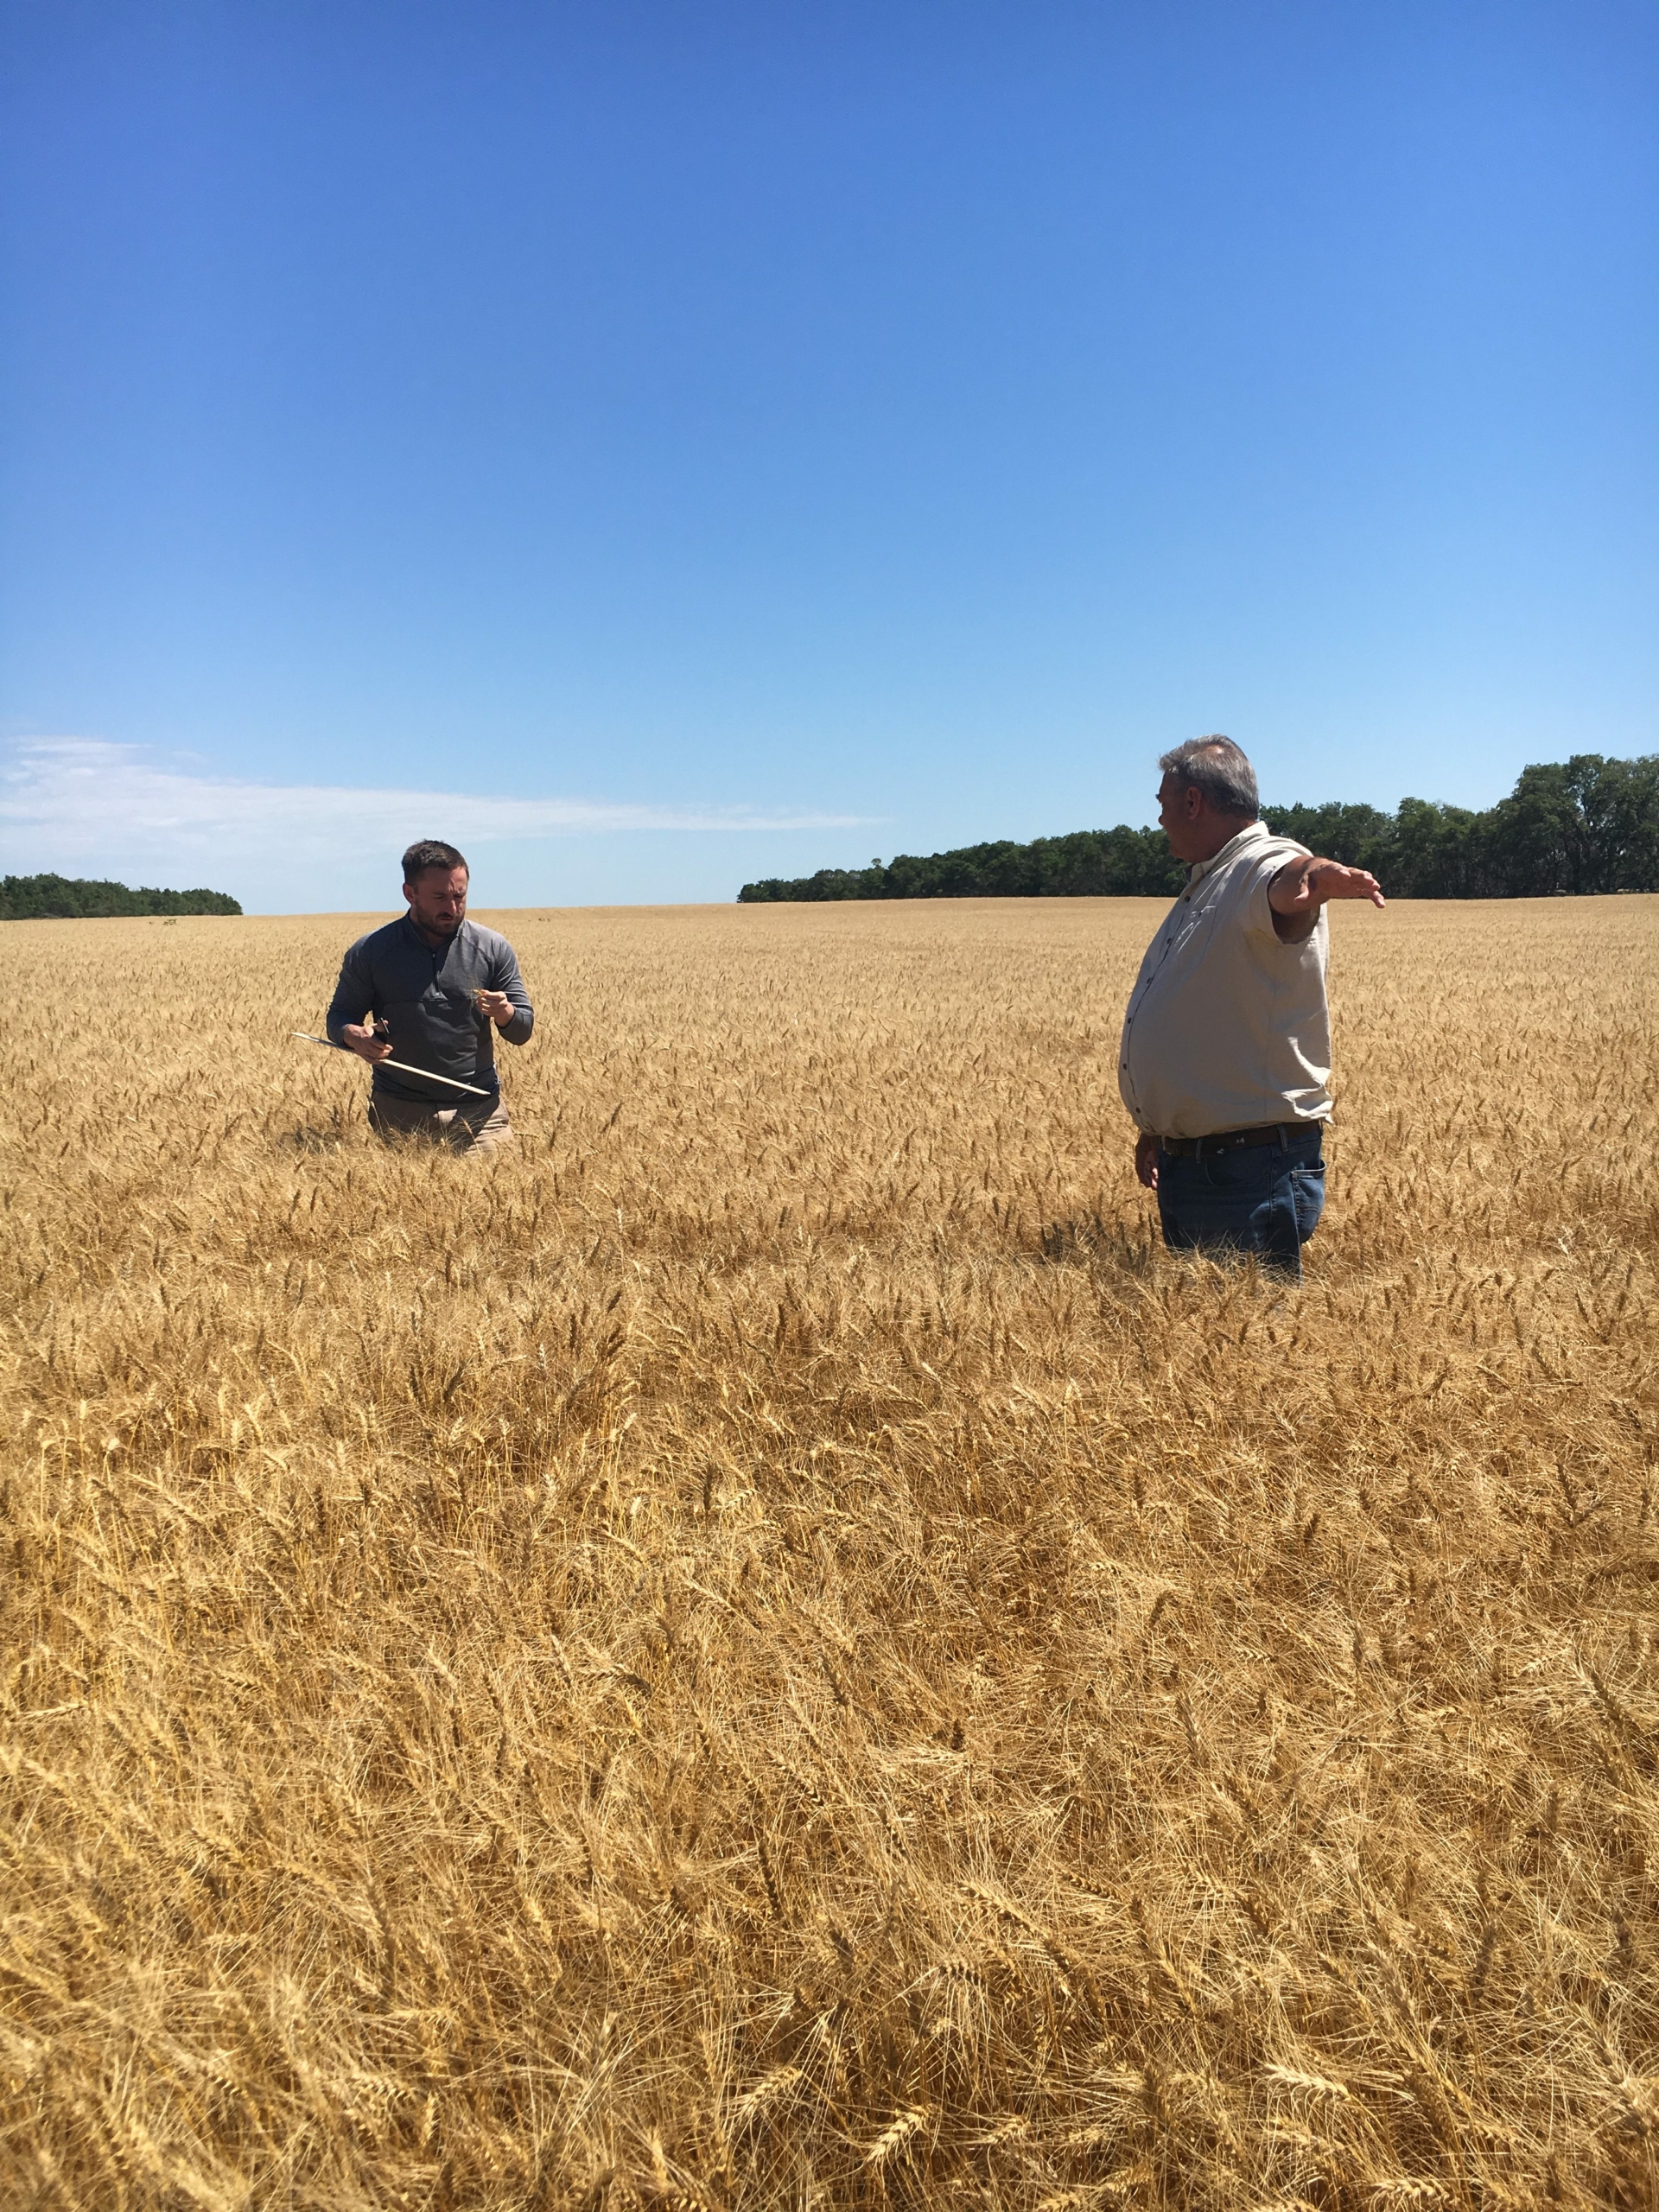
That is a summary of results from the U.S. Wheat Associates (USW) 2018 SRW Crop Quality Report, now posted online here. To complete the report, Great Plains Analytical Laboratory in Kansas City, Mo., collected and analyzed 265 samples from 18 reporting areas in the 11 states that account for most of U.S. SRW 2018 production. USW and the USDA Foreign Agricultural Service fund the annual survey.
Wheat and Grade Data
With analysis result weighted by estimated state production, the average grade of all samples collected for the 2018 SRW harvest survey is U.S. No. 3. The weighted average test weight is 57.9 lb/bu (76.2 kg/hl), slightly below the 59.1 lb/bu (77.1 kg/hl) 2017 average. The Gulf Port average of 58.2 lb/bu is similar to the 5-year average of 58.4 lb/bu (76.8 kg/hl). The East Coast test weight average of 56.6 lb/bu (74.5 kg/hl) is below both last year. All other grade factors, dockage and moisture are similar to or lower than 2017 average values. The Gulf Port Total Defects average of 0.8% is below the previous 5-year minimum, indicating that damaged and shrunken and broken kernels are unusually low in that portion of the crop.
The composite average wheat protein content of 9.9% (12% moisture basis) is higher than 2017’s 9.5% and the 5-year average of 9.7%. Both the Gulf Port protein average of 9.9% and East Coast average of 10.2% are above the 2017 and 5-year averages. The composite average falling number of 322 seconds is similar to 2017. The Gulf Port average of 327 seconds is slightly above last year, while the East Coast average of 301 seconds is slightly below last year. Fewer than 10% of samples had a falling number below 250 seconds in 2018. The composite DON average of 0.7 ppm is above the very low 2017 value of 0.2 ppm but is below the 5-year average of 1.3 ppm. The East Coast value of 1.1 ppm is similar to the 5-year average while the Gulf Port value of 0.7 ppm is below the 5-year average. Of the samples tested for DON, 75 percent of the Gulf Port results and 65 percent of the East Coast results were less than 1.0 ppm.
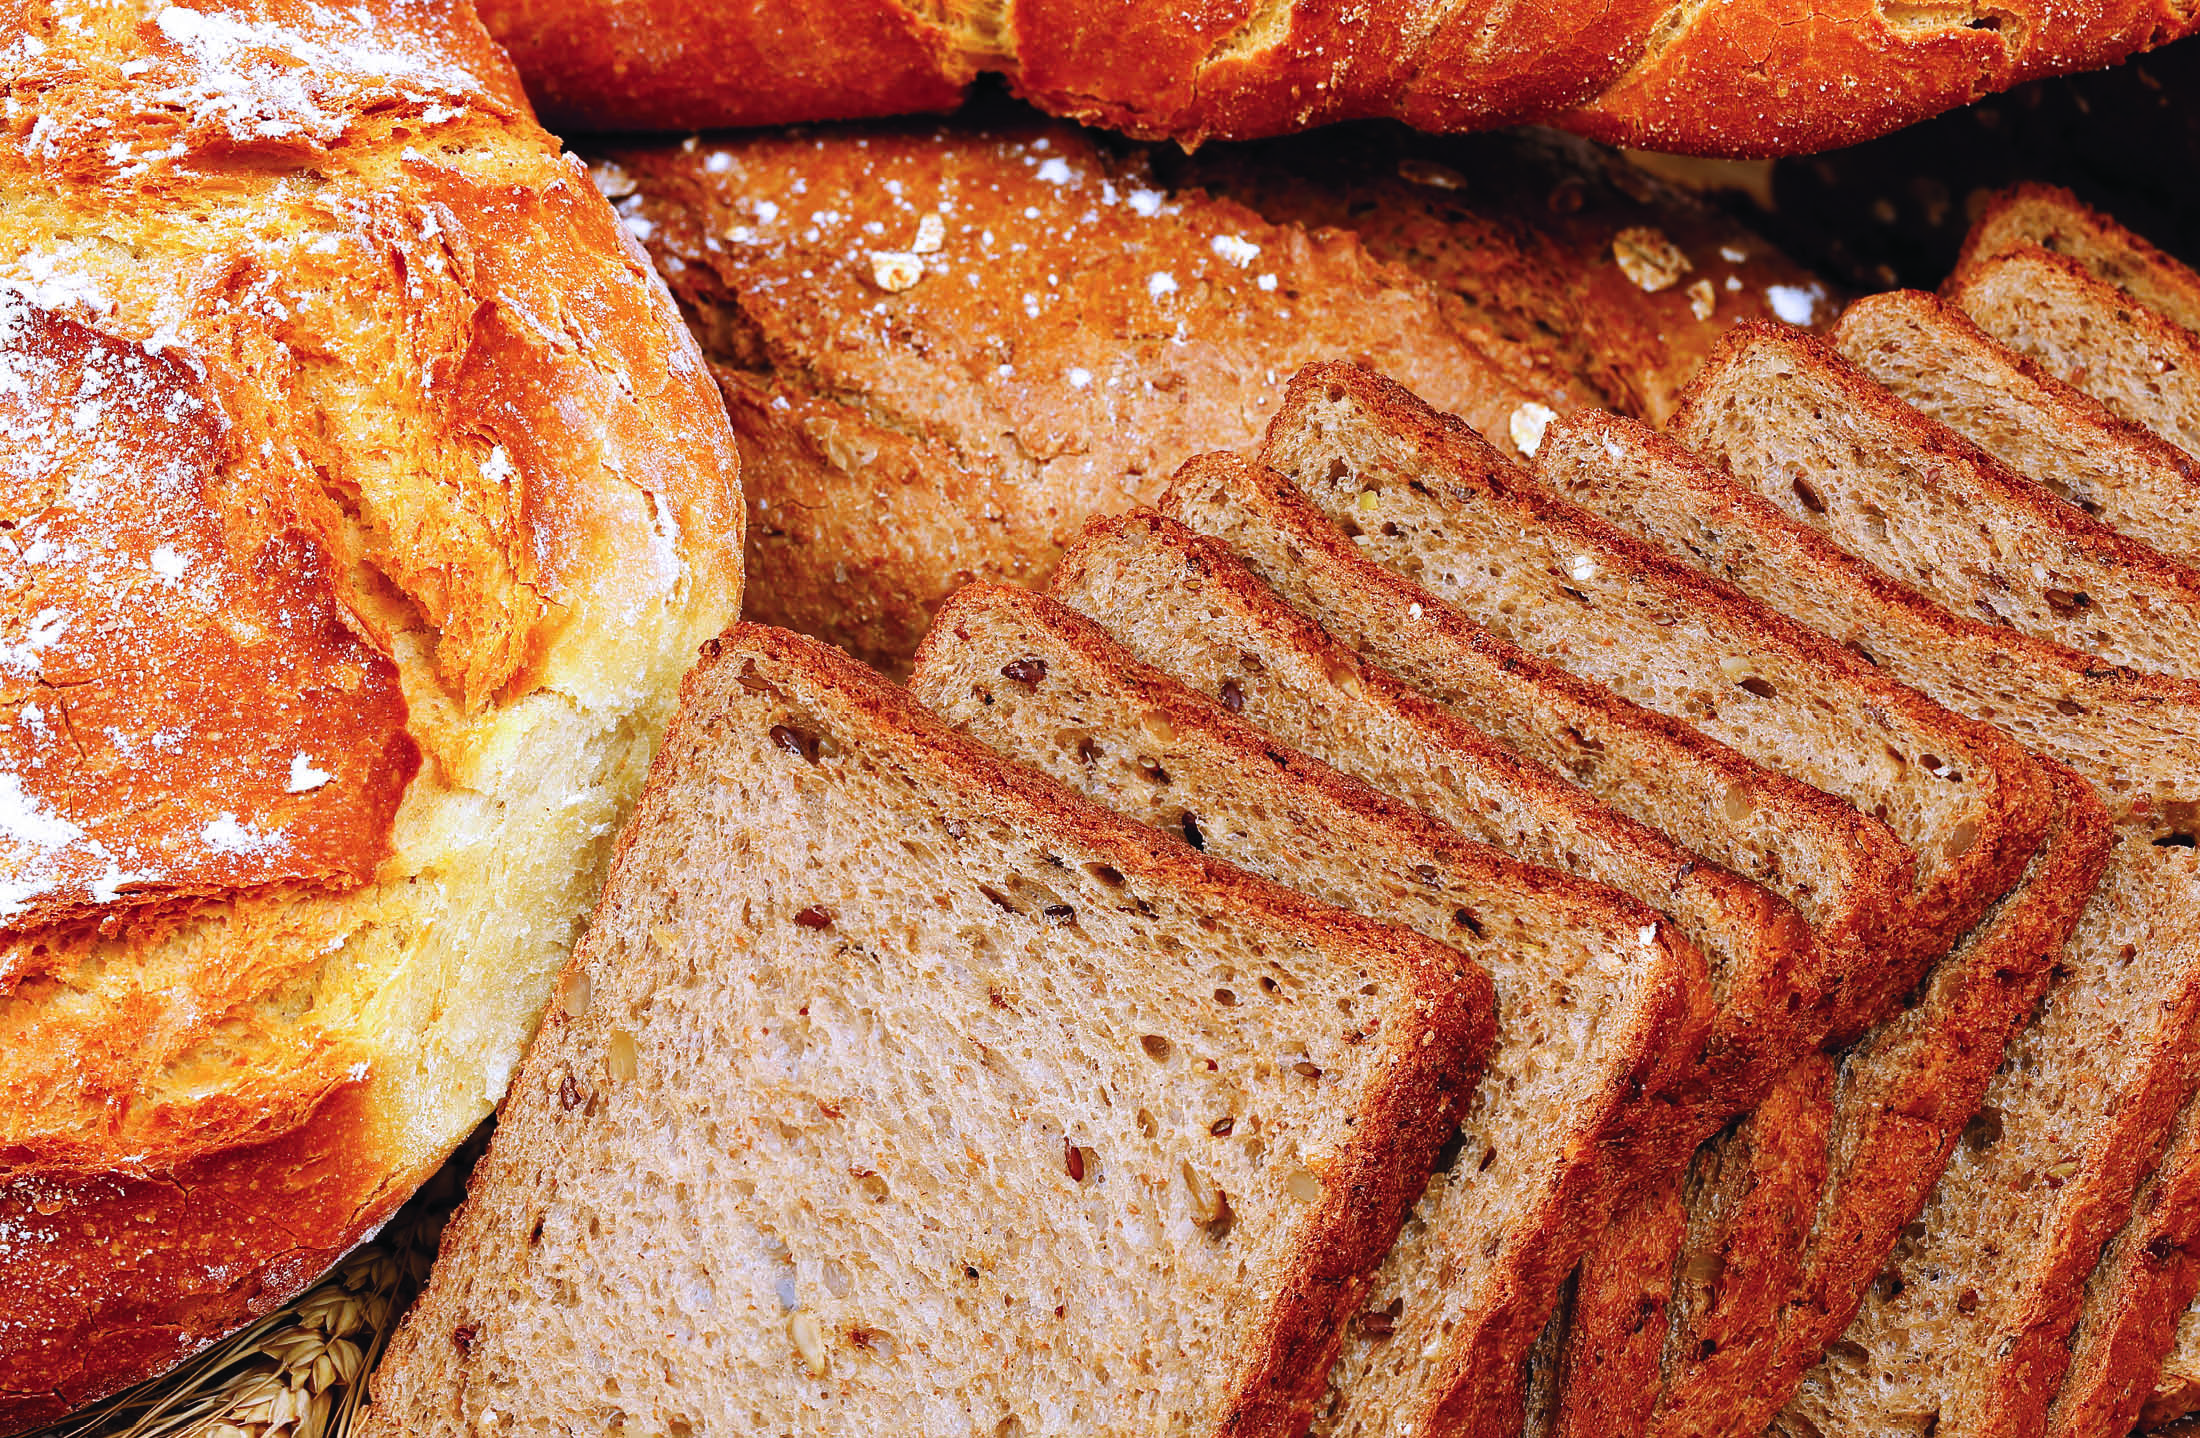
Flour and Baking Data
The composite, East Coast and Gulf Port Buhler laboratory mill flour extraction averages are below 2017 and the 5-year averages. The farinograph peak values are similar to 5-year averages, but the stability and absorption values are all below last year and the 5-year averages. The SRC values generally indicate acceptable quality for crackers; some Gulf Port areas also have acceptable SRC values for cookies. The composite and Gulf Port alveograph L averages of 97 and 98 are higher than last year and the respective 5-year average of 89 for both, indicating good extensibility.
All other alveograph averages are similar to the respective 5-year averages given the variability of alveograph analysis. The Gulf amylograph average of 614 BU indicates good quality for cakes. The composite and Gulf Port cookie spread ratios are all higher than last year and similar to the 5-year averages, again indicating good extensibility. Average loaf volumes are also all higher than last year and the 5-year averages.
USW will share complete data for all classes of U.S. wheat with hundreds of overseas customers at several upcoming events, including USW’s annual Crop Quality Seminars, and in its annual Crop Quality Report. Buyers are encouraged to review their quality specifications to ensure that their purchases meet their expectations.