By Erica Oakley, USW Director of Programs
It has been a busy couple of weeks for the U.S. wheat industry in Japan. On Nov. 14, 2019, the Governor of Oregon, Kate Brown, held a “Friends of Oregon” reception where our friend and recently retired colleague, Mr. Wataru “Charlie” Utsunomiya was recognized for his long-term contribution to wheat trade between Oregon and Japan. Charlie’s relationship with Oregon began 40 years ago and included living in the state for more than a decade. The Governor thanked Charlie for “his extraordinary service to wheat growers and to Oregonians” and acknowledged the ties “between the U.S. and Japan around wheat that he [Charlie] has built and maintained.” With more than 100 in attendance at the reception, the strong relationship between Japan and Oregon and Charlie’s contribution to that relationship was palpable and heartwarming.

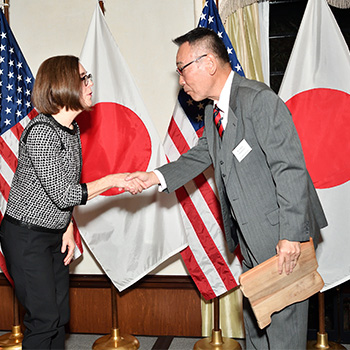
Wataru “Charlie” Utsunomiya accepts the “Friends of Oregon” award from Governor Kate Brown.

Charlie with Governor Kate Brown, friends and staff from USW, the Governor’s office, Oregon Department of Agriculture and the Japanese milling industry.
The reception was fortuitously timed as days later the USW Tokyo Office, now led by Mr. Kazunori “Rick” Nakano, held their annual Crop Quality (CQ) seminar on Nov. 18 and the Japan Buyers Conference on Nov. 19. This year’s CQ seminar had more than 140 in attendance – a record for the annual seminar held in Tokyo.
As the Japan Buyers Conference took place on Tuesday, the Lower House of Japan’s legislative body was passing the U.S.-Japan Trade Agreement, which moves U.S. wheat growers one step closer to the same preferential advantage as Canada and Australia. The flour millers that attended the conference in Tokyo represented more than 80% of the 2.78 million metric tons (MMT) of total 2018/19 commercial wheat sales to Japan reported by USDA as of May 31, 2019. There were 22 U.S. representatives, including 11 farmers and state wheat commission representatives from five states.
The conference focus differed slightly between the morning and afternoon sessions, with the morning audience largely comprised of milling personnel. Mike Spier, USW Vice President of Overseas Operations, kicked off the morning with welcome remarks. Drs. Michael Pumphrey of Washington State University and Senay Simsek of North Dakota State University both emphasized the focus on quality. Pumphrey discussed quality-first breeding techniques in the Pacific Northwest (PNW) and Simsek focused on the growing trend for clean labels and how can traits in most desirable varieties can provide the quality characteristics needed to forego additives. Bon Lee of the Wheat Marketing Center (WMC) rounded out the morning by highlighting WMC’s programmatic efforts and services for Asian customers.
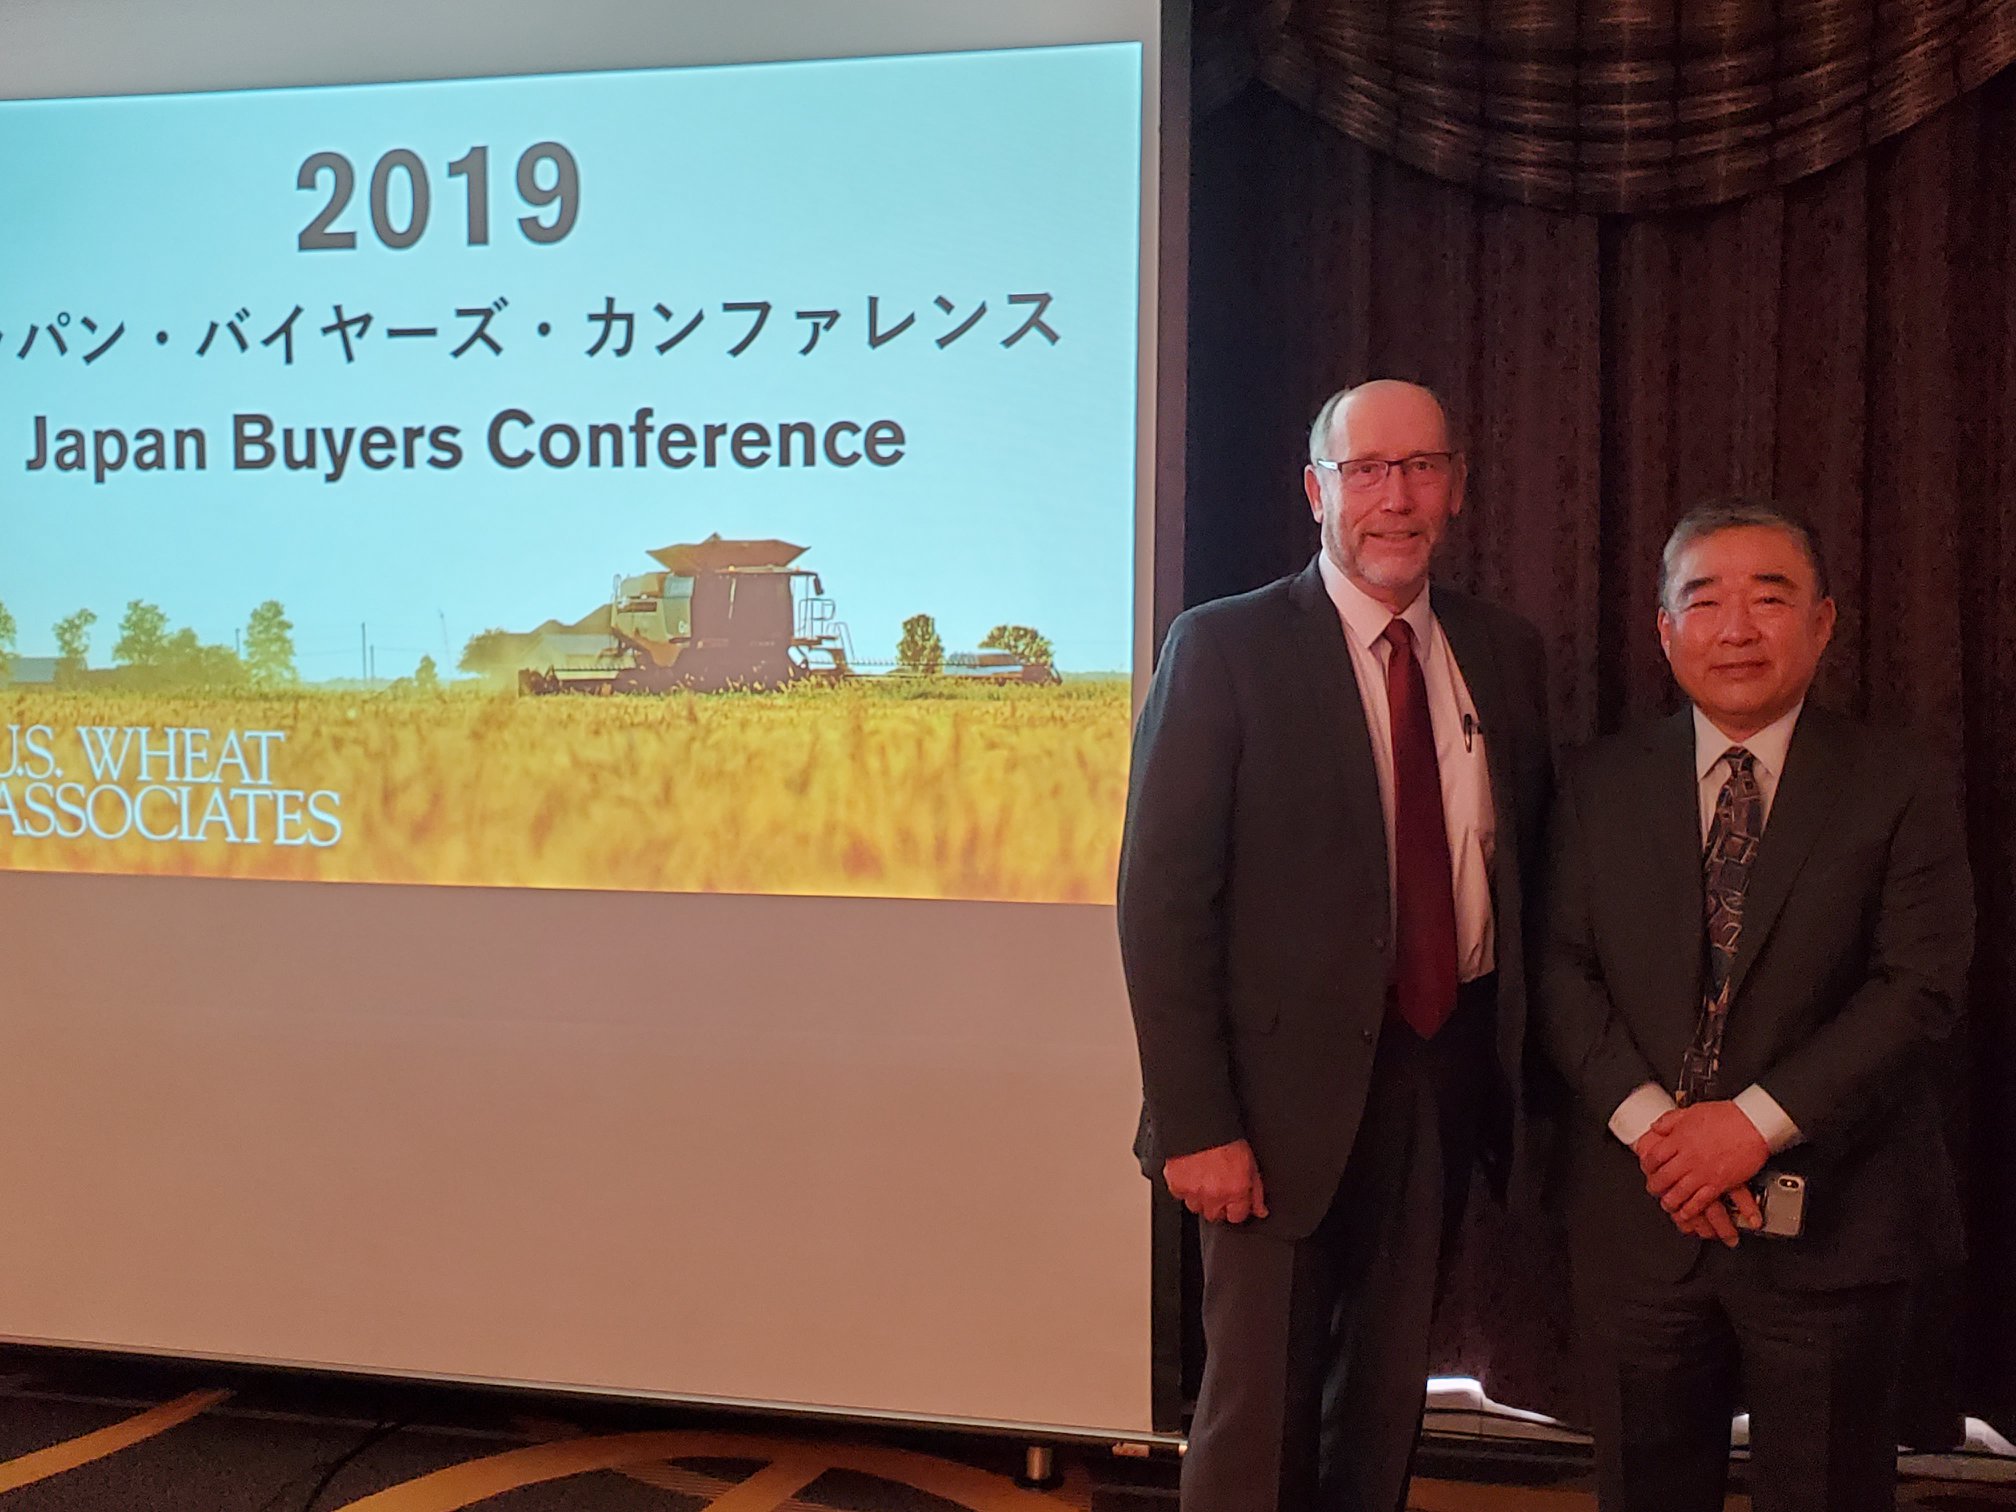
Bill Flory, Idaho wheat farmer and commissioner, and Bon Lee, Wheat Marketing Center, at the 2019 USW Japan Buyers Conference. Photo courtesy of Idaho Wheat Commission.
The afternoon session shifted to a broader audience with Zeke Spears, Agricultural Attaché USDA Foreign Agricultural Service, providing opening remarks. Doug Goyings, USW Chairman and a wheat farmer from Paulding, Ohio, thanked the attendees for their long-standing relationship and shared the history and pictures of his family operation. Dr. Bill Wilson, North Dakota State University, discussed dynamic changes in the wheat marketing system, including changing consumer demands, logistics and technology, as well as increased risk and overall industrial changes. Greg Guthrie, BNSF Railway, provided an overview of BNSF’s efforts to meet demand and how technological advancement will benefit the Japanese wheat supply chain. Steve Wirsching, USW Vice President and West Coast Office Director, brought the conference full circle highlighting the superior value of U.S. wheat and efforts to ensure our Japanese customers receive the quality wheat they deserve.
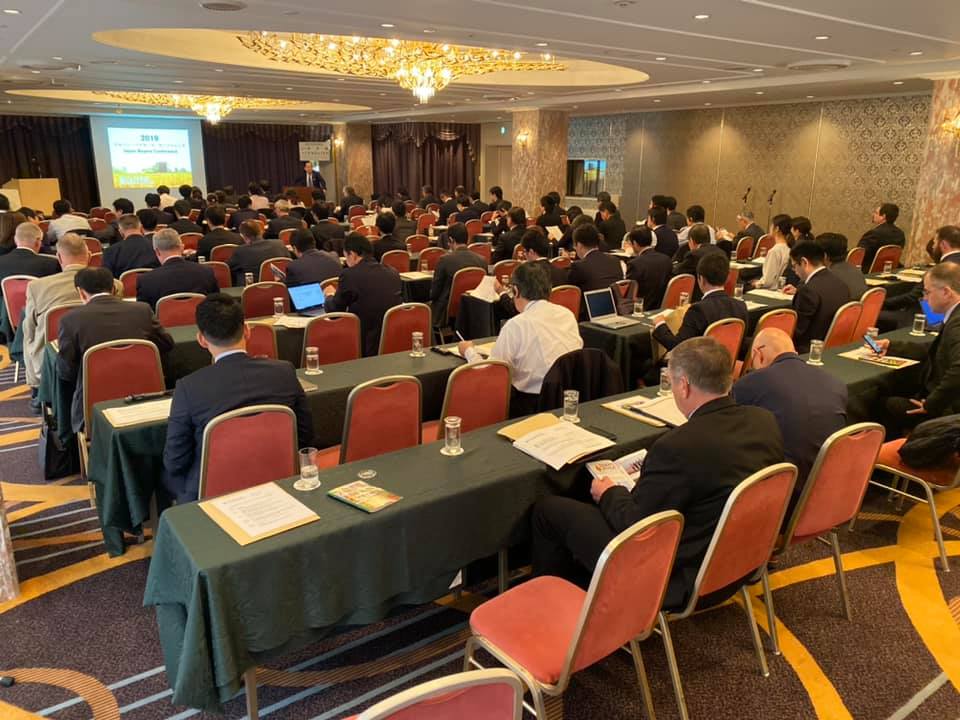
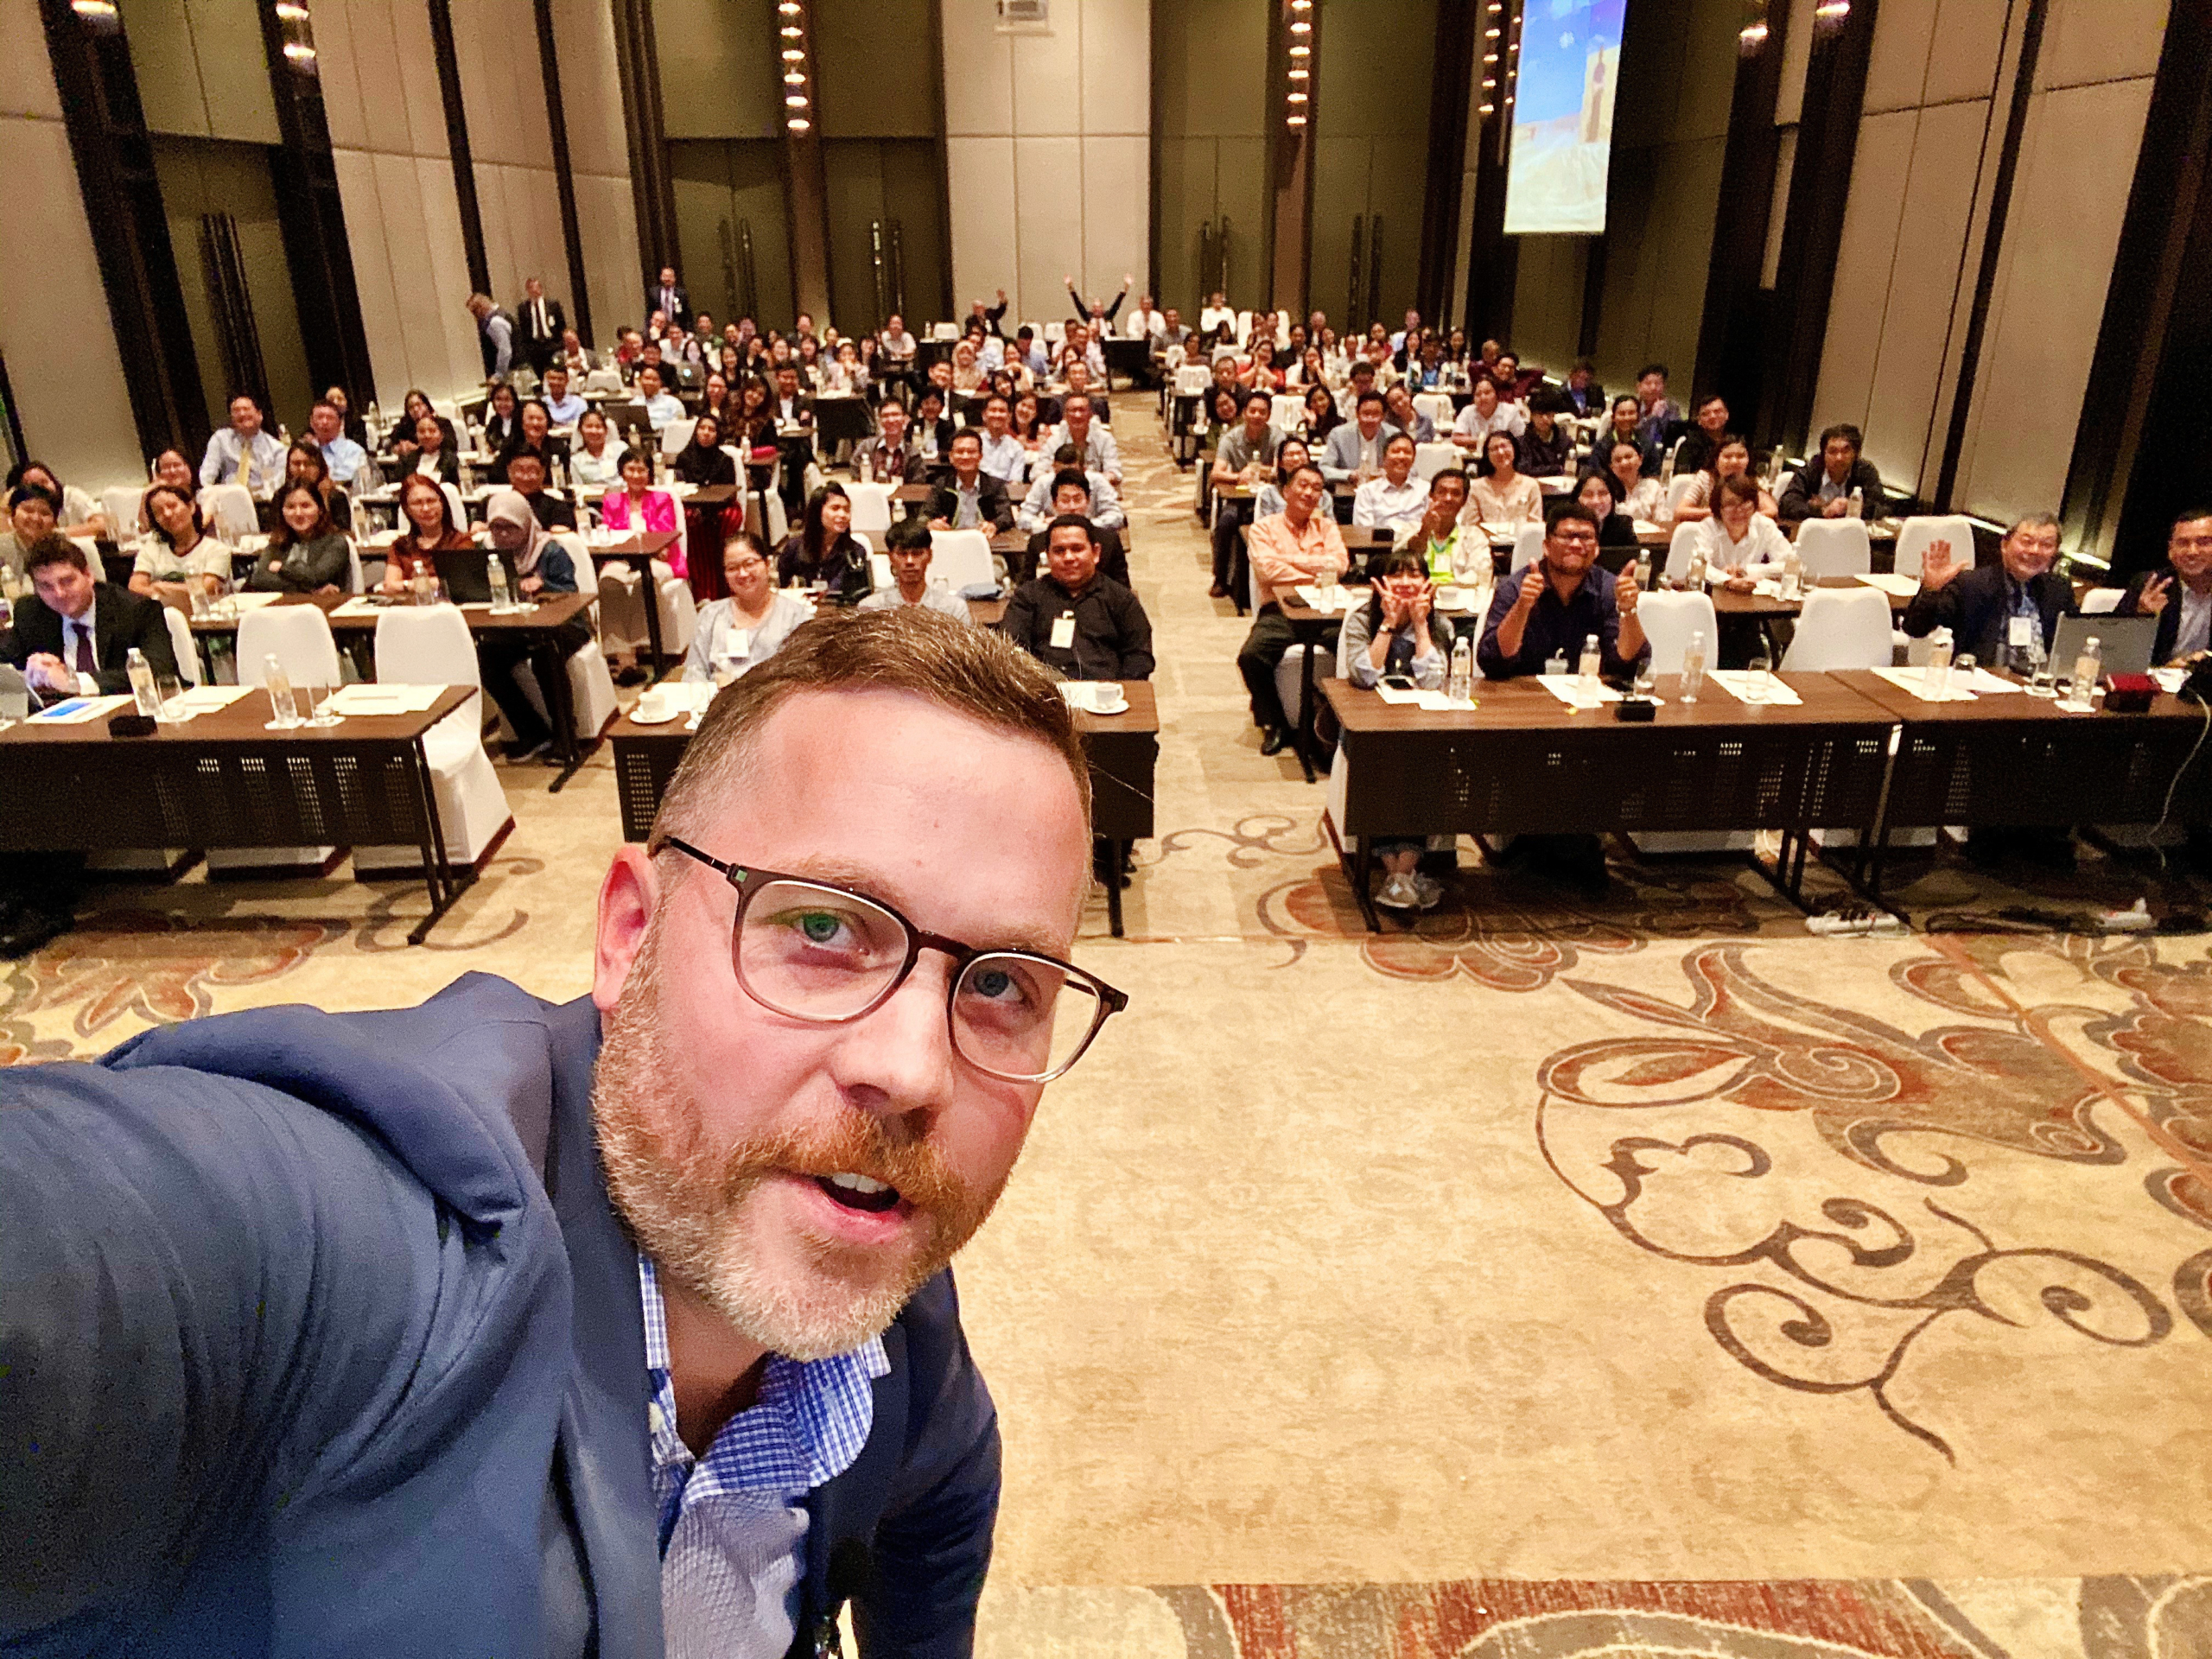
2019 USW Japan Buyers Conference. Photo courtesy of Idaho Wheat Commission.
The day ended with a reception at the Palace Hotel with remarks from Goyings; Mr. Makoto Osawa, Ministry of Agriculture, Forestry and Fisheries, Vice-Minister for International Affairs; Mr. Gary Meyer, U.S. Embassy Minister-Counselor for Agricultural Affairs; and Mr. Yoshihisa Fujita, Japan Flour Millers Association. The reception rounded out a very welcome and successful conference.
Header Photo Caption: Doug Goyings, USW Chairman, welcomes the Japan Buyers Conference attendees.