thumbnail

By Claire Hutchins, USW Market Analyst

As marketing year (MY) 2018/19 draws to a close, customers of U.S. winter wheat are taking advantage of excellent buying opportunities on competitive pricing and high-quality, consistent supplies. Since the first week in January, the 2018/19 export sales pace for hard red winter (HRW) and soft red winter (SRW) surpassed last year’s pace for deliveries in the current marketing year (CMY) and the new marketing year (NMY).

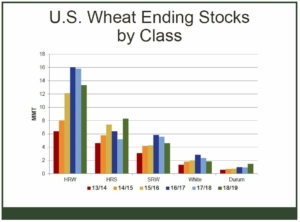
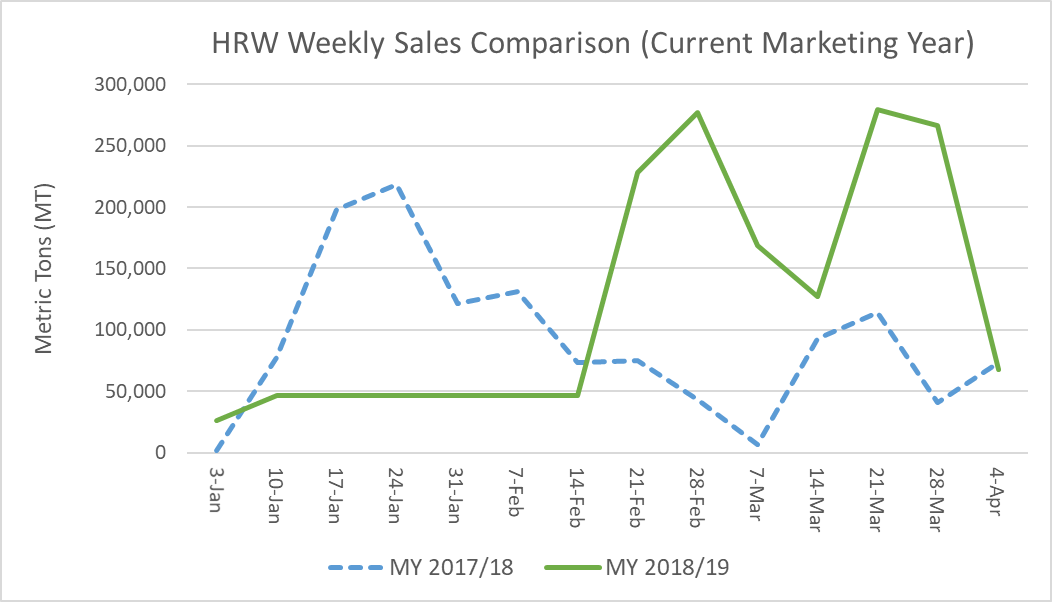
According to USDA commercial sales data as of April 4, 2019, HRW sales for 2018/19 delivery total 8.70 million metric tons (MMT). That is down 4% from this time last year but up 4% from the 5-year average of 8.33 MMT. Between February 14 and April 4, weekly sales of HRW for CMY delivery were significantly higher than the same six weeks in 2017/18 on low prices and high crop quality attributes. In the April 12 U.S. Wheat Associates (USW) Price Report, estimated FOB export price for 12% protein HRW (12% moisture basis) out of the Gulf at $222/MT for May 2019 delivery compared to $258/MT for delivery in May 2018. HRW export basis for the same delivery month, at $1.70/bu, is significantly lower than last year’s $1.95/bu. In addition to lower FOB export prices, the 2018/19 HRW crop features excellent milling and baking qualities.

These market factors also support a significant uptick in HRW commercial sales into the NMY compared to NMY sales booked by the same time in 2017/18. HRW export sales for the 2019/20 marketing year total 396,000 metric tons (MT), up 64% from this time last year and 17% from the 5-year average. This represents the highest volume of HRW NMY sales to date since 2014/15. The most recent USW Price Report estimates 12% HRW FOB price for June 2019 delivery at $224/MT, compared to last year’s estimate of $259/MT for delivery in June 2018.

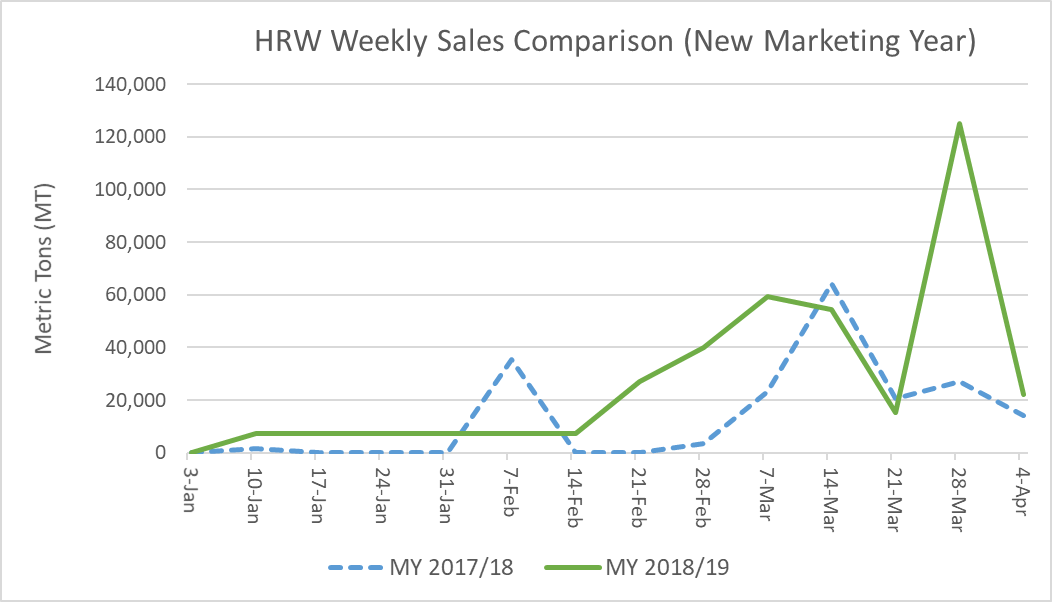
Members of the grain trade expect HRW FOB prices and export basis out of the Gulf to decrease steadily into the new marketing year on somewhat larger ending stocks, reduced inland logistical challenges, and favorable new crop conditions.

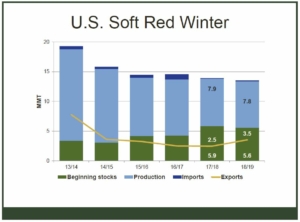
Turning to SRW, commercial sales to date for 2018/19 delivery total 3.30 MMT, up 36% year-over-year and 10% more than the 5-year average. This represents the highest volume of SRW commercial sales for CMY delivery since 2014/15. Competitive prices, higher than average protein levels and lower than average DON levels continue to elevate SRW export business through the second half of MY 2018/19. More information about the 2018/19 SRW crop is available at https://bit.ly/2ZdnMwi.

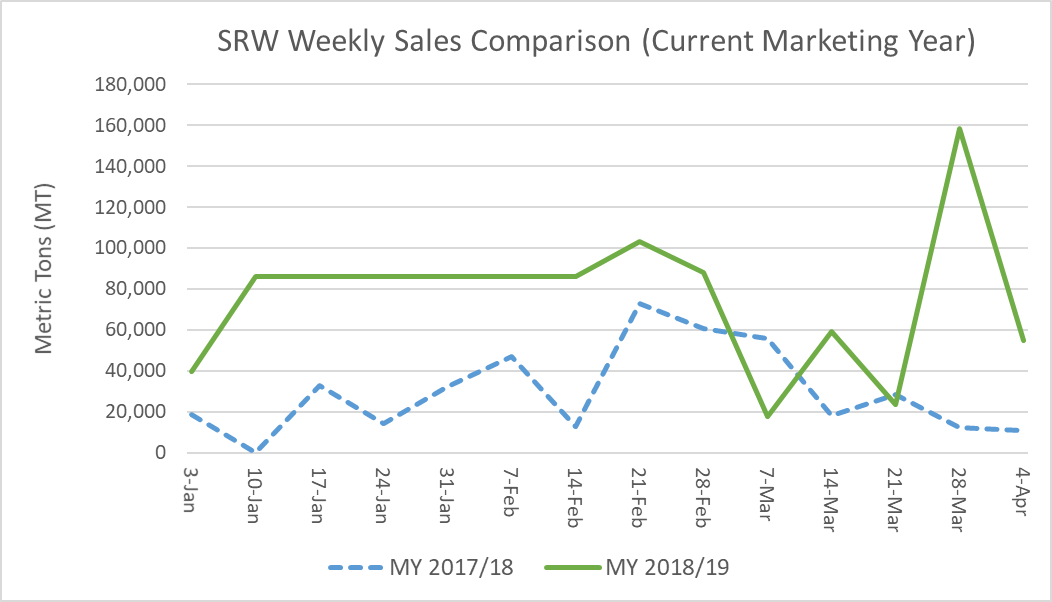
The latest USW Price Report valued the SRW export FOB price out of the Gulf at $204/MT for May 2019 delivery compared to $208/MT last year. SRW export basis for May 2019 delivery out of the Gulf at $0.90/bu is 5 cents less than last year’s estimate for May 2018 delivery.

Grain traders expect SRW FOB export prices and export basis to decline steadily into the first few months of MY 2019/20 despite tightening 2018/19 U.S. SRW ending stocks, which are forecast to fall to 4.57 MMT, 18% below 2017/18 and 7% below the 5-year average.

As with HRW sales, total SRW commercial sales for 2019/20 delivery are significantly higher than NMY sales booked this time last year. SRW commercial sales for NMY delivery total 302,000 MT, up 23% year-over-year and 15% from the 5-year average. This represents the highest volume SRW NMY sales to date since 2014/15 as customers look to lock in high quality supplies at globally competitive prices. The April 12 Price Report estimates SRW FOB price out of the Gulf for June 2019 delivery at $202/MT compared to last year’s estimate of $213/MT for the same delivery month in 2018.


thumbnail

By Steve Mercer, USW Vice President of Communications

Grown in the eastern United States, soft red winter (SRW) wheat is a profitable choice for producing confectionary products like cookies (biscuits), crackers and cakes, and to blend its flour for baguettes and other bread products. U.S. Wheat Associates (USW) wants to share some key points about SRW exportable supply in marketing year 2018/19 and look ahead to its potential for 2019/20.

1. Good Quality. While excessive rain on the 2018/19 SRW crop did slightly lower average test weight and falling number, protein (9.9% on 12% moisture basis, composite) is above average and DON level (0.7 ppm composite) is slightly below average. Processors should find good qualities for crackers and segments of the crop with good cookie and cake qualities. The higher protein and good extensibility in the crop should add value in blending for baking applications. See more information at https://www.uswheat.org/market-and-crop-information/crop-quality/.

2. Least Cost. SRW is the lowest cost milling wheat in the world today, offered at an average FOB export price of US$202 per metric ton* for June delivery from U.S. Gulf ports. The International Grains Commission in its March Grain Market Report estimated SRW FOB price at $211, which is $6 less than French soft wheat. SRW exportable supplies are also available from Lakes ports (Toledo, Ohio), and Atlantic ports (Norfolk, Virginia, and Wilmington, North Carolina). See more information at https://www.uswheat.org/market-and-crop-information/price-reports/.

3. Supply is Down. Ending stocks of SRW have declined from 5.9 MMT in 2016/17 to USDA’s latest estimate of 4.6 MMT for 2018/19 (by comparison, SRW ending stocks in 2013/14 were 3.1 MMT after China imported 3.6 MMT that marketing year). Reduced supply relates to a near 50% decline in total production from 15.4 MMT in 2013/14 to USDA’s current estimate of 7.8 MMT in 2018/19, as well as an upturn in exports (see below). See more information at https://www.uswheat.org/market-and-crop-information/supply-and-demand/.

SRW ending stocks have declined steadily since 2016/17 on less production and more exports. Source: USDA

4. Demand is Up. As of April 4, SRW exports of 3.3 million metric tons (MMT) are 36% more than at the same time in marketing year 2017/18. This represents the most volume SRW sales year to date since 2014/15. Commercial SRW sales to Mexico, Colombia, Peru, Ecuador and Brazil are up significantly, as are imports by Central American and Caribbean countries and Nigeria. See more information at https://www.uswheat.org/market-and-crop-information/commercial-sales/.

U.S. SRW wheat supplies are down; export demand takes an upturn. Source: USDA

5. Planted Area is Down. In February 2018, USDA reported that SRW seeded area for 2019/20 is 5.7 million acres (2.4 million hectares), or down 7% from last marketing year. Most of the states that typically produce the most exportable SRW supplies planted less. This decline is not more significant only because some farmers can harvest SRW and then quickly plant soybeans to get a double crop from the same acre. In general, U.S. crop farmers, who are driven by economic circumstances to minimize their net losses at best this year, are turning away from winter wheat to other crops that offer better returns. Total U.S. winter wheat seeded area for 2019/20 is at its second lowest level on record. See more information at https://www.nass.usda.gov/Publications/Todays_Reports/reports/wtrc0219.pdf.

*Source: USW Price Report, April 12, 2019

thumbnail

By Steve Wirsching, USW Vice President and West Coast Office Director

It is U.S. Wheat Associates’ (USW) mission to “develop, maintain, and expand international markets to enhance wheat’s profitability for U.S. wheat producers and its value for their customers.” The overseas market has changed tremendously in the last 25 years. In the 1990s, the United States was a dominant global supplier. Today, it is one of many suppliers in a highly competitive international market. International trade has nearly doubled during that same time, driven by population and income growth. This growth has increased competition, elevating wheat quality as a vital component of value.

Russia now boasts that it exports more wheat than the United States. While Russia exports more tons, the United States continues to lead the world when sales are measured in dollars. In 2018, Russia exported $5.8 billion worth of wheat as compared to $6.1 billion exported by the United States. U.S. wheat commands a higher price in the international market because customers recognize its quality, consistency, and value.

In March, Wirsching participated on the Learning Session panel for “Putting Wheat Quality in the Spotlight ” at the 2019 Commodity Classic. His presentation focused on global markets for wheat, why growers should care about quality and selling their crop abroad.

USW supports the annual National Wheat Yield Contest sponsored by the National Wheat Foundation (NWF). Increasing wheat production is important to the long-term viability and competitive position of wheat as a food grain. However, wheat quality must not be compromised in exchange for higher yields. Growers need both higher yields and better quality. Along with the NWF and the National Association of Wheat Growers, USW recently helped sponsor a learning session, “Putting Quality in the Spotlight,” at the 2019 Commodity Classic in Orlando, Fla. The session focused on enhancing the message that quality is important. Panelists discussed why the top winning varieties should also be subject to minimum end-use functionality tests because some in the industry worry that the United States will adopt more wheat forage varieties to enhance yields, at the expense of quality. Farmers know you cannot sell something the customer does not need or want to buy. That is why quality is important.

Find more information about U.S. wheat quality and related resources here.


thumbnail

By Steve Wirsching, USW Vice President and Director, West Coast Office

In Latin America, the holidays are filled with special wheat food traditions. Mexicans celebrate the visit of the Three Kings to the Christ child with Rosca de Reyes (Kings Cake Wreath), a ring-shaped sweet bread. In Peru, wheat consumption increases with Panettone bread sales. This holiday sweet bread can be traced back to the Italian bakers that made Peru their home many generations ago.

Special holiday breads are thriving despite a baking industry transitioning from artisan bakery shops to highly automated commercial operations. Such modern bakeries employ equipment that drives a need for ever more consistent, high-quality flour.

It was in this context that U.S. Wheat Associates (USW), with funding from member state wheat commissions and USDA’s Foreign Agricultural Service, assembled a team of leading wheat breeders to visit the top markets in Latin America. This Wheat Quality Improvement Team (WQIT) traveled to Mexico City, Mexico, Guatemala City, Guatemala, San Jose, Costa Rica and Lima, Peru, Dec. 8 to 18, 2018. Meetings with several food processing and flour milling industry representatives focused on U.S. wheat quality relative to the unique production challenges these customers face.

Wheat farmers, state wheat commissions, and public and private breeders understand that the end-use quality of U.S. wheat, as measured by end-use functionality, is more important than ever before in today’s increasingly competitive marketplace Such direct input from Latin American food processing companies to breeders is one of the ways USW is helping determine breeding targets, as well as helping develop selection criteria for new variety releases. The face-to-face interaction with breeders in this activity helps overseas buyers understand that U.S. wheat quality is no accident but is, rather, the product of investment from farmers and years of scientific work.

Customers shared several preferred characteristics from U.S. wheat including consistent quality from shipment to shipment, increased dough strength and water absorption, and lower polyphenol oxidase (PPO) to prevent color change. These messages and more will be relayed to state wheat commissions at upcoming Wheat Quality Council meetings in Portland, Ore., and Kansas City, Mo.

Market development programs like this Wheat Quality Improvement Team help ensure that Latin American sweet breeds like the Rosca de Reyes and Panettone continue to be a holiday tradition — made with high-quality wheat from the United States.

Participating Wheat Breeders 

The WQIT to Latin America in December included:

  • Guorong Zhang, Leader, Kansas State wheat breeding program and Associate Professor at Kansas State University;
  • Brett Carver, Wheat Genetics Chair in Agriculture, Oklahoma State University;
  • Mike Giroux, Co-director of the Montana State Wheat Quality Laboratory and leader of the Montana State durum breeding program;
  • Jackie Rudd, Leader of the hard winter wheat breeding program for the High Plains and Rolling Plains of Texas;
  • Arron Carter, Director of the winter wheat breeding and genetics program at Washington State University;
  • Mr. Steve Wirsching, USW Vice President and Director, West Coast Office.

The team and USW Staff in front of the Presedente Hotel in Mexico City.

thumbnail

By Erica Oakley, USW Director of Programs

As a key part of its commitment to transparency, each year U.S. Wheat Associates (USW) produces an annual Crop Quality Report that includes grade, flour and baking data for all six U.S. wheat classes. The report is compiled from sample testing and analysis conducted during and after harvest by our partner laboratories. The report provides essential, objective information to help buyers get the wheat they need at the best value possible.

The 2018 USW Crop Quality Report is now available for download in English, Spanish, French and Italian, and will be available in Chinese and Arabic soon. USW also shares more detailed, regional reports for all six U.S. wheat classes on its website, as well as additional information on its sample and collection methods, solvent retention capacity (SRC) recommendations, standard deviation tables and more.

USW’s annual Crop Quality Seminars are already underway and will continue over the next month around the world. USW invites its overseas customers, including buyers, millers and processors, to these seminars led by USW staff, U.S. wheat farmers, state wheat commission staff and educational partner organizations. The seminars dive into grade factors, protein levels, flour extraction rates, dough stability, baking loaf volume, noodle color and texture and more for all six U.S. wheat classes, and are tailored to focus on the needs and trends in each regional market.

In 2018, USW is projected to host 41 seminars in 28 countries.

Customers have previously shared that they use the report throughout the year as a reference manual and to guide them through purchases and future planning. The seminars provide a first look at the overall crop and a deep dive into the data and how to use it. Customers will often use the seminars and report as educational training for new employees.

The reports and seminars have been a traditional part of USW’s strategy since 1959, growing to become its single largest marketing activity.

thumbnail

Happy World Pasta Day! What a perfect day for U.S. Wheat Associates (USW) to share an overview of the 2018 U.S. Northern Durum and Desert Durum® crop quality results. Analysis shows the Northern durum crop is sound with high protein and excellent kernel characteristics. Vitreous kernel count and average kernel size are high and quality is balanced across the region. Desert Durum® production is down this year, though the 2018 crop will deliver the valuable milling, semolina and pasta quality traits that customers have learned to expect and appreciate.

Here is a summary of test results for Northern durum and Desert Durum®. As always, USW reminds buyers to be diligent with contract specifications to ensure they receive the quality they need.

Northern Durum

Weather and Harvest: A favorable growing season pushed yields to near record levels; production was up almost 60 percent compared to 2017. As with the hard red spring crop, mid-season rain boosted crop conditions and yield potential. Harvest was complete in most areas by late September.

Wheat and Grade Data: The crop average grade is U.S. No. 1 Hard Amber Durum (HAD) with average test weight of 61.4 lbs/bu (79.9 kg/hl) and average total kernel defects of 1 percent. The average vitreous kernel content is 90 percent, up from both last year and the 5-year average, with more than half of the crop above 90 percent vitreous compared to 45 percent in 2017.

Regional average protein is 14.5 percent on a 12 percent moisture basis (12% mb), equal to 2017 and slightly above the 5-year average. The crop average thousand kernel weight (TKW) is 41.2 g, the heaviest in six crop years, and the percent of large kernels is notably higher than a year ago. The average falling number is 425 sec. Although disease pressure was slightly higher in 2018 compared to 2017, DON was undetectable or <0.5 ppm in the samples analyzed.

Semolina and Processing Data: The Buhler laboratory mill average total extraction of 74 percent and semolina extraction of 69.3 percent are both higher than last year and the 5-year averages. The milled product ash and speck counts are also higher than last year and the 5-year averages. The gluten index average is 57.1 percent compared to 86.3 percent in 2017. Last year’s drought conditions supported exceptionally high gluten index values, while the 2018 values are more typical.

Semolina and cooked spaghetti evaluations show similar semolina color values to a year ago, but lower dry pasta color. Mixing properties are slightly weaker and cooked firmness values are similar to the 5-year averages. The higher extraction levels and higher ash levels on the Buhler lab mill may have contributed in part to the lower color scores on the dry pasta. Evaluation of the cooked spaghetti shows slightly lower firmness than 2017, but higher than the 5-year average.

Desert Durum®

Wheat and Grade Data: In 2018, the average grade is No. 1 Hard Amber Durum (HAD). Test weight average was 62.8 lbs/bu (81.8 kg/hl). The average vitreous kernel content (HVAC) is 98.0 percent, a high average typical of Desert Durum®. Average damaged kernels are 0.2 percent and total defects are 0.6 percent. Desert Durum® is characterized by its kernel low moisture content, and this year’s average was 6.7 percent. Protein content average was 13.4 percent (12% mb).

Semolina and Processing Data: The semolina b* value was 30.5, similar to 2017 b* value of 30.9.  Wet gluten of 32.3 percent and gluten index of 75 percent. Semolina Mixograph score was 8 and Alveograph W value was 231 (10-4 Joules), both of which indicate high strength.  Pasta color b* value was 44 and score was 9.6. Pasta cooked firmness was 6.9, significantly higher than 2017.

View the full report for Desert Durum® here.
View the full report for San Joaquin Valley Durum here.
View the full report for Sacramento Valley Durum here.

thumbnail

Growing conditions over most of the U.S. hard red spring (HRS) wheat production area helped produce a 2018 crop with many positive features for buyers. There is greater supply of high-grade HRS with above average protein levels and very good dough and bake qualities. In general, many quality features are balanced across the region with some variation in grade factors, DON and dough strength.

At an estimated 16.0 million metric tons (MMT), this is the largest HRS crop in 22 years and up significantly from 2017 with higher planted area and a record national average yield.

Here is a summary of the season and test results, with full data available online soon and in upcoming USW Crop Quality Seminars. As always, U.S. Wheat Associates (USW) reminds buyers to be diligent with contract specifications to ensure they receive the quality they need.

Weather and Harvest: Planting began in late April, later than normal, and continued to be slow until mid-May. Most of the crop was planted by early June. Then rain established a robust stand and good early growth. Drier conditions later in the season accelerated maturity and harvest started in late July; most of the crop was harvested by mid-September.

Wheat and Grade Data: The average grade is a U.S. No. 1 Dark Northern Spring (DNS), up from U.S. No. 1 Northern Spring (NS) in 2017. The overall average test weight is 62.2 lb/bu (81.7 kg/hl), higher than in 2017 and the 5-year average. Average damage is 0.3 percent, up from 2017, and shrunken and broken kernels average is 1.0 percent, similar to 2017. The crop shows excellent kernel color with average vitreous kernel content (DHV) of 87 percent compared to 71 percent for the 5-year average. Average DHV is 90 percent for Western samples and 84 percent for Eastern.

The average protein is 14.5 percent (12 percent mb), similar to 2017. Western average protein is 14.6 percent, down slightly from 2017, while Eastern average protein held steady at 14.4 percent.

Disease pressures were higher than in 2017. The overall DON average is 0.3 ppm, ranging from 0.0 to 0.2 ppm for Western composites and from 0.5 to 0.7 ppm for Eastern composites. Thousand kernel weight (TKW) is slightly higher than 2017 at 31.1 grams. A dry harvest period supported a high average falling number of 399 sec, indicating sound wheat.

Flour, Dough and Baking Data: Buhler laboratory mill flour yield averages 67.8 percent, down 3.5 percent from 2017, but similar to the 5-year average. Flour ash fell to 0.52 percent, compared to 0.58 percent a year ago. Wet gluten averages 35.3 percent. Amylograph values average 635 BU for 65 g of flour, up notably from 2017 and the 5-year average.

Farinograph dough tests indicate slightly higher absorption than last year with the Western region average at 65.2 percent and Eastern at 63.0 percent. The average farinograph stability is 10.8 min, similar to 2017 and the 5-year average. The Eastern crop has slightly stronger dough properties compared to the Western, but dough strength increases at higher protein levels in both regions.

Alveograph and extensograph analyses show more resistance and less extensibility. The average alveograph P/L ratio is 0.61 compared to 0.72 in 2017, and the W value is 415 (10-4 J) compared to 360 in 2017. The overall extensibility and resistance to extension of the 135 min extensograph are 13.2 cm and 855 BU compared to 2017 crop values of 13.5 and 770.

The average loaf volume is 973 cc, up marginally from 968 in 2017 with Western volumes down slightly but Eastern volumes higher. Average bake absorption is 69.6 percent, up sharply from both last year and the 5-year average. Bread scores are slightly lower in both Western and Eastern crops compared to 2017.

thumbnail

In a year when limited exportable quantities of U.S. hard white (HW) wheat are available, the good performance in milling, dough rheological properties and end products, including pan breads, Asian noodles and steamed breads reflect growing conditions and varietal improvements in the 2018 HW crop.

The 2018 crop was grown primarily in Kansas, Colorado, Idaho, California and Nebraska with some production in Montana, North Dakota and South Dakota. U.S. Wheat Associates (USW) estimates 2018 HW production at 894 metric tons (MT), up slightly from 2017’s 883 MT reported by USDA.

Wheat and Grade Data: All six composites graded U.S. No. 1 with test weight ranging from 60.5 to 64.2 lb/bu (79.6 to 84.4 kg/hl). The value ranges of composites are: dockage from 0.0 to 0.6%; wheat moisture from 8.4% to 11.2%; wheat protein from 11.1% to 13.3% (12% mb); wheat ash from 1.37% to 1.59% (14% mb); kernel hardness from 53.3 to 78.2; and kernel diameters from 2.61 to 2.99 mm. The thousand kernel weights (TKW) of Pacific Northwest (PNW) and California low- and high-protein composites are greater than 31.8 g. The TKW values of Southern Plains medium- and high-protein composites are 34.7 and 29.7 g, respectively. Falling number values of 360 sec or higher for all composites indicate all samples are sound.

Flour, Dough and Baking Data: Buhler laboratory mill straight-grade flour extractions range from 71.1% to 74.4%; L* values (whiteness) from 90.4 to 91.9; flour protein from 10.3% to 13.0% (14% mb); and flour ash from 0.42% to 0.48% (14% mb). These values are within the historical ranges of HW flour.

Flour wet gluten contents range from 27.2% to 35.2% depending on flour protein content. Amylograph peak viscosities are between 873 BU and 946 BU, which show good starch pasting properties suitable for Asian noodle applications for all samples. Starch damage values are in the range of 3.6% to 7.8%. Lactic acid SRC values are 139% to 160%, indicating medium to strong gluten strength.

Farinograph water absorptions range from 56.9% to 63.3% and stability times from 9.3 min to 19.5 min, exhibiting the typical HW medium to strong dough characteristics. HW farinograph water absorption is usually similar to that of HRW, but longer stability time indicates more tolerance to over-mixing. The ranges of alveograph values are: P values 64 mm to 98 mm; L values 76 mm to 109 mm; and W values 220 to 317 (10-4 J). Extensograph data at 135-min resting show maximum resistance in the range of 741 BU to 1237 BU, extensibility from 14.5 cm to 22.7 cm and area from 147 cm2 to 218 cm2.

Most samples show good baking performance relative to protein content, with bake absorptions in the range of 61.8% to 68.5%, loaf volumes of 754 cc to 883 cc and crumb grain and texture scores of 6.8 points to 7.0 points.

Noodle Evaluation: HW flours and a control flour were evaluated for both Chinese raw noodles (white salted) and Chinese wet noodles (yellow alkaline). For Chinese raw noodles, the L* values at 0 hr of production and after 24 hr of storage at room temperature are acceptable for all samples except for the PNW, California and Southern Plains high-protein composites, which have L* 24-hr values of 71.9, 70.5, and 71.5, respectively (72 is the minimum value at 24 hr). The sensory color stability scores of all samples are lower than the control noodle score of 7.0. Cooked noodle texture is softer for PNW and California low-protein composites due to the protein content. For Chinese wet noodles, sensory color stability scores are acceptable except for the California low- and high-protein composites and Southern Plains high-protein composites. The cooked noodle texture values of all Chinese wet noodles are acceptable. Overall, this year’s HW samples will produce noodles with more acceptable color if low ash patent flour is used.

Steamed Bread Evaluation: HW flours were evaluated for Asian steamed breads in comparison with a control flour. Results show most samples are acceptable for steamed breads except for the PNW low- and high-protein composites, the total scores of which are low. Blending a small percentage of SW flour with high protein HW flour would improve overall steamed bread quality.

thumbnail

Timely and adequate moisture through the soft white (SW) and white club (WC) growing season and a transition to a warm, dry harvest helped Pacific Northwest (PNW) farmers produce high-quality crops that will provide an excellent range of flour for finished products. The high-protein segment of the SW crop also provides opportunities in blends for Asian noodles, steamed breads, flat breads and pan breads.

USDA estimates total 2018 PNW SW production at 6.03 million metric tons (MMT), up slightly from 2017’s 5.64 MMT. Of that, the Washington Grain Commission estimates white club (WC) accounts for 370 metric tons (MT).

Here is a summary of the season and test results, with full data available online soon and in upcoming USW Crop Quality Seminars.

Wheat and Grade Data: The overall average grade of the 2018 SW and WC crops is U.S. No. 1. The average SW test weight of 61.7 lb/bu (81.1 kg/hl) is higher than last year’s 60.9 lb/bu (80.1 kg/hl); WC test weight of 60.4 lb/bu (79.5 kg/hl) is slightly higher than 2017’s 60.2 lb/bu (79.2 kg/hl). With slight variation, SW and WC grade factors are similar to last year and the 5-year averages. Wheat moisture for both SW and WC is below last year and the 5-year averages, reflecting the dry harvest conditions.

The overall SW and WC wheat protein content (12 percent mb) of 9.3 percent and 9.0 percent, respectively, are 0.3 and 0.4 percentage points below the respective 2017 values and well below the wheat protein 5-year averages. SW wheat ash content (14 percent mb) is slightly higher than last year and the 5-year average; WC wheat ash is higher than last year and the 5-year average. Thousand kernel weights for SW and WC are slightly above 2017 and 5-year average levels. Both SW and WC kernel diameters are slightly larger than last year and the 5-year averages. Falling number values are 315 seconds for SW and 316 seconds for WC are both below last year and the 5-year averages.

Flour and Dough Data: The 2018 SW crop Buhler Laboratory Mill flour extraction average of 72.5 percent is lower than last year and the 5-year average; the WC average of 76.9 percent is higher than last year and the 5-year average. Flour protein content (14 percent mb) is 8.3 percent and 8.0 percent for SW and WC, respectively. Flour ash content (14 percent mb) for both SW and WC is slightly higher than last year, but lower than the 5-year averages. Amylograph peak viscosity value for SW is 497 BU, slightly higher than last year and for WC is 415 BU, lower than last year. Starch damage values are slightly higher for SW and WC than last year, but lower than the 5-year averages. SW and WC solvent retention capacity (SRC) water values are similar to last year and the 5-year averages. SW sucrose and sodium carbonate values are similar to last year, but lower than the 5-year average. SW and WC lactic acid values are higher than last year, but lower than the 5-year averages. SW gluten performance index (GPI) is higher than last year and the 5-year average, and WC GPI is slightly lower than last year and the 5-year average. SW and WC farinograph peak and stability times are close to last year’s and the 5-year averages, while water absorption is higher than last year for SW and the same as last year for WC. The SW and WC alveograph L values are considerably longer than last year and the 5-year averages. SW and WC extensograph resistance is similar to last year and higher than the 5-year averages. SW extensibility value is longer than last year and the 5-year average and WC extensibility is similar to last year and shorter than the 5-year average.

Bake Data: Sponge cake volume for SW at 1066 cc is smaller than last year and the 5-year averages, and the total score is slightly higher than last year and the 5-year average. The sponge cake volume for WC at 1115 cc is smaller than last year and the 5-year average, and total score is higher than last year and the 5-year average. SW and WC cookie diameter values are larger than last year and the 5-year averages. SW and WC cookie spread factors are less than last year and the 5-year averages.

Chinese Southern-Type Steamed Bread: Each flour was made into southern-type steamed bread and compared to a control flour. SW specific volume is the same as last year and the 5-year average. WC specific volume is slightly higher than last year, but slightly lower than the 5-year average. The SW and WC total scores are lower than last year and the 5-year averages.

Wheat food products to illustrate Wheat Industry News

The conscientious husbandry of U.S. farmers and the distinct influence of growing conditions across the Plains and into the Pacific Northwest helped produce a 2018 U.S. hard red winter (HRW) crop that has above average kernel characteristics and, in most cases, higher protein than the previous two crops. Annual crop quality testing sponsored by U.S. Wheat Associates (USW) and its partners from Plains Grains and USDA indicates the 2018 HRW quality attributes significantly exceed the last two years and many of the 5-year averages.

Most people and organizations in the industry consider this one of the highest quality crops in several years and will make high quality end products. This crop meets or exceeds typical HRW contract specifications and should provide high value to our customers.

Here is a summary of the season and test results, with full data soon available online and in USW’s annual Crop Quality Seminars.

Weather and Harvest

The 2018 hard red winter (HRW) planted area was 2.5 percent below the historical low planted area of the 2017 crop. With reduced yields and reduced area, 2018 HRW production is estimated to be 18.0 million metric tons [(MMT) (662 mil bu)], down 12 percent from 2017’s 20.4 MMT and 20 percent below the 5-year average production. Large beginning stocks offset the reduced production so the total HRW supply available for the 2018/19 marketing year is larger than three of the previous 5 years.

Conditions varied across the HRW growing regions. Texas, Oklahoma and Kansas were extremely dry during most of the growing season. By the time harvest started in early June, USDA rated 85 percent of HRW in these three states to be in fair, poor or very poor condition. Late season precipitation helped to establish good kernel characteristics even though rains were too late and insufficient to improve yield. In contrast, 75 percent to 90 percent of the crop rated fair, good or excellent in the remaining states north to eastern Montana. Because of dry conditions, disease and insect pressure was low.

Washington, Oregon, Idaho and central/north central Montana had adequate moisture throughout the year that helped maximize production. More than 90 percent of the HRW grown in these three states was rated fair, good or excellent in late June.

Wheat and Grade Data

Despite challenging growing conditions in many areas, the 2018 crop has generally good kernel characteristics. Overall 93 percent of Composite, 91 percent of Gulf-Tributary and 98 percent of PNW-Tributary samples graded U.S. No. 2 or better. Test weight averages 60.9 lb/bu (80.2 kg/hl), above the 5-year average of 60.3 lb/bu (79.3 kg/hl) and above last year’s average of 60.5 lb/bu (79.6 lb/bu). The total defects average of 1.4 percent is above last year’s average of 1.2 percent, but below the 5-year average of 1.6 percent. Foreign material is 0.2 percent, slightly above last year’s 0.1 percent, while shrunken and broken at 1.1 percent is above last year’s 0.9 percent and equal to the 5-year average. Average thousand kernel weight of 30.9 g exceeds the 5-year average of 29.8 g. The average wheat falling number is 373 seconds, which is comparable to the 2017 and 5-year averages and indicates sound wheat.

The average protein of 12.4 percent (12 percent moisture basis or mb) is significantly higher than last year and equal to the 5-year average. Protein content distribution varies by growing region; the Gulf-Tributary average is 12.7 percent and the PNW-Tributary average is 11.7 percent. Approximately 12 percent of the samples tested were less than 11.5 percent protein, 29 percent between 11.5 percent to 12.5 percent and 60 percent greater than 12.5 percent.

Flour and Baking Data

The Buhler laboratory flour yield average is 75.1 percent, lower than the 2017 average of 78.1 percent and similar to the 5-year average of 75.7 percent. The 2018 flour ash of 0.44 percent (14 percent mb) is significantly lower than last year’s 0.64 percent and the 5-year average of 0.59 percent. Composite sedimentation and wet gluten values, 54.2 cc and 28.1 percent, respectively, are both higher than last year. The W value of 280 (10-4 J) is significantly higher than last year’s average of 199 (10-4 J) and the 5-year average of 228 (10-4 J). average bake absorption is 63.7 percent, above the 62.8 percent value for both 2017 and the 5-year average. Farinograph peak and stability times, 5.2 min and 12.2 min, respectively, are higher than last year’s 4.5 min and 6.1 min. Loaf volume averages 901 cc, above the 2017 and 5-year averages.