By Claire Hutchins, USW Market Analyst
Despite the potential for reduced U.S. hard red spring (HRS) production year-over-year and crop quality concerns on late-harvested HRS, the United States is still well-stocked to meet overseas customer needs throughout marketing year (MY) 2019/20. As domestic sellers and buyers manage their risk in a dynamic market, however, overseas buyers should expect HRS export basis to increase. U.S. Wheat Associates (USW) wants to provide a closer analysis of this rather unique situation.
Unrelenting precipitation in the Northern Plains continued to challenge HRS wheat producers throughout the 2019 harvest season. Excess moisture on unharvested wheat can lead to low falling numbers, reduced test weights, reduced percentage of DHV and increased DON levels. By Sept. 20, only 76 percent of the country’s spring wheat was harvested compared to 96 percent in 2018.
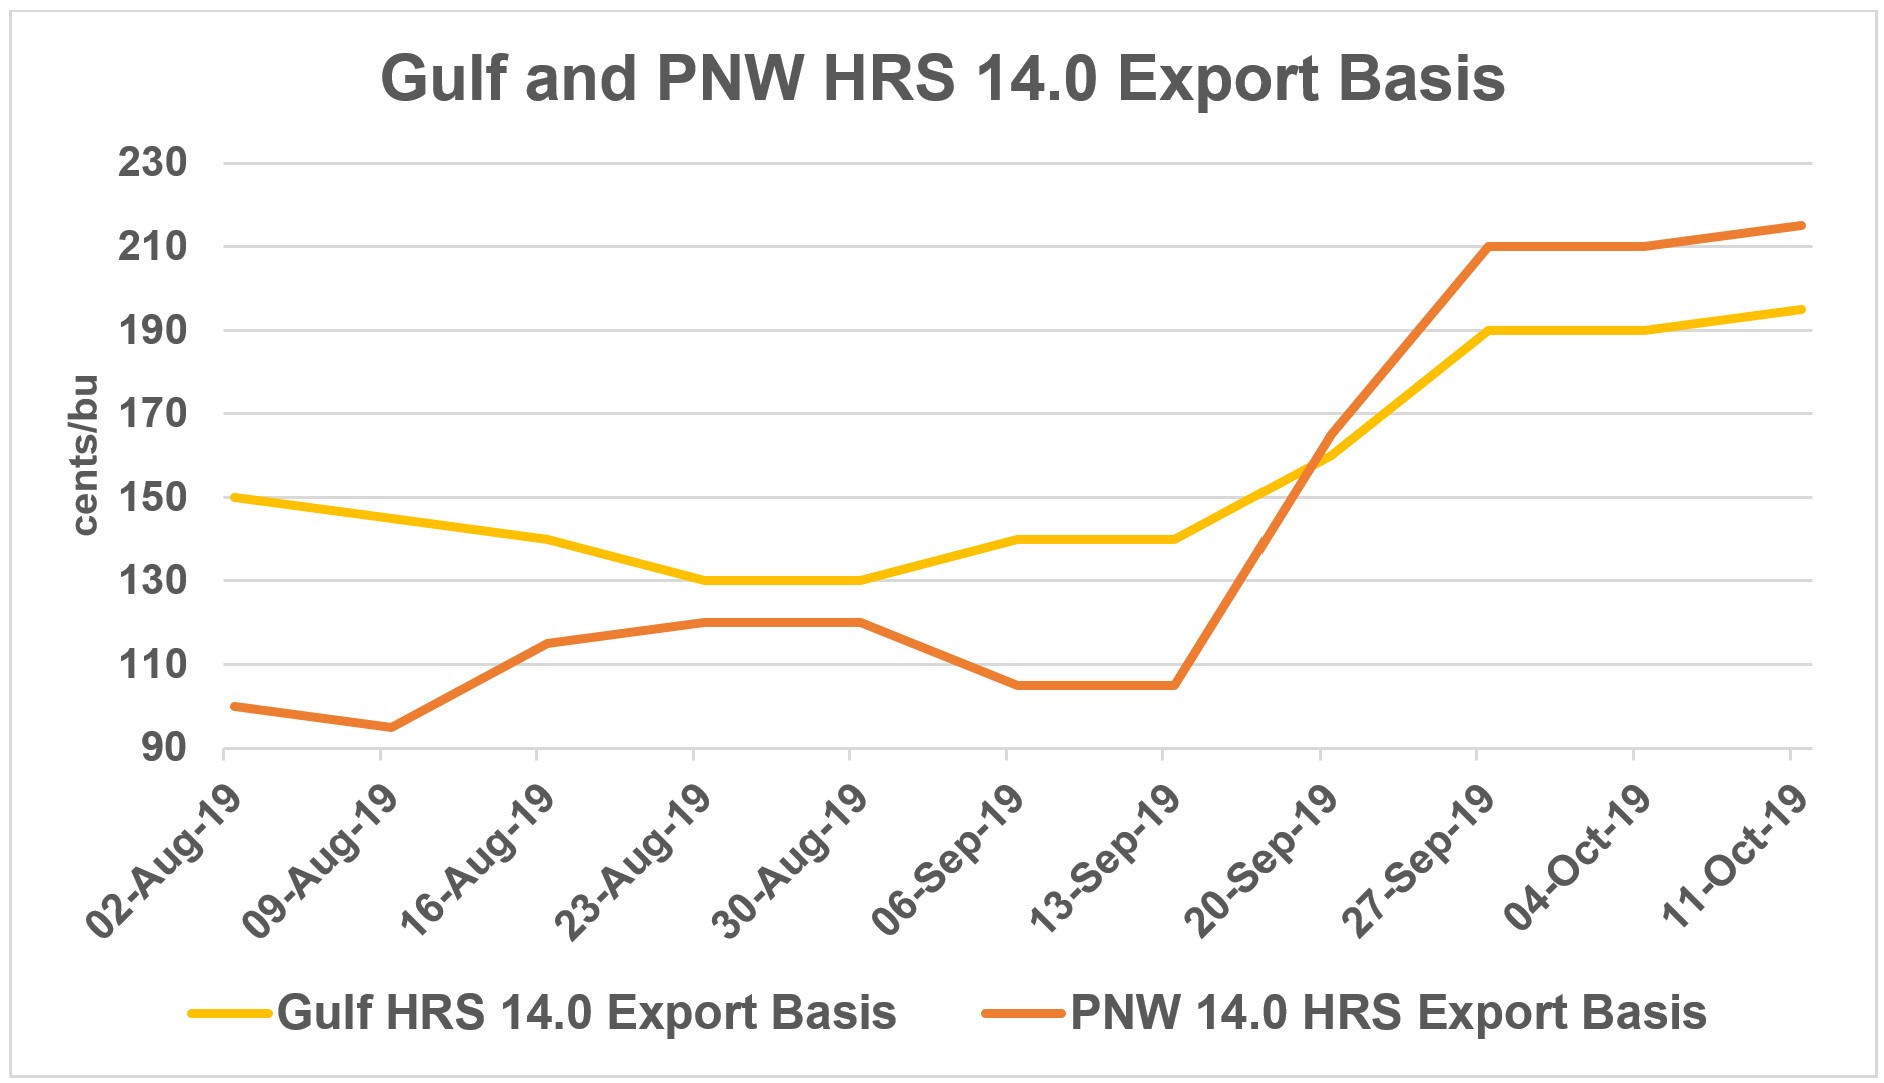
As markets considered potential quality issues on the rest of the harvest, HRS export prices jumped significantly between Sept. 13 and Sept. 20. The average Gulf HRS 14.0 (12% moisture basis) export basis for nearby delivery increased 20 cents/bu from $1.40/bu to $1.60/bu. In the same week, average Pacific Northwest (PNW) HRS 14.0 export basis for nearby delivery jumped 36 percent from $1.05/bu to $1.65/bu. Market uncertainty carried into the week of Sept. 27 when the country’s HRS harvest was only 87 percent complete, well behind the 5-year average of 99 percent. By Sept. 27, the average Gulf HRS 14.0 export basis increased another 30 cents to $1.90/bu and the average PNW HRS 14.0 export basis added 27 percent to $2.10/bu, both driven by crop quality concerns and minimal farmer selling.
In its October World Agricultural Supply and Demand Estimates (WASDE) report, USDA estimated the United States would produce 15.2 million metric tons (MMT) of HRS in 2019. On Oct. 15, USDA reported harvest was 94 percent complete, still well behind the average completion date of around Sept. 30. Many industry sources now believe the HRS harvest is essentially over as farmers struggle to enter their fields due to ongoing precipitation, including heavy snow in parts of North Dakota and Montana. If realized, this would put the total 2019 U.S. HRS harvest closer to 14.3 MMT, 12 percent lower than last year.
As noted, the United States is still well-stocked to meet export throughout MY 2019/20. Industry experts estimate between 60 and 65 percent of this year’s HRS harvest, about 8.94 MMT, is high-quality, milling grade wheat. USDA estimated 2019 HRS beginning stocks at 7.16 MMT. This puts the total supply of U.S. milling wheat in MY 2019/20, including the remainder of last year’s excellent harvest, at 16.1 MMT.
However, customers should be aware that a large portion of these stocks remain in storage as farmers are reluctant to sell wheat at current local prices. HRS export basis levels continue to climb because producers have several incentives to hold their high-quality HRS into the coming months.
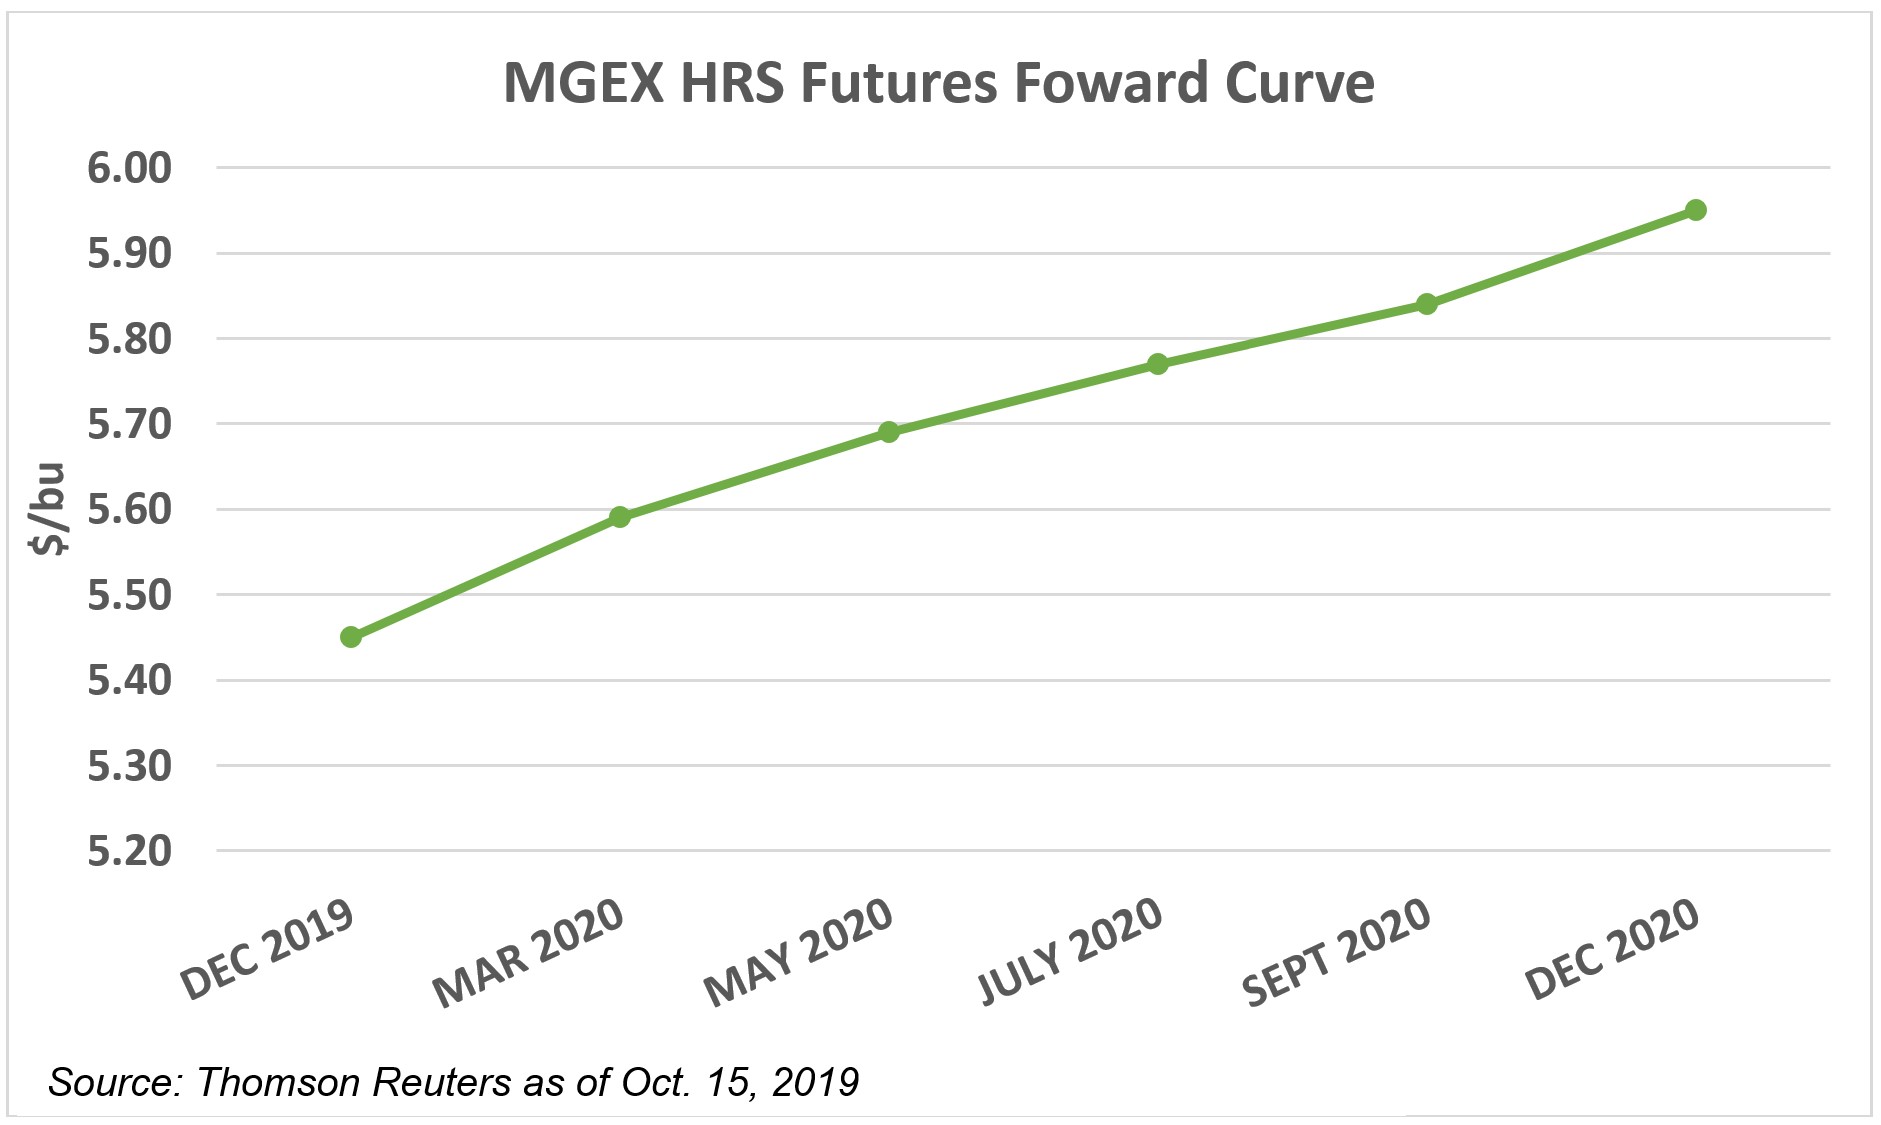
First, Minneapolis Grain Exchange (MGEX) forward futures contracts show a significant carry between December 2019 and December 2020. As of the last trade on Oct. 15, the December 2019 MGEX HRS futures contract (MWEZ19) traded at $5.45/bu while the December 2020 MGEX HRS futures contract (MWEZ20) closed at $5.95/bu. Each MGEX HRS futures contract gains about 10 cents per contract period starting in December 2020, a reason for farmers to hold supplies until cash prices increase.
Second, average local basis levels are firming across the Northern Plains, which signals to farmers that the discount between futures values and the cash price they receive could shrink over time. For example, according to DTN data, the average HRS local basis value in North Dakota decreased from negative $0.79/bu to negative $0.72/bu between Sept. 30 and Oct. 15. At one elevator in North Dakota, the gap between the December futures price and the local cash price shrank 42 percent from negative $1.05/bu to $0.65/bu. Over the same period, the local average HRS cash price in North Dakota increased from $4.66/bu to $4.74/bu.
Finally, storage space is not under pressure. Typically, HRS moves into the market around harvest and when storage space is needed for row crop harvest, which in 2019 has seriously affected in the Northern Plains. For example, the heavy snow hit North Dakota with only 1 percent of the corn harvest and 16 percent of the soybean harvest completed. With no other crops coming out, farms and country elevators do not yet need to move much HRS wheat out of storage.
Given this situation, USW believes HRS export basis will continue to rise until local cash prices increase enough to encourage producers to liquidate their HRS stocks into the milling and export channels. The United States has plenty of high-quality HRS available to sell into MY 2019/20, but it will take a significant shift in local cash price dynamics across the Northern Plains for these supplies to reach export terminals.