The hardest of all U.S. wheat classes, U.S. durum has a rich amber color and high gluten content. Hard Amber Durum (HAD) set the “gold standard” for premium pasta products, couscous and some Mediterranean breads. Durum has a high protein content of 12.0% to 15.0% (12% mb), yellow endosperm and white bran.
For the miller, durum is a large, very hard kernel with the potential for very high extraction of high quality, low ash semolina that is ideal for fine pasta. Desert Durum® is harvested and shipped at a very low moisture content, an advantage to millers that contributes to efficient transportation costs and high extraction rates.
For consumers of pasta, couscous and Mediterranean breads, durum helps deliver excellent color and texture.
Where is U.S. durum grown?
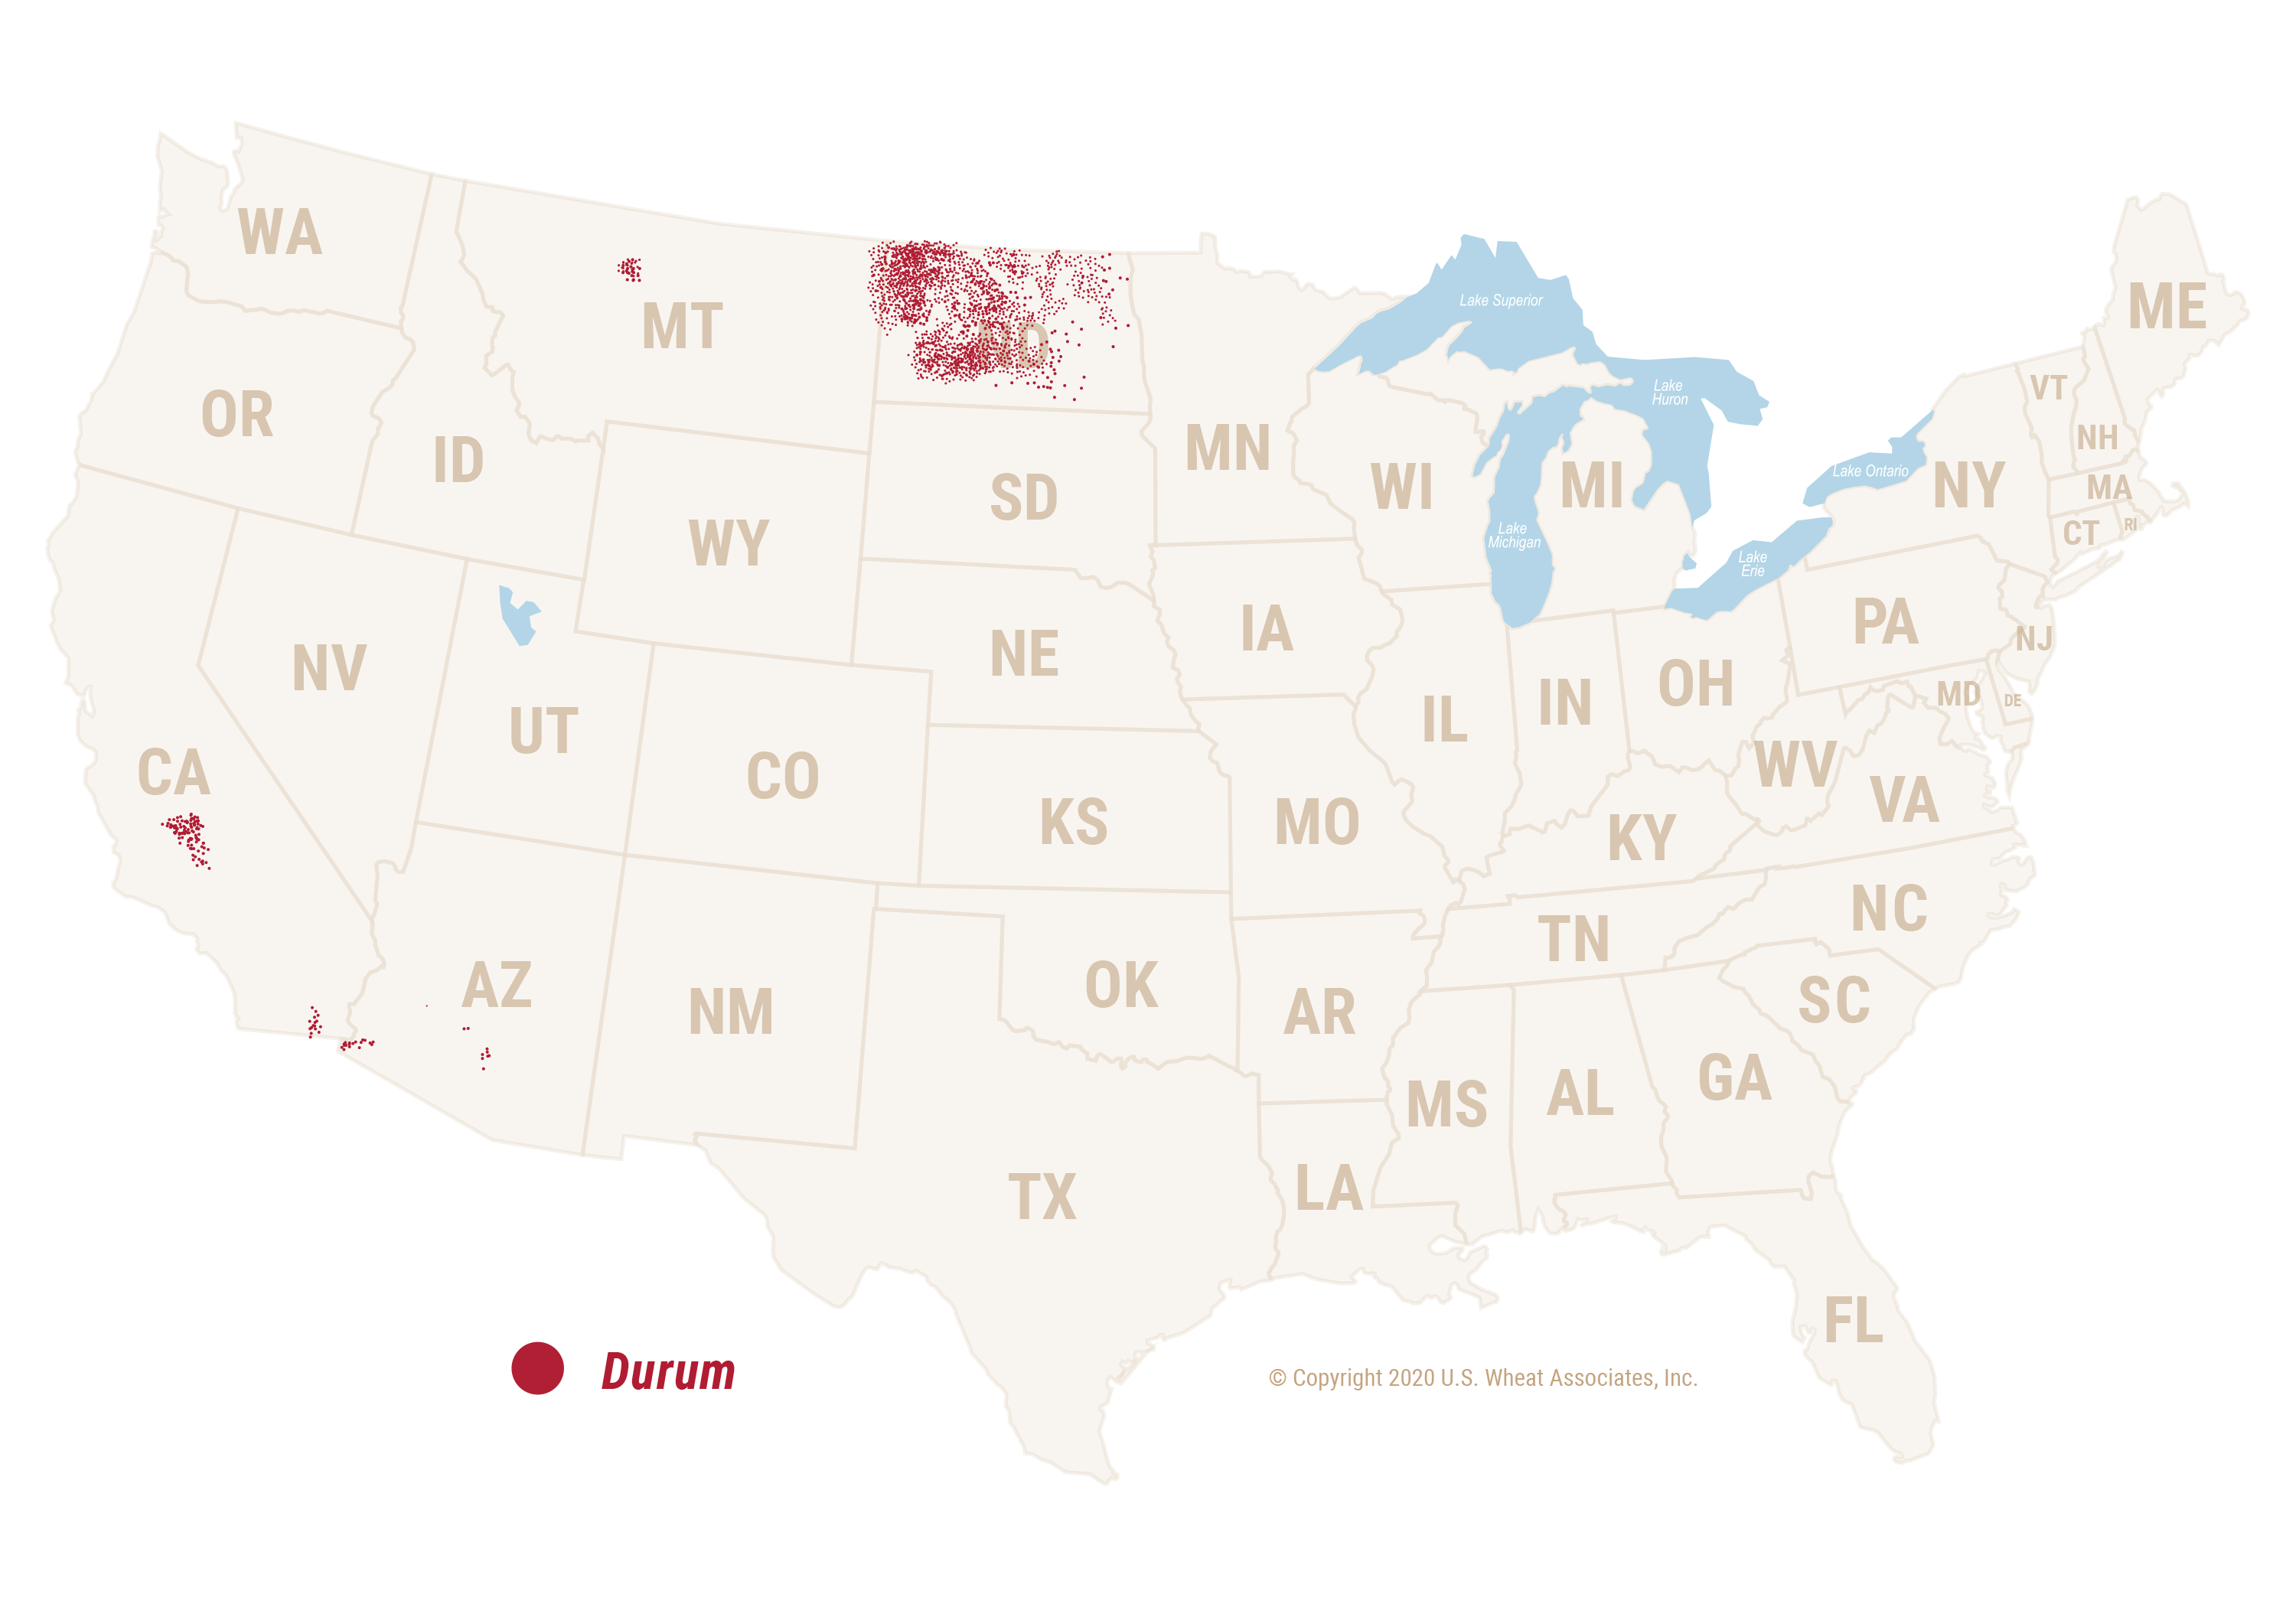
Durum is the fifth largest class of wheat grown in the United States. Northern durum is grown primarily in the North Central region (North Dakota and Montana) and shipped via Gulf, Great Lakes and Pacific ports, while Desert Durum®, is grown primarily under contract in the desert Southwest (Arizona and California) and shipped via the Gulf or West Coast.
Please select your preferred language, report, and year, and click View Reports.
2023 U.S. Durum Production
According to USDA’s Small Grains Annual Summary released September 29, 2023, production of the 2023 U.S. durum crop is estimated to be 1.6 million metric tons (MMT), down 7% from 1.7 MMT in 2023 and equal to the 5-year average.
- 2023 (MMT)
- Total durum production in states sampled
- Northern Durum subtotal
- Desert Durum® subtotal
- Total U.S. Durum Production
- 2023 (MMT)
- 1.6
- 1.4
- 0.2
- 1.6
- 2022 (MMT)
- 1.7
- 1.4
- 0.4
- 1.7
- 5-Year Average (MMT)
- 1.5
- 1.3
- 0.2
- 1.6
*States sampled: Arizona, California, Montana and North Dakota. Numbers may not match exactly due to rounding.
2023 U.S. Durum Crop Quality Data Highlights
Strong features of the 2023 Northern Durum crop include higher protein, strong grades, low damage, good test weights, and sound kernel characteristics. Diligent contract specifications will help manage some variable quality parameters, especially vitreous kernel content. The crop shows increased gluten strength and end-use characteristics similar to an average crop. Overall, this crop will meet the needs of customers.
U.S. NORTHERN DURUM AVERAGE DATA HIGHIGHTS
The table below provides highlights of the 2023 Northern Durum crop. For full quality results, please see the U.S. Wheat Associates Crop Quality Report.
- 2023 Average
- Test Weight (lb/bu)
- Test Weight (kg/hl)
- Vitreous Kernels (%)
- Moisture (%)
- Wheat Protein (%) 12% mb
- Wheat Protein (%) 0% mb
- Wheat Falling Number (sec)
- DON (ppm)
- 2023 Average
- 61.3
- 79.8
- 79
- 11.5
- 13.9
- 16.1
- 394
<0.5
- 2022 Average
- 61.8
- 80.4
- 92
- 11.0
- 13.7
- 15.6
- 433
<0.5
- 5-Year Average
- 61.4
- 79.9
- 84
- 11.2
- 13.9
- 16.1
- 410
<0.5
U.S. DESERT DURUM® AVERAGE DATA HIGHIGHTS
The table below provides highlights of the Desert Durum® 2023 crop. For full quality results, please see the U.S. Wheat Associates Crop Quality Report.
- 2023 Average
- Test Weight (lb/bu)
- Test Weight (kg/hl)
- Vitreous Kernels (%)
- Moisture (%)
- Wheat Protein (%) 12% mb
- Wheat Protein (%) 0% mb
- Wheat Falling Number (sec)
- 2023 Average
- 63.0
- 82.0
- 98
- 7.6
- 13.6
- 15.8
- 607
- 2022 Average
- 64.1
- 83.4
- 98
- 7.3
- 13.2
- 15.3
- 713
- 5-Year Average
- 63.2
- 82.3
- 98
- 7.1
- 13.8
- 16.0
- 643


