Latest USDA Report Adjusts Earlier U.S. Wheat Production Estimates
By Claire Hutchins, U.S. Wheat Associates Market Analyst
On Sept. 30, USDA released its latest Small Grains Summary in which its estimate of 2020 U.S wheat production fell to 49.7 million metric tons (MMT). That is down 5 percent from last year and 8 percent below the 5-year average due to reduced yields and lower harvested area. In its report, wheat production, yield and harvested area estimates all fell from the USDA’s Sept. 11 World Agricultural Supply and Demand Estimates (WASDE) report.
While production was down this year, the harvest volume coupled with significant carry-in stocks of 28.4 MMT ensure that a reliable supply of U.S. wheat for 2020/21 remains.
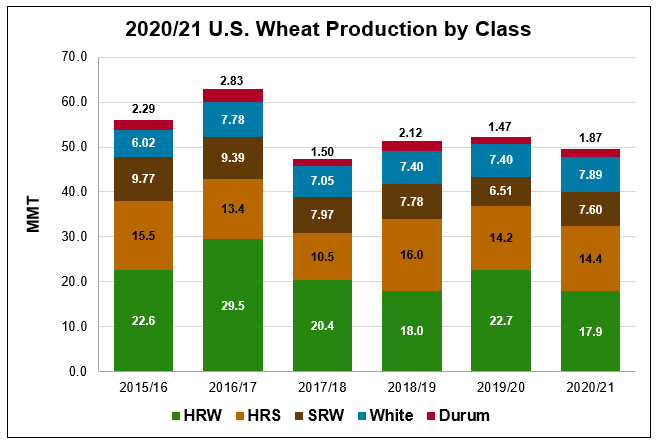
Here is a look at 2020/21 U.S. wheat production by class.
Source: USDA 2020 Small Grains Summary
Hard Red Winter (HRW). According to USDA, total HRW planted area fell 4 percent from last year to 21.5 million acres (8.70 million hectares). Significant yield reductions in Colorado and Kansas due to extreme dryness added pressure to overall U.S. HRW production of 17.9 MMT, down 21 percent from last year and the 5-year average. Though dryness across the Southern Plains challenged producers during the growing season, it made for a quick 2020 harvest with minimal issues. Harvest sample data shows the average HRW protein level at 11.9 percent (on a 12 percent moisture basis), 5 percent more than last year and 2 percent more than the 5-year average. The crop’s moisture level is down 5 percent from last year at 10.9 percent. The average test weight is up significantly on the year at 61.7 lb/bu (81.1 kg/hl), which is 2 percent more than the 5-year average.
Hard Red Spring (HRS). USDA estimates total HRS planted area for harvest in 2020 fell 4 percent from last year to 11.5 million acres (4.66 million hectares), 2 percent below the 5-year average due to overly wet field conditions at planting and concerns over farmer profitability, specifically in eastern North Dakota and northwestern Minnesota. North Dakota HRS planted area fell 15 percent from last year to 5.70 million acres (2.31 million hectares) and Minnesota planted area fell slightly from 2019 to 1.43 million acres (579,000 hectares). USDA estimates total HRS production will reach 14.4 MMT, up 1 percent from last year and 4 percent more than the 5-year average. As of Sept. 25, 94 percent of the HRS crop was in the bin. Harvest data shows stable average HRS protein levels at 14.4 percent and a higher average DHV content of 63.0, up 21 percent from last year on significantly more favorable harvest conditions. The average HRS test weight is up 1 percent from last year at 61.6 lb/bu (81.0 kg/hl).
Soft Red Winter (SRW). USDA adjusted total area planted to SRW in fall 2019 for harvest in 2020 up 8 percent on the year to 5.63 million acres (2.28 million hectares) as producers returned to a trendline planting pattern following extremely poor marketing conditions in fall 2018. USDA estimates total SRW production in 2020 reached 7.60 MMT, up 17 percent from the year prior. Favorable weather conditions helped farmers with a rapid harvest. Overall, the 2020 SRW crop is sound and features very good quality characteristics. The 2020 USW SRW Crop Quality Report is available online.
White Wheat (Soft White, Club and Hard White). White wheat planted area, which includes more than 99 percent soft white (SW), totaled 4.12 million acres (1.67 million hectares) for harvest in 2020, in line with last year and the 5-year average. Significantly higher yields in Washington and Idaho boosted total U.S. white wheat production to 7.89 MMT, up 6 percent from last year and 11 percent more than the 5-year average. Dry conditions during harvest accelerated farmer progress through the late summer and autumn. When compared to last year, this year’s soft white (SW) harvest samples show a higher average test weight at 61.9 lb/bu (81.4 kg/hl) and a higher average falling number value of 323 seconds. The average SW moisture level is down 7 percent from last year at 9.20 percent and the average protein level is down from last year and the 5-year average at 9.80 percent.
Durum. Strong market prices at planting time supported total U.S. durum planted area in 2020 at 1.68 million acres (680,000 hectares), up 25 percent from last year. Significantly higher planted area more than offset reduced average yields. USDA expects total U.S. durum production will reach 1.87 MMT in 2020, up 27 percent on the year. As of Sept. 25, durum harvest stood at 91 percent and 70 percent of the expected samples had been tested. Early sample data shows slightly higher average protein levels than last year at 13.7 percent. The average test weight is up 2 percent from last year and the 5-year average at 62.0 lb/bu (80.7 kg/hl).
