• Facebook
  • Twitter
  • Vimeo
  • LinkedIn
  • SUBSCRIBE
  • MEMBER LOGIN
U.S. Wheat Associates
  • Our Story
    • About USW
    • Dependable People. Reliable Wheat.
    • Board of Directors
    • Staff Directory
    • Office Locations
  • Market Information
    • Market Information
    • Price Reports
    • Price Charting Tools
    • Supply and Demand
    • Commercial Sales
  • Crop Quality
    • Crop Quality
    • Harvest Reports
    • Hard Red Winter
    • Hard Red Spring
    • Hard White
    • Soft White
    • Soft Red Winter
    • Durum
  • Working With Buyers
    • Working With Buyers
    • Customer Conferences
    • Wheat Classes
    • Wheat Glossary
    • Wheat Grade Factors
    • How to Buy
    • Ask the Expert
    • Resources
  • Who We Represent
    • Who We Represent
    • Board Meetings
    • State Wheat Commissions
    • Partners
    • Trade Activities
  • Policy
    • Policy
    • Trade Negotiations
    • Trade Barriers
    • Innovation and Sustainability
    • Food Security and Assistance
    • Public–Private Partnership
  • News
    • Newsroom
    • Wheat Letter Blog
    • News Releases
    • Videos
  • Search
  • Menu Menu
You are here: Wheat Letter Blog 1
Market and Crop Analysis

Quiet WASDE Includes Falling World Wheat Stocks

Chart of USDA WASDE data showing world wheat production, use and trade all increasing since 2013.

USDA released its December World Agricultural Supply and Demand Estimates (WASDE) report Dec. 9, 2022, that included no substantial changes for global and domestic wheat markets. Given the overall volatility in 2022, a somewhat calming report was probably a blessing in disguise for wheat buyers who should, however, keep an eye on declining global stocks and exportable supplies.

Each month, U.S. Wheat Associates (USW) updates a graphic summary the WASDE report that includes global wheat market factors, major country and regional export history, and U.S. wheat supply and demand summaries by class. Readers can review the report online here. Some highlights from the December report follow.

Stocks to Fall

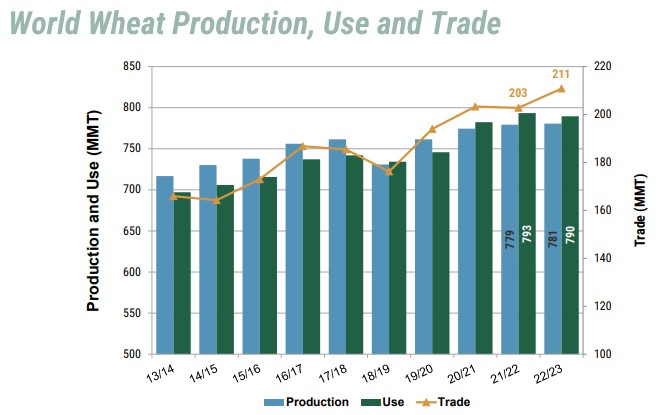
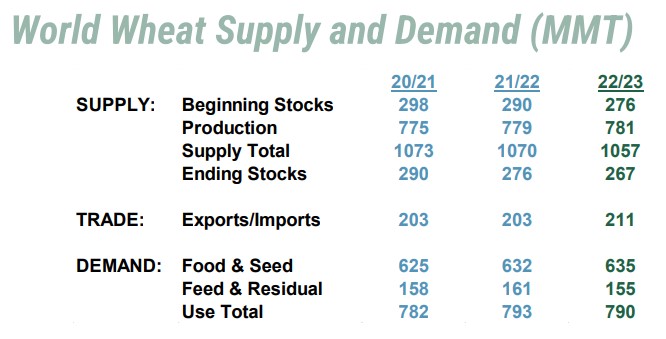
Based on USDA’s latest global wheat production estimate of 781 million metric tons (MMT) and total use of 790 MMT, marketing year 2022/23 will be the third in a row and the fourth in the last five years in which use has exceeded production.

The WASDE report included a 500,000 metric ton drop in estimated global ending wheat stocks to 267.3 MMT. If realized, those supplies will be the lowest since 2013/14. Of that total, an estimated 54.5 MMT will be found in “Exporter” countries, 68.4 MMT will be in “Importer” countries and 144 MMT will be in China. That means 54% of global ending stocks are locked out of world trade, an amount that is up from USDA’s estimate of about 51% in December 2021.

Bar chart showing the global wheat Ending Stocks to Use ratios since 13/14.

Locked in China. Global wheat stocks-to-use ratios are much lower when China’s 144 MMT of wheat stocks are removed from the equation. The down-trend is clear and has accelerated since 2019/20. The current stocks-to-use ratio of 19% without China, which does not export wheat, is the  lowest level in more than 10 years. Source: USDA, U.S. Wheat Associates.

Given the poor condition of the Argentina wheat crop, USDA lowered ending stocks there by 500,000 metric tons, but increased European and Australian ending stocks. Analysts were somewhat surprised USDA did not change its 91 MMT estimate of Russian wheat production.

While USDA did not change its U.S. ending stocks estimate of 15.54 MMT in the latest WASDE report, it is the lowest U.S. ending stocks since marketing year 2007/08. Buyers that were in the market that year will remember the stunning run up in wheat prices fueled by extremely low global stocks. At one point that year, only a few weeks of world wheat supplies were available.

Low Exportable Supplies

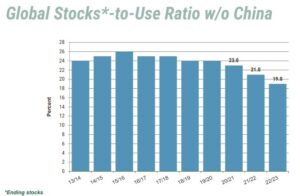
In a video presentation on World Wheat Supply and Demand recorded for 2022 USW Crop Quality Seminars, USW Vice President and West Coast Office Director Steve Wirsching showed that ending stocks among exporting countries have declined significantly over the past five years.

“When exporters hold so few stocks, this increases market volatility and leads to higher wheat prices,” Wirsching said. A condition made even more uncertain by Russia’s on-going incursion into Ukraine.

Data from USDA's December WASDE report show wheat stocks are down, trade is up and use is up in 2022.

Wheat’s Balance Sheet. Data from USDA reflects the trend behind higher global wheat prices: falling supplies, increased trade and record demand year-over-year.

Trade Volume to Increase

The world wheat trade estimate increased in December by 2.2 MMT to 210.9 MMT. December’s report suggests higher exports from Ukraine, Russia and the EU. While expecting Australia’s exports to reach 27.5 MMT, almost a record volume, USDA also noted that a significant portion of Australia’s exports will be for animal feed following harvest rain and lower quality in New South Wales. The world total estimated exports and imports for the year now stands at 211 MMT

USDA did not change its U.S. wheat export volume estimate of 21.1 MMT, with slightly lower soft red winter (SRW) offsetting slightly higher hard red spring (HRW) and soft white (SW) exports.

December 13, 2022/by Steve Mercer
Share this
  • Share on Facebook
  • Share on Twitter
  • Share on WhatsApp
  • Share on LinkedIn
  • Share by Mail
https://www.uswheat.org/wp-content/uploads/World-Wheat-Production-Use-and-Trade.jpg 415 661 Steve Mercer https://www.uswheat.org/wp-content/uploads/USW-Logo-Full-Color.png Steve Mercer2022-12-13 17:11:252022-12-14 18:03:42Quiet WASDE Includes Falling World Wheat Stocks

Wheatletter Sidebar

Quick Links

  • Newsroom
  • Wheat Letter Blog
  • News Releases
  • Videos

Wheat Letter Related Blogs

A woman in a greenhouse at the Washington State University showing wheat breeding research to a Korean man.
Wheat Industry News

Wheat Industry News

News and Information from Around the U.S. Wheat Industry   Speaking of Wheat “The…
MORE
February 2, 2023
https://www.uswheat.org/wp-content/uploads/IMG_1653-scaled.jpg 1920 2560 Steve Mercer https://www.uswheat.org/wp-content/uploads/USW-Logo-Full-Color.png Steve Mercer2023-02-02 10:26:332023-02-02 10:26:33Wheat Industry News
Image shows farmers in a wheat field with the USW logo and World Wheat Supply and Demand headline to illustrate story on wheat prices.
Market and Crop Analysis

Wheat Prices Trend Lower Even As Uncertainty Continues

Following a year of dramatic volatility, several factors have pressured global wheat prices…
MORE
January 30, 2023
https://www.uswheat.org/wp-content/uploads/Wheat-SD.jpg 763 1318 Steve Mercer https://www.uswheat.org/wp-content/uploads/USW-Logo-Full-Color.png Steve Mercer2023-01-30 17:47:322023-01-30 17:47:32Wheat Prices Trend Lower Even As Uncertainty Continues

Stay up to date on wheat industry news!

SUBSCRIBE

Think Farm Export Programs Don’t Matter? Think Again.

GET THE REST OF THE STORY

Our Story

  • About USW
  • Dependable People. Reliable Wheat.
  • Board of Directors
  • Staff Directory
  • Office Locations

Market Information

  • Market Information
  • Price Reports
  • Price Charting Tools
  • Supply and Demand
  • Commercial Sales

Crop Quality

  • Crop Quality
  • Harvest Reports
  • Hard Red Winter
  • Hard Red Spring
  • Hard White
  • Soft White
  • Soft Red Winter
  • Durum

Working with Buyers

  • Working With Buyers
  • Customer Conferences
  • Wheat Classes
  • Wheat Glossary
  • Wheat Grade Factors
  • How to Buy
  • Ask the Expert
  • Resources

Who We Represent

  • Who We Represent
  • Board Meetings
  • State Wheat Commissions
  • Partners
  • Trade Activities

Policy

  • Policy
  • Trade Negotiations
  • Trade Barriers
  • Innovation and Sustainability
  • Food Security and Assistance
  • Public-Private Partnership

News

  • Newsroom
  • Wheat Letter Blog
  • News Releases
  • Videos

DTN Wheat Detail
DTN Corn Detail

2008-2013 U.S. Wheat Associates. All Rights Reserved
Privacy Policy | Non-Discrimination Statement

Scroll to top