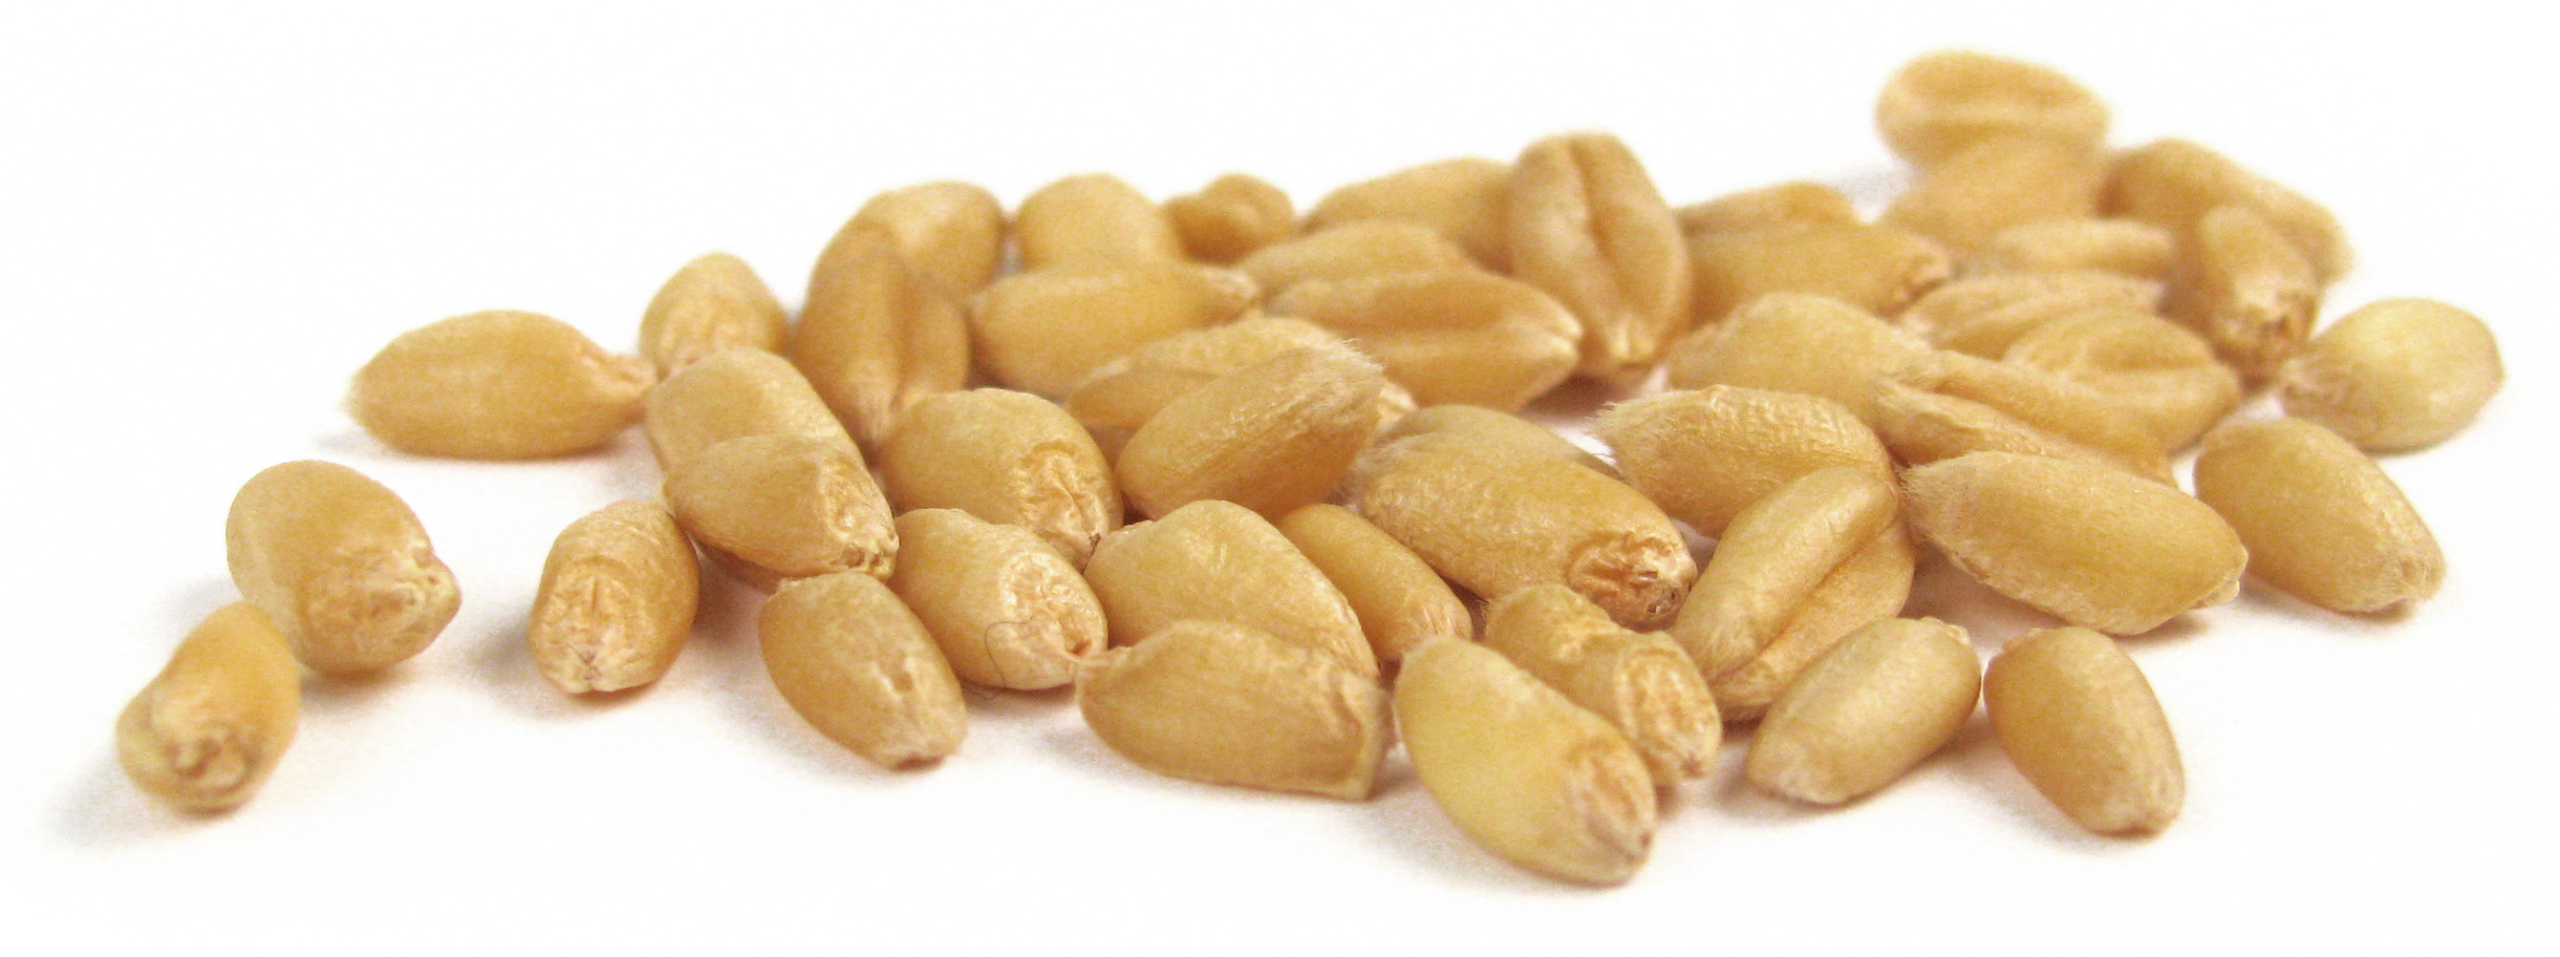
2020 Soft White Wheat Crop Yields Excellent Performance Characteristics

The Pacific Northwest (PNW) experienced excellent growing conditions in 2020 resulting in a soft white (SW) and white club (WC) crop with very good quality and yields. The crop had lower protein and moisture with consistently high grade factors. Overall quality is characterized by very weak to medium gluten strength with excellent potential to produce SW and SW blended flour products. Average test weights for SW and WC are greater than in 2019 composites with good falling number and kernel characteristics. Flour characteristics align with protein contents and show good color and FN values with slightly lower flour yield than the 5-year average. Farinograph water absorptions are desirably low for both SW and WC, with weak to medium gluten characteristics for SW and very weak gluten for WC. For finished products, low protein composites produced good sponge cake total scores and cookie diameters. Higher protein composites showed good total scores for Chinese southern-style steamed breads.
U.S. Wheat Associates (USW) has posted the full 2020 Soft White Wheat Quality Report on its website here.
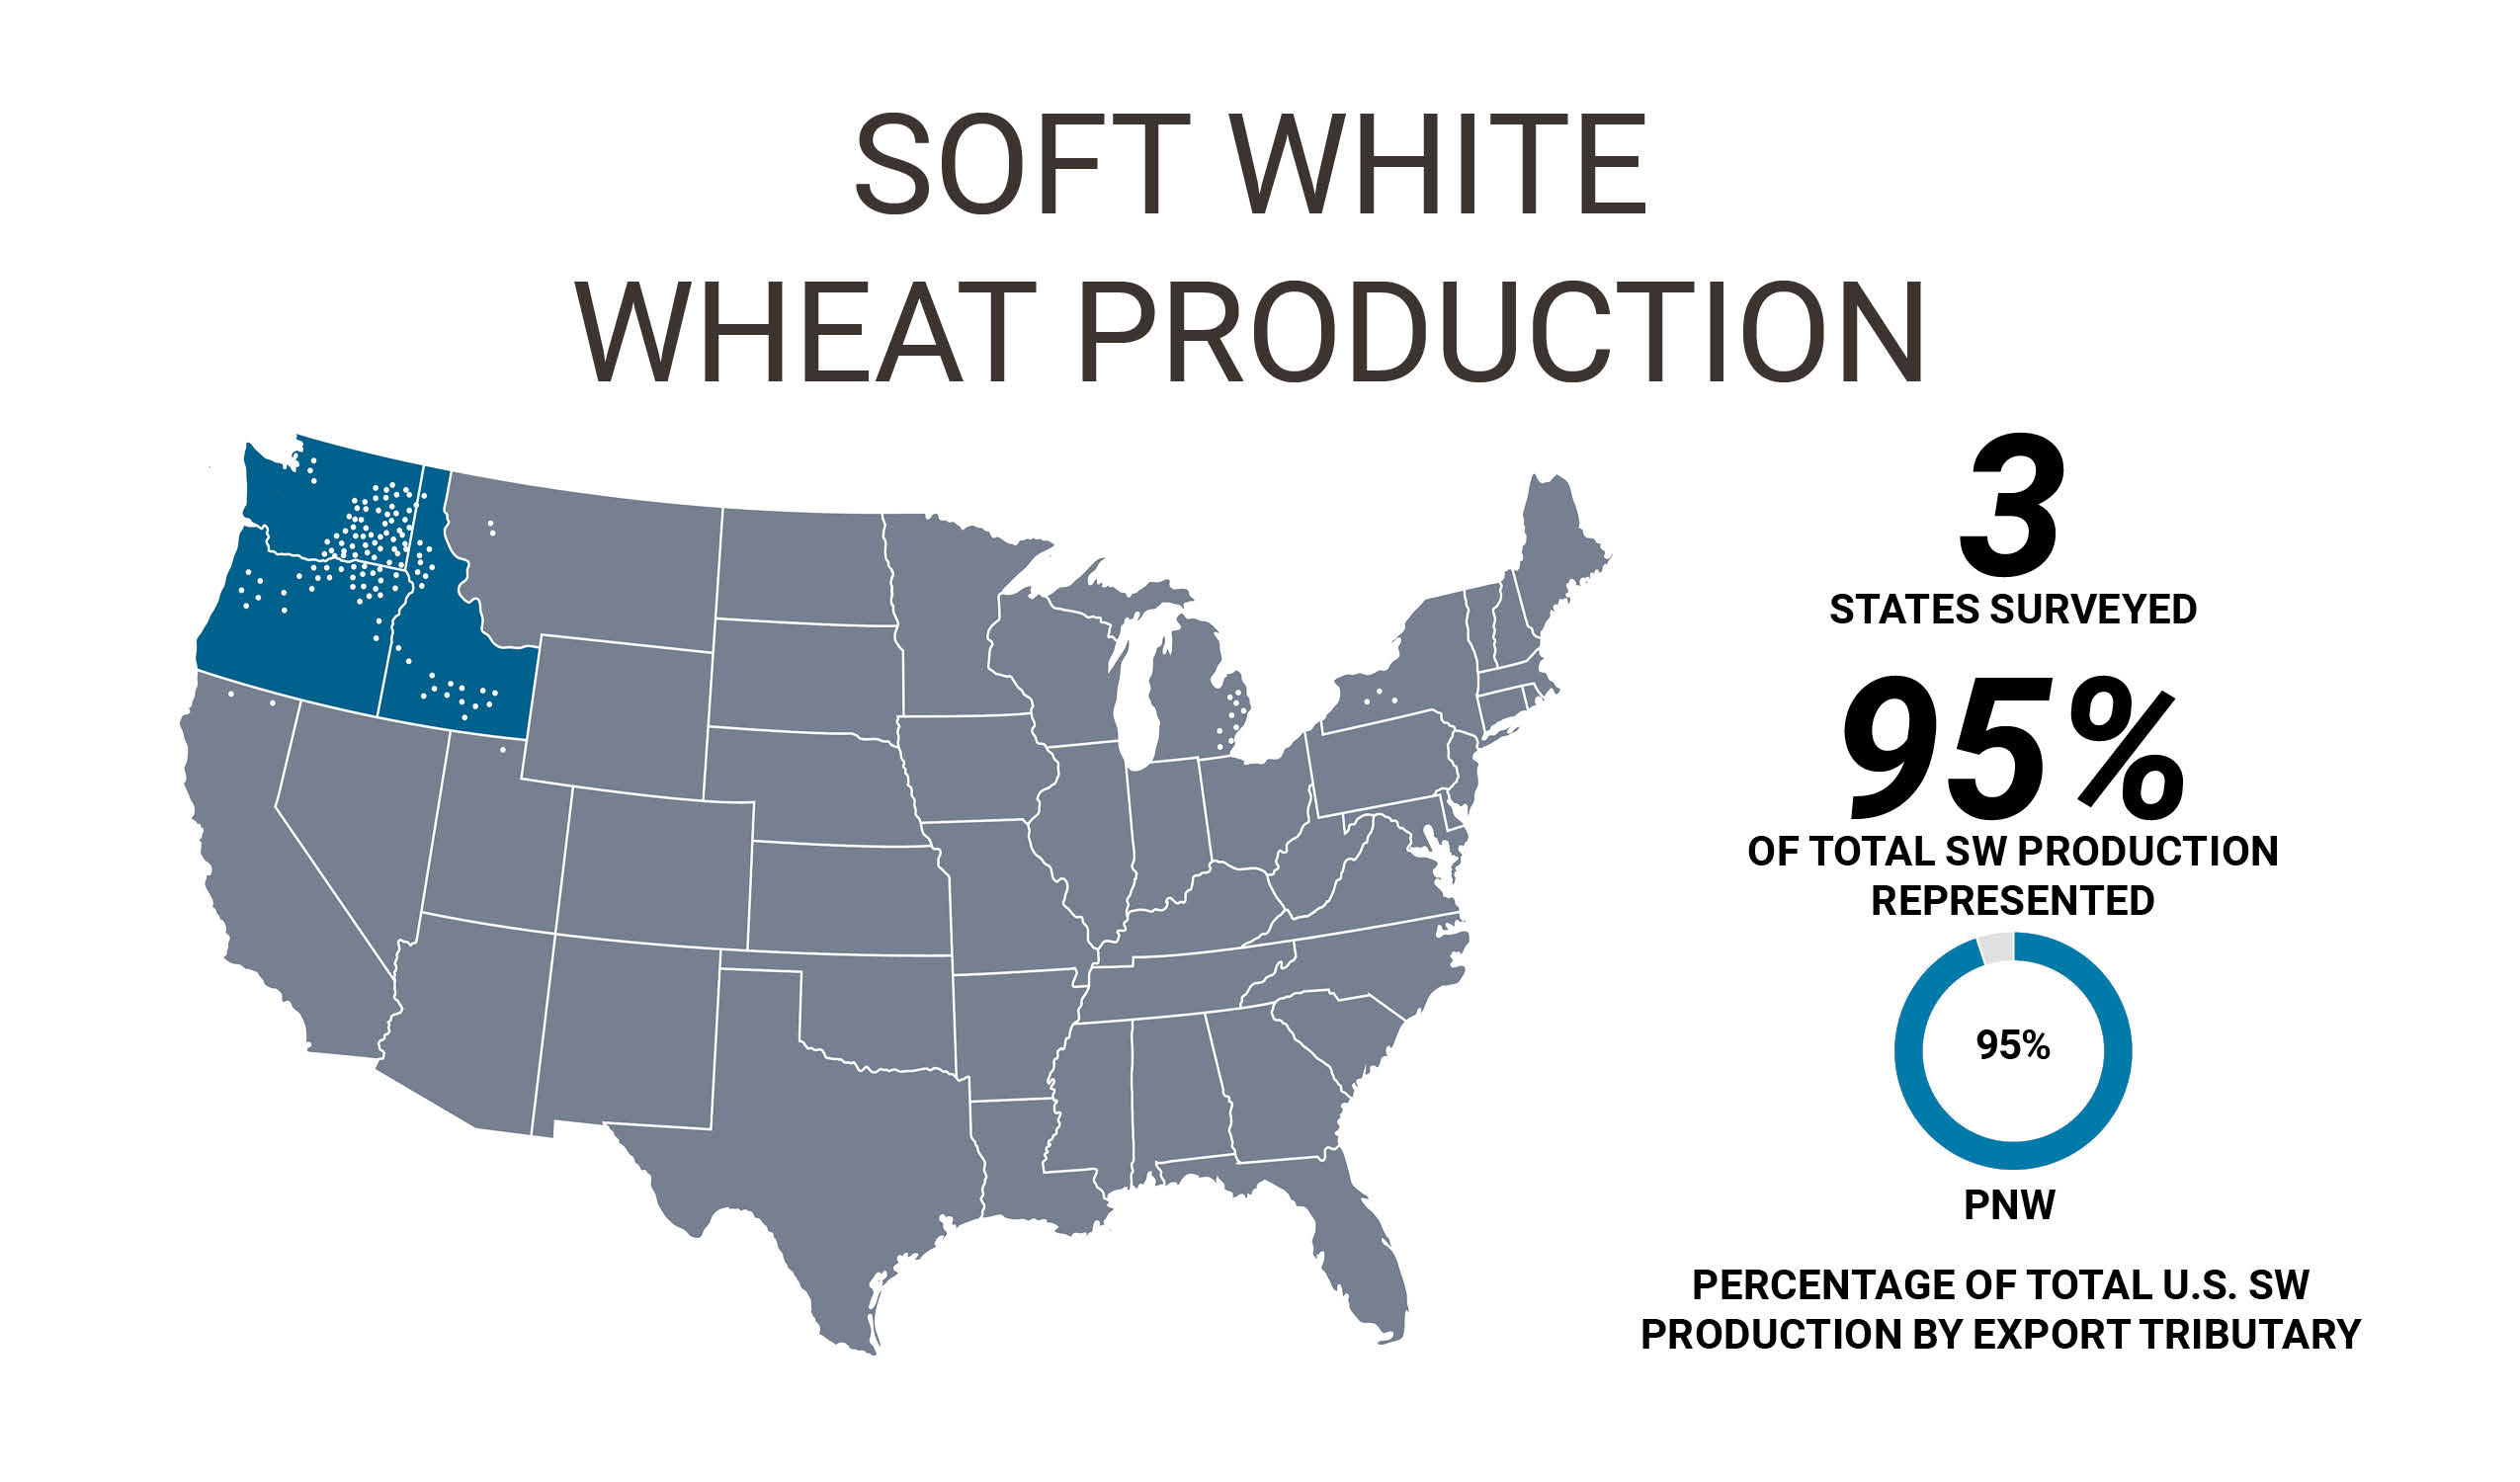
With adequate moisture at planting for winter and spring SW and WC varieties, and timely rains through May and June, yields were above average in Washington and Idaho and average in Oregon. USDA estimates total 2020 PNW SW production at 7.2 million metric tons (MMT), a new record for the region. Of the total, WC production is estimated at 0.26 MMT.
Here are highlights of data from the 2020 SW and WC wheat crop.
WHEAT AND GRADE DATA:
- Grade – the overall averages are U.S. No. 1 SWH and U.S. No. 1 WHCB.
- Test Weight averages are 61.9 lb/bu for SW and 61.6 lb/bu for WC, both well above the 5-year average.
- Dockage, total defects and foreign material averages are low and similar to 2019 and the 5-year averages.
- Wheat Protein at 9.8 (12% mb) for SW and WC is lower than the 5-year averages.
- 1000 Kernel Weight average of 36.3 g (14% mb) for SW and 32.3 g for WC are significantly higher than the 5-year averages.
- Wheat Falling Number – SW average is 323 sec and WC average is 322, indicative of sound wheat.
FLOUR AND BAKING DATA:
- Laboratory Mill Flour Extraction average for SW is 72.6%, slightly lower than the 5-year averages of 74.5%, while WC average is 74.7%, which is higher than the 5-year average.
- Flour Ash levels of 0.43% (14% mb) for SW is slightly lower than the 5-year average; WC levels of 0.48% is slightly more than the 5-year average.
- Alveograph L value of 112 (mm) for SW is significantly higher than the 5-year average of 101; WC L value of 101 is also well over the 5-year average of 76. Alveograph W value (10-4 J) for SW is 94 compared to a 5-year average of 91, with WC at 37, which is slightly below the 5-year average.
- Farinograph peak and stability times of 1.9 and 2.3 min, respectively, for SW and 1.3 and 1.1, respectively, for WC indicate desirable weak dough characteristics.
- Sponge Cake Volumes ranged from 1,088 to 1,171 cc with a weighted average of 1,120 cc for SW, with total score at 45. Volume for WC averaged 1,129 cc with a total score of 47.
- Cookie Diameters for SW are 8.7 to 9.2 cm with spread factors of 9.6 to 11.4. WC cookie diameter and spread factor are 8.7 and 10.2 cm, respectively.
- Chinese Southern-Style Steamed Breads analysis show SW volumes are 1.4 to 2.1 mL/g with total scores equal to or better than the control at 70 mL/g. WC specific volume is 2.1 mL/g with a total score below the control.
Buyers are encouraged to review their quality specifications to ensure that their purchases meet their expectations.
View other summaries of the 2020 U.S. wheat crop:
Hard Red Winter
Hard Red Spring
Hard White
Soft Red Winter
Durum
View the full 2020 U.S. Crop Quality Report and other related resources here.
