• Facebook
  • Twitter
  • Vimeo
  • LinkedIn
  • SUBSCRIBE
  • MEMBER LOGIN
U.S. Wheat Associates
  • Our Story
    • About USW
    • Dependable People. Reliable Wheat.
    • Board of Directors
    • Staff Directory
    • Office Locations
  • Market Information
    • Market Information
    • Price Reports
    • Price Charting Tools
    • Supply and Demand
    • Commercial Sales
  • Crop Quality
    • Crop Quality
    • Harvest Reports
    • Hard Red Winter
    • Hard Red Spring
    • Hard White
    • Soft White
    • Soft Red Winter
    • Durum
  • Working With Buyers
    • Working With Buyers
    • Customer Conferences
    • Wheat Classes
    • Wheat Glossary
    • Wheat Grade Factors
    • How to Buy
    • Ask the Expert
    • Resources
  • Who We Represent
    • Who We Represent
    • Board Meetings
    • State Wheat Commissions
    • Partners
    • Trade Activities
  • Policy
    • Policy
    • Trade Negotiations
    • Trade Barriers
    • Innovation and Sustainability
    • Food Security and Assistance
    • Public–Private Partnership
  • News
    • Newsroom
    • Wheat Letter Blog
    • News Releases
    • Videos
  • Search
  • Menu Menu
You are here: Wheat Letter Blog 1
Soft White, Wheat Quality

2022 Soft White Wheat Crop Delivers Performance Customers Have Come to Expect

USW Soft White Crop Quality Header Image

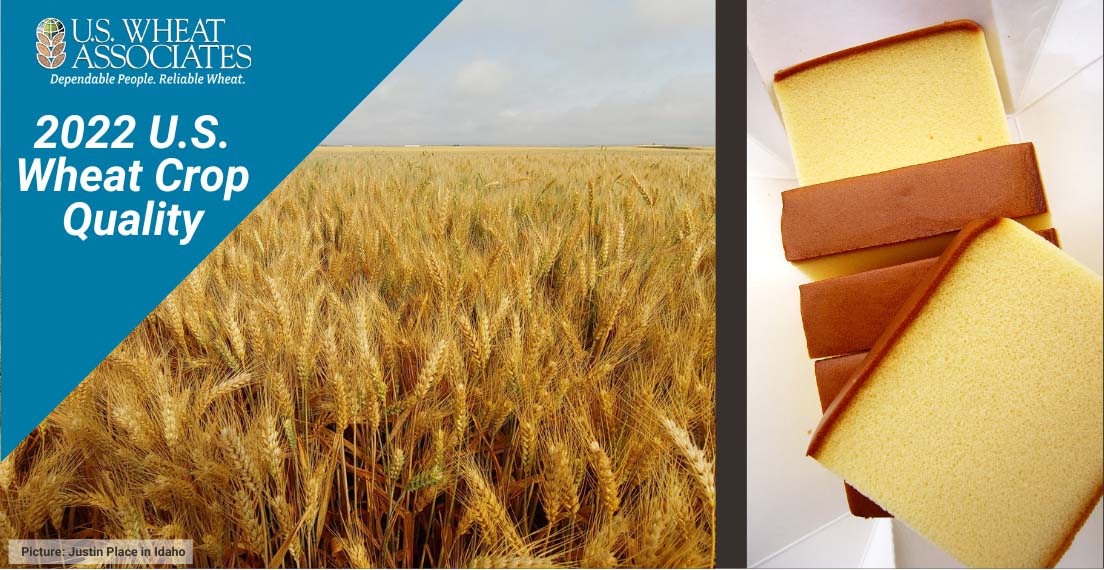
The return to more normal growing conditions for the 2022/23 Pacific Northwest (PNW) U.S. soft white (SW) wheat crop offers typically performance in producing the world’s finest cakes, pastries, biscuits and snack foods.

Compared to the drought stressed 2021/22 crop, soft white this year has very weak to medium gluten strength and good finished product characteristics. Higher protein SW supplies provide opportunities in flour blends for crackers, Asian noodles, steamed breads, flat breads and pan breads. The SW subclass Club wheat, with very weak gluten strength, is typically exported as the subclass Western White, defined as a blend of more than 10% Club with SW, for cakes and delicate pastries.

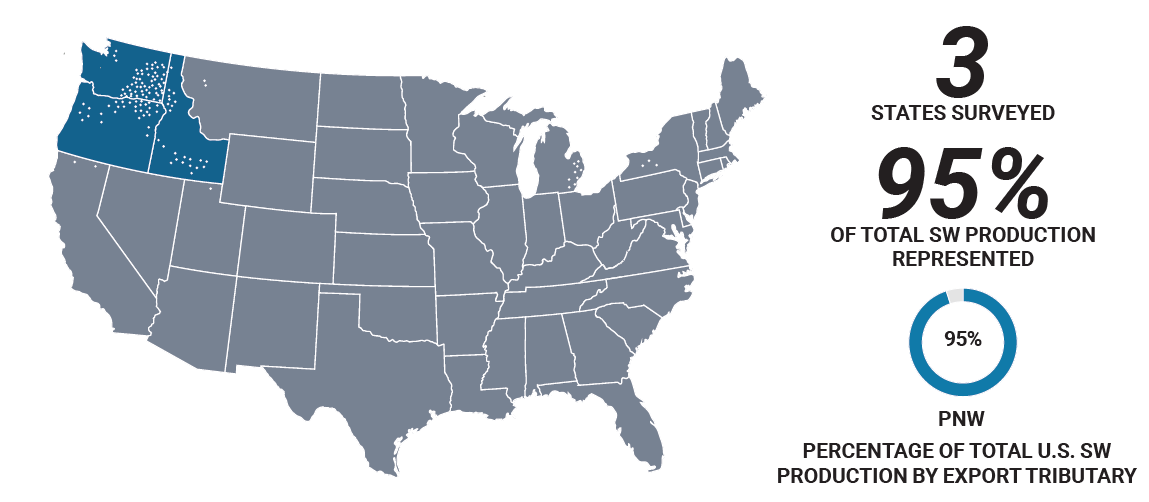
The following composite results come from analysis and testing of 457 SW (404) and Club (53) samples from elevators in Washington, Oregon and Idaho by the Wheat Marketing Center, Portland, Ore. The Federal Grain Inspection Service graded and tested wheat protein content.

U.S. Wheat Associates (USW) encourages buyers to review their quality specifications to ensure purchases meet their expectations.

Map and graphics showing the region and number of soft white samples analyzed for quality in 2022

The Season in Review

In fall 2021, continued drought delayed planting and emergence in the southern PNW. Snow and normal to below normal temperatures returned to improve conditions for the SW winter crop. Much needed moisture in April and May helped the winter and spring SW crops. Rains and cool temperatures during heading and grain filling were beneficial but delayed harvest by up to 2 weeks.

Estimated 2022 SW production is 6.9 million metric tons (MMT), a 46% increase from last year’s 4.8 MMT drought-stressed crop, and similar to the 5-year average of 6.5 MMT.

2022 Crop Highlights

  • The overall average grade of the SW and Club crop is U.S. No. 1.
  • Test weight SW averages range from 60.7 to 61.4 lb/bu (79.8 to 80.7 kg/hl) with an average of 61.0 lb/bu (80.2 kg/hl); Club averages 60.6 lb/bu (79.8 kg/hl).
  • Protein (12% mb) ranges from 8.1 to 11.5% for SW, with a weighted average of 9.5%. Club averages 10.1%.
  • Moisture ranges from 8.8 to 9.1% for SW with a weighted average of 8.9%. Club averages 7.8%.
  • Falling number average is 340 sec or higher for all SW composites and 356 sec for Club.

Flour and Dough Data

  • Wet gluten SW flour contents range from 13.1 to 31.1% depending on flour protein content. Club averages 14.5%.
  • Solvent retention capacity SW lactic acid values range 78 to 102%, indicating very weak to medium gluten strength. SW water SRC values range from 54 to 58%. Lactic acid and water SRC values for Club are 71% and 55%, respectively, and indicate very weak gluten with low water holding capacity.
  • Amylograph SW amylograph peak viscosities are between 576 and 607 BU for all composites. Club’s average amylograph peak viscosity is 580 BU. 
  • Farinograph SW water absorptions range from 50.0% to 52.8% with stability times of 1.1 to 3.2 min, showing desirably weak dough characteristics. The low farinograph water absorptions are typical for SW and in line with the water SRC values. Average Club farinograph water absorption is 50.0% with a stability of 1.1 min, showing very weak dough characteristics typical for Club.
  • Extensograph SW data at 45 min show maximum resistance in the range of 211 to 250 BU, extensibility of 13.5 to 17.1 cm and area from 47 to 51 cm2. Club extensograph 45 min maximum resistance, extensibility, and area are 115 BU, 15.3 cm, and 26 cm2, respectively.
  • Alveograph SW ranges include P values of 38 to 41 mm; L values from 61 to 90 mm; and W values of 71 to 91 (10-4 J). Average Club alveograph P, L and W values are 25 mm, 49 mm, and 33 (10-4 J), respectively.
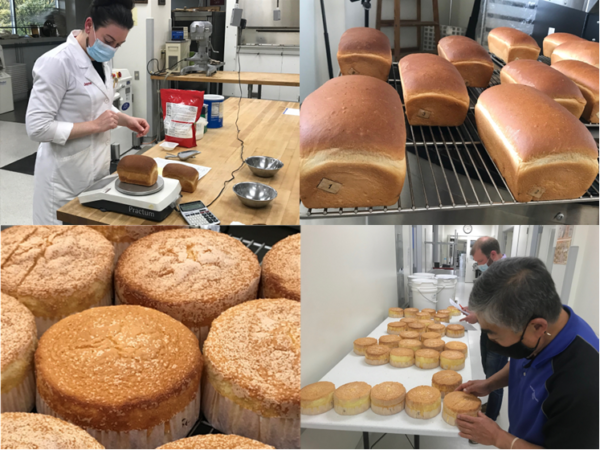
Composite photo of soft white wheat testing processes at the Wheat Marketing Center.

Soft White Testing. The Wheat Marketing Center (WMC) supports the annual effort to evaluate new crop quality. Samples are collected and sent to WMC for testing. In 2022, the WMC tested 404 soft white samples and 53 Club samples. Photo by the Wheat Marketing Center.

Bake Test Data

  • Sponge cake SW volumes range from 1101 to 1157 cc, depending on protein content, with a weighted average of 1137 cc. Total sponge cake scores are 54 to 60 with a weighted average of 59. Club sponge cake volume is 1150 cc with a total score of 56. Some scores exceeded the control (a commercial Japanese cake flour from the 2021 crop) this year due to softer textures.
  • Average Cookie soft white diameters are 8.2 to 8.3 cm with spread factors of 7.9 to 8.7. Club diameter and spread factor are 8.7 cm and 9.8, respectively.
  • Average pan bread bake absorptions are 55.3 to 58.0% with loaf volumes from 605 to 727 cc, depending on protein content. Total scores are 4.0 to 5.0.
  • Chinese southern-type steamed bread specific volumes are 2.2 to 2.6 mL/g with total scores of 64.6 to 70.9. Club specific volume is 2.9 mL/g with a total score of 69.0. Most scores were similar to the control this year due to better specific volume, smoother skin, and whiter external color.


October 11, 2022/by Steve Mercer
Share this
  • Share on Facebook
  • Share on Twitter
  • Share on WhatsApp
  • Share on LinkedIn
  • Share by Mail
https://www.uswheat.org/wp-content/uploads/2022-Soft-White-Header-Image.jpg 570 1104 Steve Mercer https://www.uswheat.org/wp-content/uploads/USW-Logo-Full-Color.png Steve Mercer2022-10-11 18:06:502022-10-12 14:59:202022 Soft White Wheat Crop Delivers Performance Customers Have Come to Expect

Wheatletter Sidebar

Quick Links

  • Newsroom
  • Wheat Letter Blog
  • News Releases
  • Videos

Wheat Letter Related Blogs

A no-till wheat field in Nebraska shows rows disappearing into a vanishing point in the background.
Market and Crop Analysis, Plant Breeding Innovation, Supply and Demand, Wheat Industry News, Wheat Production and Harvest

Wheat Industry News

News and Information from Around the Wheat Industry   Speaking of Wheat “In my view,…
MORE
March 30, 2023
https://www.uswheat.org/wp-content/uploads/Hard-Red-Winter-Nebraska-Pete-Miller-2021.jpg 1200 1600 Steve Mercer https://www.uswheat.org/wp-content/uploads/USW-Logo-Full-Color.png Steve Mercer2023-03-30 12:27:272023-03-30 12:27:27Wheat Industry News
Photo shows a tractor and seeding implement in the distance with new furrows where wheat was planted in the foreground to suggest prospective plantings.
Hard Red Spring, Hard Red Winter, Market and Crop Analysis, Soft Red Winter, Supply and Demand

Perspectives on March 31 Prospective Plantings and Stocks Reports

Each year, on March 31, those who grow, trade or import U.S. agricultural commodities look…
MORE
March 29, 2023
https://www.uswheat.org/wp-content/uploads/2021/07/19-HRW-OK-Peters-12-scaled.jpg 1707 2560 Steve Mercer https://www.uswheat.org/wp-content/uploads/USW-Logo-Full-Color.png Steve Mercer2023-03-29 10:36:252023-03-29 10:36:25Perspectives on March 31 Prospective Plantings and Stocks Reports

Stay up to date on wheat industry news!

SUBSCRIBE

Think Farm Export Programs Don’t Matter? Think Again.

GET THE REST OF THE STORY

Our Story

  • About USW
  • Dependable People. Reliable Wheat.
  • Board of Directors
  • Staff Directory
  • Office Locations

Market Information

  • Market Information
  • Price Reports
  • Price Charting Tools
  • Supply and Demand
  • Commercial Sales

Crop Quality

  • Crop Quality
  • Harvest Reports
  • Hard Red Winter
  • Hard Red Spring
  • Hard White
  • Soft White
  • Soft Red Winter
  • Durum

Working with Buyers

  • Working With Buyers
  • Customer Conferences
  • Wheat Classes
  • Wheat Glossary
  • Wheat Grade Factors
  • How to Buy
  • Ask the Expert
  • Resources

Who We Represent

  • Who We Represent
  • Board Meetings
  • State Wheat Commissions
  • Partners
  • Trade Activities

Policy

  • Policy
  • Trade Negotiations
  • Trade Barriers
  • Innovation and Sustainability
  • Food Security and Assistance
  • Public-Private Partnership

News

  • Newsroom
  • Wheat Letter Blog
  • News Releases
  • Videos

DTN Wheat Detail
DTN Corn Detail

2008-2013 U.S. Wheat Associates. All Rights Reserved
Privacy Policy | Non-Discrimination Statement

Scroll to top