By Mark Fowler, USW Vice President of Global Technical Services
While global wheat importers have many wheat types and origins to consider, U.S. wheat farmers offer the most diversity in the six distinct classes of wheat they produce. The United States is the only exporting country with grain standards that allow buyers to specify for both wheat class and protein content in their contracts.
However, to achieve the best value for the wheat purchased, the buyer must be well informed to understand the subtle yet critical differences in wheat contract specifications when comparing the quality and value of U.S. wheat to wheat from other origins.
Let us use protein content, perhaps the most basic quality characteristic in wheat, as an example.
How wheat quality characteristics are reported varies from country to country depending on “standards” set by regulations in each country. For protein content, the reporting standard is to compare protein based on moisture content, or the calculated moisture content equivalent.
However, within the major exporting countries there are three different reporting standards for protein content. U.S. wheat grade standards require the percent protein to be reported at a 12% moisture basis. Canadian standards report protein content at 13.5% moisture basis. All other exporting countries, such as Russia, report protein content at 0.0% moisture basis, also referred to as dry basis or d.b.
What that means for the buyer is the only way to get an accurate comparison of protein content in wheat supplies from different exporting countries is to compare them on a common moisture basis. Fortunately, that can be done with a relatively simple calculation – or by contacting your local U.S. Wheat Associates (USW) representative. Let us look first at how protein content is reported and calculated.
Example 1
A sample of wheat is evaluated, and the protein content is measured at 11.8% with the moisture content measured at 11.0%. If the reporting standard is 12% moisture basis (m.b.), the reported protein content must be calculated using the formula commonly referred to as the Dry Matter (DM) ratio, expressed here:
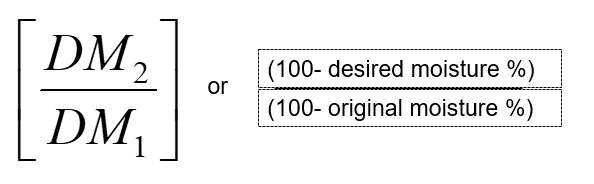
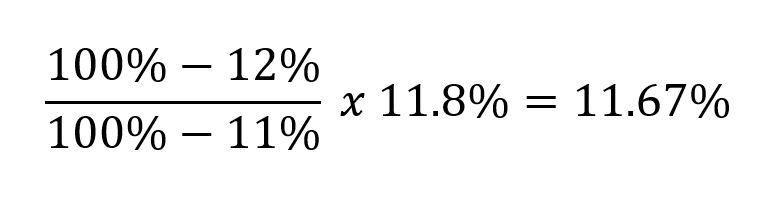
The full equation looks like this:
![]()
Using the variables in our example, we calculated that the wheat has 11.67% protein on a 12% m.b.
An easy way to determine if the math is done properly is comparing the direction of the final value. If the actual moisture content is lower than the reported moisture basis, the reported protein content will be lower than the actual measured protein content.
Next, let us use the same numbers to calculate the protein at a dry basis or 0% moisture.
Example 2
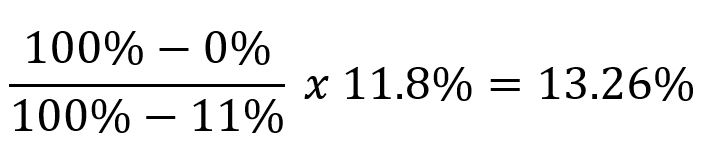
In this calculation, the actual moisture content (11.0%) is higher than the reported moisture basis (0.0%), so the reported protein content will be higher than the actual measured protein content.
The importance of this example is to understand that the actual protein content of the wheat does not change based on moisture, it is simply math and how the protein content is reported.
Reporting protein content and other wheat and flour attributes such as water absorption at a standard moisture basis is critical to compare expected flour performance of wheat from different origins.
Here is one last example to illustrate this difference. How does Russian grade #3 wheat at 12.5% protein reported at a dry basis, compare to U.S. hard red winter (HRW) wheat reported at 12% moisture basis?
To answer this question, we do the math.
Example 3
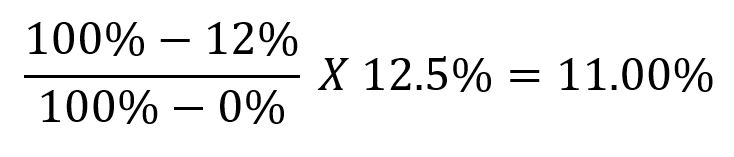
In this calculation, the reported moisture basis of Russian origin wheat is 0.0%, lower than the reported moisture basis of U.S. wheat at 12.0%. As a result, the standard reported protein content of Russian wheat is higher than the standard reported protein content of U.S. wheat, even though the actual protein content is the same for both at 11%.
This difference has been challenging buyers of wheat for years. That is just one reason why USW, the wheat farmers we represent, and the USDA’s Foreign Agricultural Service continue to make trade servicing and technical support a priority in its activities with overseas wheat buyers, millers and wheat food processors. Contact your regional USW office representative for more information or visit our website and leave a question in our “Ask The Expert” section.