• Facebook
  • Twitter
  • Vimeo
  • LinkedIn
  • SUBSCRIBE
  • MEMBER LOGIN
U.S. Wheat Associates
  • Our Story
    • About USW
    • Dependable People. Reliable Wheat.
    • Board of Directors
    • Staff Directory
    • Office Locations
  • Market Information
    • Market Information
    • Price Reports
    • Price Charting Tools
    • Supply and Demand
    • Commercial Sales
  • Crop Quality
    • Crop Quality
    • Harvest Reports
    • Hard Red Winter
    • Hard Red Spring
    • Hard White
    • Soft White
    • Soft Red Winter
    • Durum
  • Working With Buyers
    • Working With Buyers
    • Customer Conferences
    • Wheat Classes
    • Wheat Glossary
    • Wheat Grade Factors
    • How to Buy
    • Ask the Expert
    • Resources
  • Who We Represent
    • Who We Represent
    • Board Meetings
    • State Wheat Commissions
    • Partners
    • Trade Activities
  • Policy
    • Policy
    • Trade Negotiations
    • Trade Barriers
    • Innovation and Sustainability
    • Food Security and Assistance
    • Public–Private Partnership
  • News
    • Newsroom
    • Wheat Letter Blog
    • News Releases
    • Videos
  • Search
  • Menu Menu
You are here: Wheat Letter Blog 1
Market and Crop Analysis, Michael Anderson

Global Growth Forecast Likely to Support Higher Ocean Freight Rates

Illustrates export demand among U.S. wheat highlights in USDA's 2022 outlook.

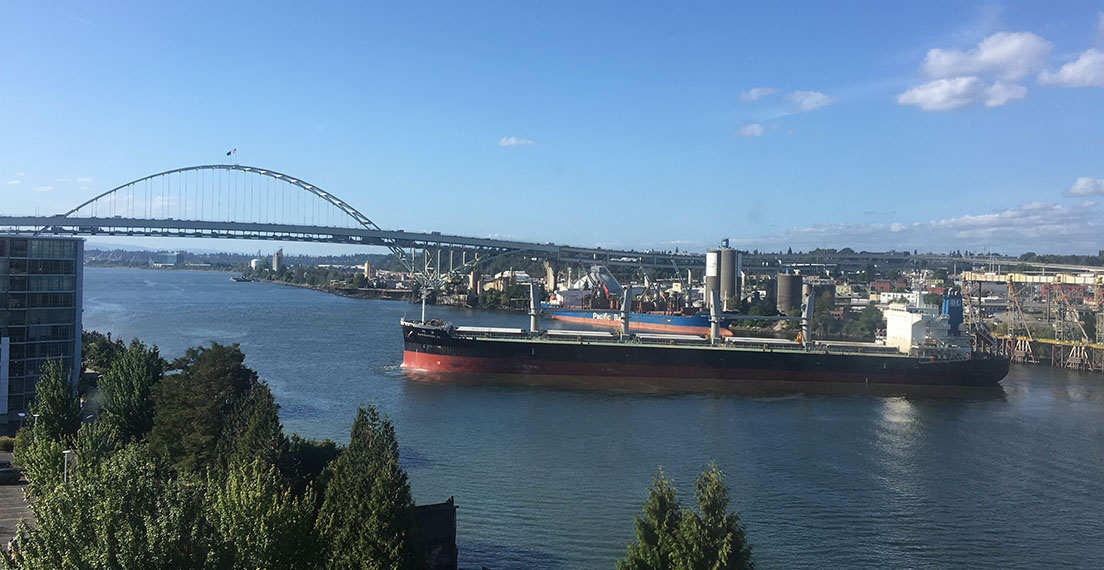
As the world’s economies begin picking up pace, the increasing demand for raw materials is pushing up ocean freight rates worldwide. A less volatile freight market is possible but there are factors that suggest rates will remain higher for some time.

Aristides Pittas, CEO of EuroDry, noted recently that dry bulk rates in January were the highest in a decade.

“The period from 2000-2010 was an extraordinarily good decade for dry bulk. In 2010-2020, it was an extraordinary bad decade,” he added. However, as another industry insider noted, “a lethargic decade for the [ocean freight] industry is behind us.” Rates for Panamax and Supramax vessels are double what they were at the same time last year, ahead of the global shutdowns brought on by the spread of COVID-19.

Why Freight Rates are Increasing

Dry bulk demand is overwhelmingly driven by China’s buying spree, which accounted for 48.5% of all dry bulk-ton miles in 2020, reported BIMCO. Unlike many countries last year, China’s economy grew by 2.3%. China’s growth translated directly to demand for grains, coal, iron ore, and other commodities delivered in dry bulk vessels.

Another cause is a diplomatic dispute between China and Australia that has left 70 bulkers carrying coal anchored off northern China. China is looking elsewhere for coal while Australia is finding other export markets, leading to longer shipping times and tying up the vessel supply on longer shipping routes.

News of President Biden’s plans to push a significant U.S. infrastructure plan could also affect demand. Martyn Wade, CEO of Grindrod Shipping, said shipping demand could be “through the roof” if deliveries of building materials like steel and cement tie up smaller ship sizes. In fact, Chinese steel exports in March were 40% above January and February, respectively. That is a four-year high according to Marine Strategies International (MSI).

Can the Market Stabilize?

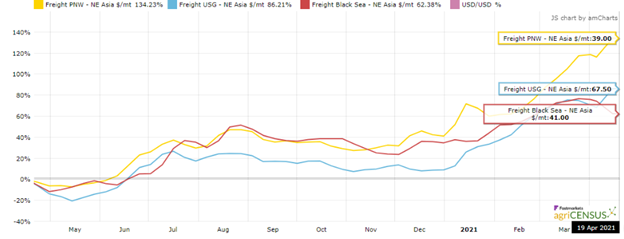
Rates for Panamax and Supramax vessels have steadily increased in the first quarter of 2021 and remain very strong. Rates have been steady in April. Today’s Panamax rate is $22,949, or about $600 more than on April 1. Forward freight agreement (FFA) derivatives indicate continued strength. The Baltic Index is up 39% in April.

Proving ocean freight rates are rising.

Ocean Freight Rates Comparison, April 2020 to April 2021.  This chart gives a snapshot of freight price trends for routes from the U.S. Pacific Northwest to Northeast Asia, the U.S. Gulf to Northeast Asia, and the Black Sea to Northeast Asia. The chart shows the trend of shipping rates over the course of one year (April 2020 to 2021). The Y-axis represents the percent change over the course of a year with 0% representing the benchmark. Source: “AgriCensus.”

New ship orders can increase the worldwide supply of dry bulk carriers, but new orders are not keeping pace with demand. New build orders for container ships in comparison are triple the dry bulk ratio, reported “American Shipper.”

In addition, COVID-19 protocols in many countries have slowed vessel discharge time. Australia, for example, requires ships to hold at sea for 14 days before calling at ports. This protocol has had a major impact on the Capesize route between China and Australia, said Nick Ristic, lead dry cargo analyst at Braemar ACM Shipbroking.

Strength in Freight Market to Persist

It looks like the market is at a turning point for the shipping industry. As the year progresses, rates remain strong. Global economic growth and momentum in the equities markets point to an optimistic outlook for the year. Limits on vessel supply cannot be met quickly.

For those contracting for shipping, these factors are likely to sustain the higher dry bulk carrier rates.

For additional information on freight and other trade service needs, please contact your local USW Office.

By Michael Anderson, USW Market Analyst

April 28, 2021/by actualize
Share this
  • Share on Facebook
  • Share on Twitter
  • Share on WhatsApp
  • Share on LinkedIn
  • Share by Mail
https://www.uswheat.org/wp-content/uploads/2021/07/Port-of-Portland-Header-Photo.jpg 570 1104 actualize https://www.uswheat.org/wp-content/uploads/USW-Logo-Full-Color.png actualize2021-04-28 19:32:322022-03-29 16:14:47Global Growth Forecast Likely to Support Higher Ocean Freight Rates

Wheatletter Sidebar

Quick Links

  • Newsroom
  • Wheat Letter Blog
  • News Releases
  • Videos

Wheat Letter Related Blogs

Compound image shows hard white wheat in the field, harvested, and in Chinese steam buns.
Hard White, Mark Fowler, Technical Service Activities

Defining U.S. Wheat’s Comparative (Competitive) Advantage: Hard White

In the increasingly competitive global wheat market, it is important to review the advantages…
MORE
June 29, 2022
https://www.uswheat.org/wp-content/uploads/2021/07/hard-white-header.png 570 1104 actualize https://www.uswheat.org/wp-content/uploads/USW-Logo-Full-Color.png actualize2022-06-29 13:00:202022-06-29 12:52:15Defining U.S. Wheat’s Comparative (Competitive) Advantage: Hard White
Wheat Industry News

Wheat Industry News

Recent news and highlights from around the U.S. wheat industry. Speaking of Wheat “We agree…
MORE
June 23, 2022
https://www.uswheat.org/wp-content/uploads/2021/07/PHOTOH1-e1529071940819-1-scaled.jpg 1696 2560 Amanda Spoo https://www.uswheat.org/wp-content/uploads/USW-Logo-Full-Color.png Amanda Spoo2022-06-23 14:42:132022-06-23 14:46:57Wheat Industry News

Stay up to date on wheat industry news!

SUBSCRIBE

Think Farm Export Programs Don’t Matter? Think Again.

GET THE REST OF THE STORY

Our Story

  • About USW
  • Dependable People. Reliable Wheat.
  • Board of Directors
  • Staff Directory
  • Office Locations

Market Information

  • Market Information
  • Price Reports
  • Price Charting Tools
  • Supply and Demand
  • Commercial Sales

Crop Quality

  • Crop Quality
  • Harvest Reports
  • Hard Red Winter
  • Hard Red Spring
  • Hard White
  • Soft White
  • Soft Red Winter
  • Durum

Working with Buyers

  • Working With Buyers
  • Customer Conferences
  • Wheat Classes
  • Wheat Glossary
  • Wheat Grade Factors
  • How to Buy
  • Ask the Expert
  • Resources

Who We Represent

  • Who We Represent
  • Board Meetings
  • State Wheat Commissions
  • Partners
  • Trade Activities

Policy

  • Policy
  • Trade Negotiations
  • Trade Barriers
  • Innovation and Sustainability
  • Food Security and Assistance
  • Public-Private Partnership

News

  • Newsroom
  • Wheat Letter Blog
  • News Releases
  • Videos

DTN Wheat Detail
DTN Corn Detail

2008-2013 U.S. Wheat Associates. All Rights Reserved
Privacy Policy | Non-Discrimination Statement

Scroll to top