Headlines Keep the Global Wheat Market Bouncing
Grain buyers have the unenviable task of sorting through today’s news and determining what it means for tomorrow’s prices. Experienced buyers have plenty of tools to help with their decisions, but the volatility experienced in 2022 may be embedded for the near future. Talk of a global recession may soften commodity prices initially, but just […]
Dry Bulk Freight Rates Riding Rough Seas

This was supposed to be the year dry bulk freight vessel owners turned a profit, Jay O’Neil, a commodities consultant and author of a weekly transportation report recently commented. And U.S. Wheat Associates (USW) shared similar thoughts early in 2021. Instead, S&P Global Market Intelligence noted recently that freight rates for dry bulkers have fallen […]
Commercial Sales Accuracy Benefits Grain Exporters and Buyers

Editor’s Note: On Aug. 31, USDA/FAS Administrator Daniel Whitley announced the following statement: “As a result of unanticipated difficulties with the launch of the new Export Sales Reporting and Maintenance System, USDA’s Foreign Agricultural Service will temporarily revert to the legacy system while we work to fully resolve the issues with the new system. FAS […]
What is the Outlook for World Durum Production?
Global durum production is expected to rebound in 2022/23, but stocks are likely to remain tight this season. Total durum production in 2022/23 is expected to increase 10% to 33.9 MMT, led by increases in the United States, Canada, and Mexico. While durum production in North America looks good, production across Europe and North Africa […]
Harvest and Much Improved Conditions Pressure U.S. Soft White Market
Volatility remains the key word when looking at wheat prices, and the soft white (SW) market is no exception. From their rapid increase following the severe drought in 2020/21 and the Russian invasion of Ukraine in March 2022, U.S. wheat futures have declined recently and were down more than 4% on July 5, hitting a […]
Export Bans Contrast with U.S. Wheat’s Commitment to an Open, Transparent Market
Consumers and suppliers both appreciate uniformity, the ability to purchase a reliable product that is available when needed. Customers of U.S. wheat know that dependable people grow and supply reliable wheat, which marks the difference between the U.S. wheat market and some competing suppliers. Freedom to Trade Free trade has been upheld in U.S. commerce […]
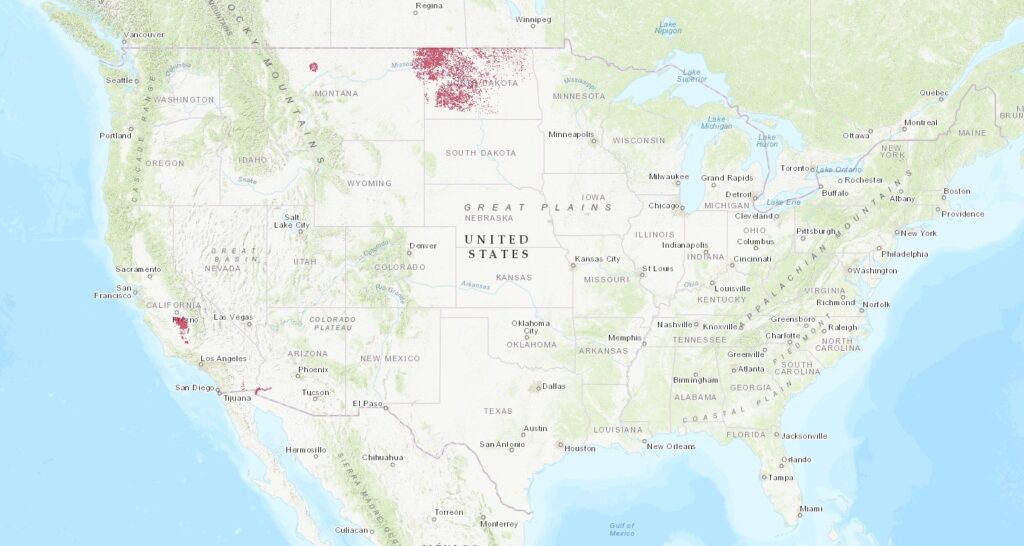
U.S. Spring Wheat Planting Progress Hindered by Too Much Rain
The U.S. Department of Agriculture (USDA) as of Sunday, June 5, reported spring wheat planting at 82% complete, 15-points below the 5-year average of 97% and below analysts’ expectations of 86%. Spring wheat planting was up just 9-points from the week before, dragged down by slow progress in North Dakota and Minnesota. Idaho, Montana, South […]
Wheat Industry Helps Build Awareness of Rail Shipping Challenges

In recent months, U.S. grain rail shipping has faced a host of service-related challenges ranging from delayed cars to metered traffic and dramatic spot freight market increases. Those service problems reached such elevated levels that the U.S. rail regulatory body, the Surface Transportation Board (STB), stepped in. The STB will now require the four largest […]
Soft White Wheat Crop Looks Better This Year
Analysis of the wheat market since February has been underscored by volatility, and no less so for the U.S. soft white (SW) wheat market. The sudden exit of Ukraine from the export market and the uncertainty of Russia’s wheat exports are recent factors in market volatility. Dry weather is another important consideration for winter wheat […]
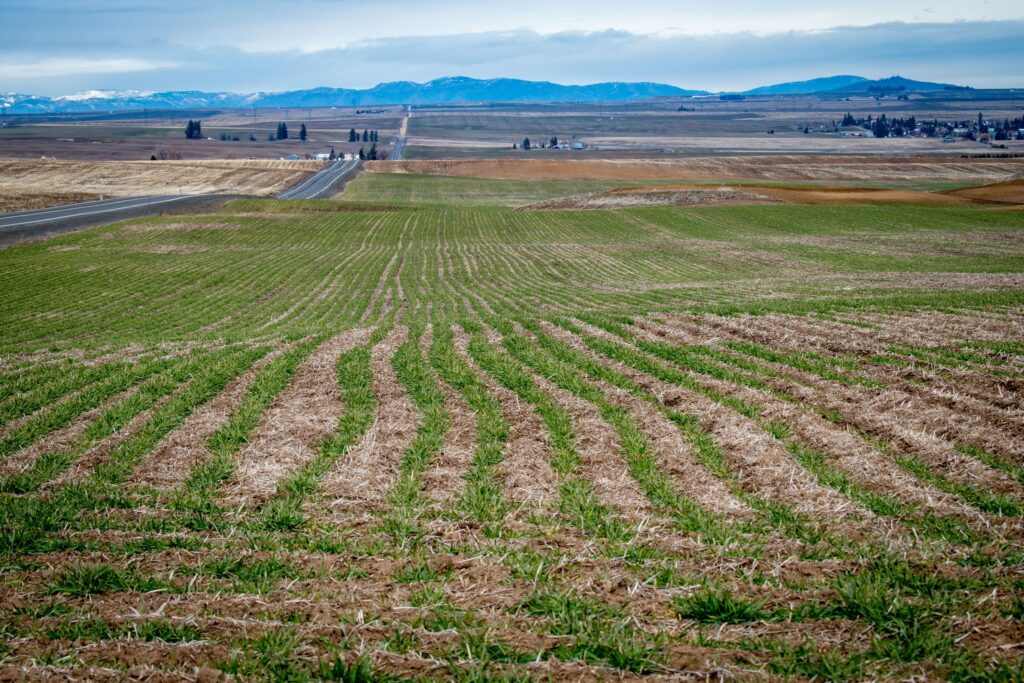
U.S. Hard Red Winter Wheat in Drought Adds Supply Concerns
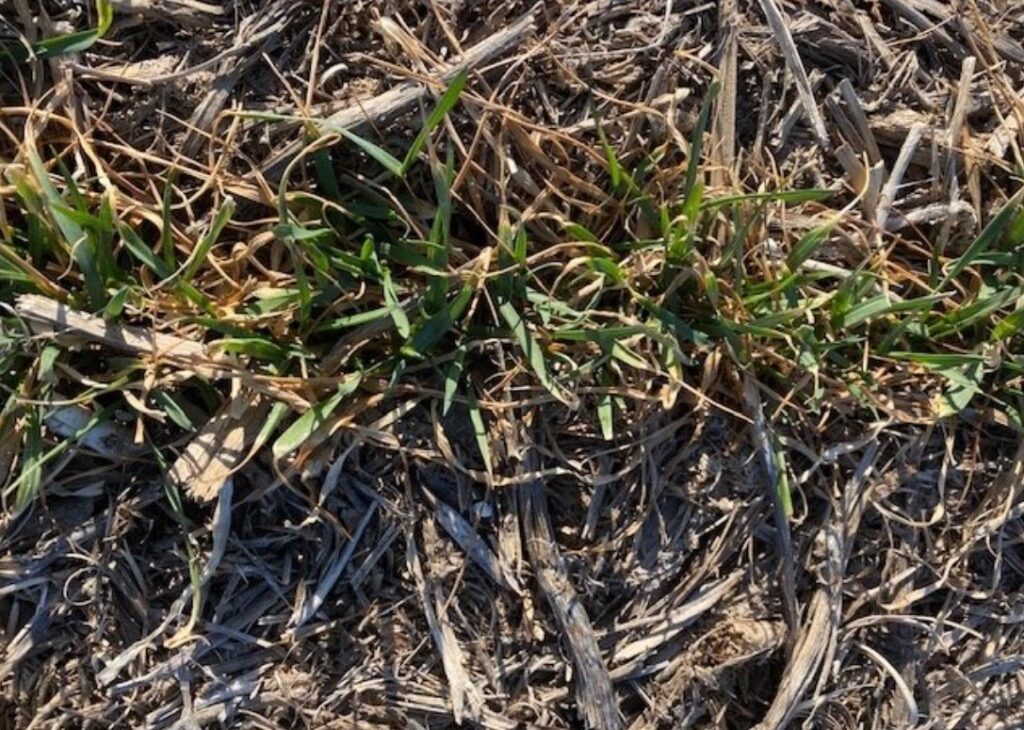
While the Russia-Ukraine conflict remains the biggest driver of wheat futures prices, U.S. winter wheat in drought conditions across the Plains is becoming an increasingly bullish factor. This latest concern is likely to overshadow USDA’s recent estimate for a slight increase in winter wheat acres with potentially serious implications for supplies heading into summer. On […]