thumbnail

On Jan. 30, 2024, Casey Chumrau, CEO of the Washington Grain Commission, offered compelling testimony supporting the crucial infrastructure of dams and locks on the Columbia Snake River System (CSRS) at a U.S. House Energy, Climate, and Grid Security Subcommittee hearing. U.S. Wheat Associates (USW) and the National Association of Wheat Growers (NAWG) sent separate letters with their observations of the essential nature of the CSRS for U.S. wheat export competitiveness.

Following are excerpts from Chumrau’s testimony.

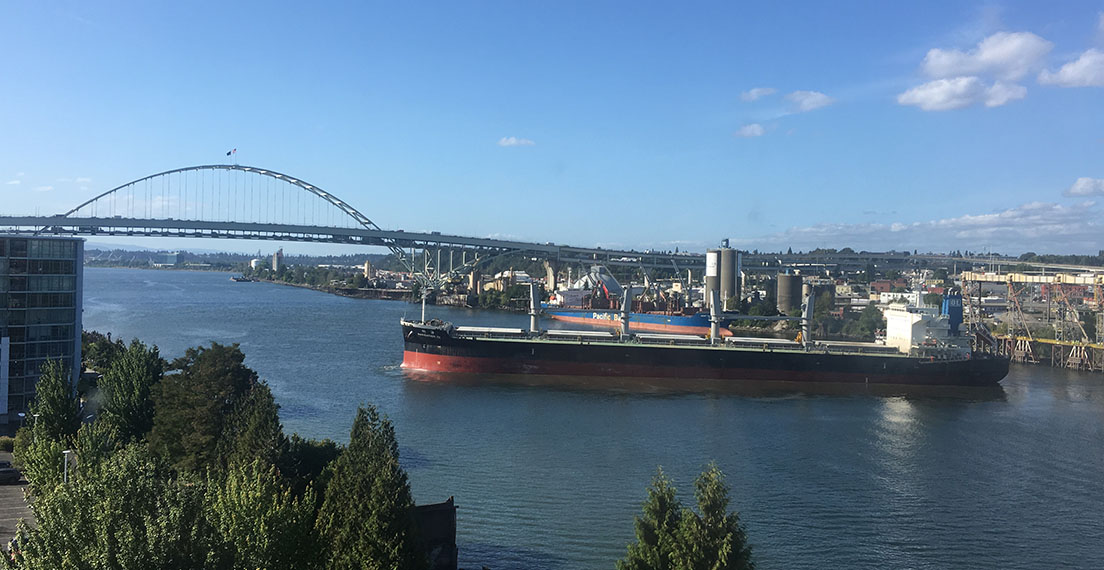
Grain growers in the Pacific Northwest (PNW) rely on the Columbia Snake River System, and the Lower Snake River Dams (LSRD) in particular, for their livelihoods. More than 55 percent of all U.S. wheat exports move through the PNW by barge or rail. Specifically, 10 percent of wheat that is exported from the United States passes through the four locks and dams along the Lower Snake River. This is especially important for our state because Washington is the fourth largest wheat exporter in the nation, exporting 90% of the wheat produced in the state. Across the agriculture industry, the Columbia Snake River System is the second largest gateway for soybean and corn exports coming from as far as the Midwest. The river system also serves as an important channel to bring crop inputs, like potash, to farmers in the region who need fertilizer to produce the safe and affordable food supply that is found on every American’s table.

Casey Chumrau, CEO, Washington Grain Commission, giving testimony on Columbia Snake River System Jan. 30, 2024, to a U.S. House subcommittee hearing.

Casey Chumrau, CEO, Washington Grain Commission, giving testimony on Columbia Snake River System Jan. 30, 2024, to a U.S. House Energy, Climate, and Grid Security Subcommittee hearing.

Economic Impact

Washington’s agriculture industry, and its ability to produce and export products globally, are critical to the state and region’s economy. The total value of wheat exported through the PNW is nearly $4 billion per year.

For Washington, the state is among the top 20 states for agricultural exports in the nation, with over $8 billion in Washington-grown or processed food and agriculture exports in 2022. A significant volume of food and agriculture products from other states including soybeans, wheat, and corn are exported through Washington state ports each year. Once these pass-through exports are combined with Washington-grown or processed exports, the total value reaches over $23 billion.

The Washington wheat industry alone contributed over $3.1 billion to the state’s economy in 2022, with a heightened impact in rural areas. In the same year, total direct employment associated with Washington wheat production amounted to 3,672 jobs in 2022. Indirect and induced employment also grew and supported another 11,676 jobs.

The impact that Washington farmers have on their local and regional economy is similar in communities across the country. In addition to direct sales of farm goods and commodities, farmers contribute to the economy and support other rural businesses through purchases of farm business inputs – everything from seed and fertilizer to business services. Additionally, the personal purchases of both farmers and their employees help to stimulate local economies and keep small businesses ruining.

Locks and dams on the Lower Snake River and the Columbia River provide essential infrastructure for moving U.S.-grown wheat to high-value markets around the world. We cannot overstate the positive value they create for U.S. farms, [the] economy of the Pacific Northwest and far beyond. – From USW letter to House subcommittee hearing on the Columbia Snake River System

Supply Chain and Transportation

Over the last seventy years, growers and their federal government partners at the U.S. Department of Agriculture have invested billions of dollars and countless hours to build strong relationships with our trading partners. The U.S. wheat industry differentiates itself by providing high-quality wheat and reliable delivery. The United States is a reliable trading partner in large part because of our world class, multi-modal infrastructure, which allow us to safely and efficiently ship products around the world. Any disruption to that system would hurt our ability to consistently provide abundant, high-value food products and remain competitive with other agricultural exporters in the world and weaken the competitiveness of U.S. producers in global markets.

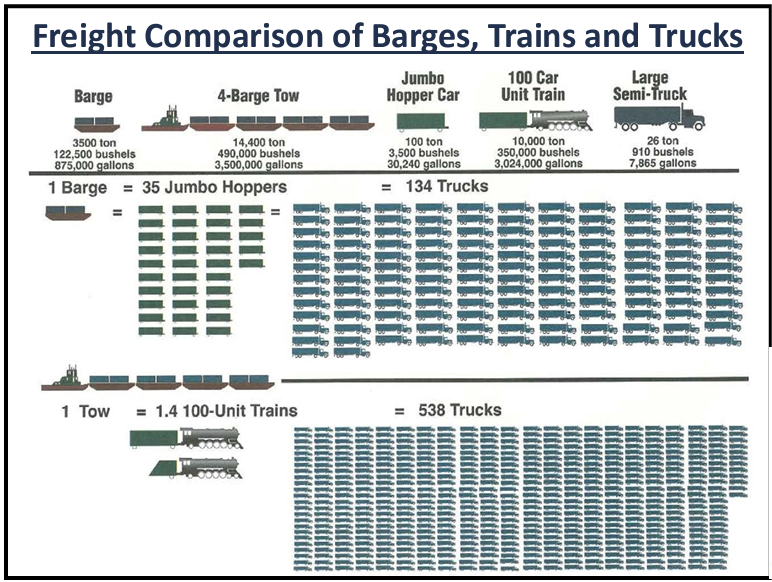
Grain growers in PNW states are at the tip of the spear of those who would feel the disruption of having to divert export goods to trucking and rail because there is insufficient alternative transportation infrastructure to replace the barge shipments of grain along the Columbia Snake River System to export markets. For example, one loaded covered hopper barge carries over 58,000 bushels of wheat. It would take 113,187 semi-trailers each year carrying 910 bushels of wheat to replace the 103 million bushels shipped on the Snake River via barge annually. That is 310 more trucks each day, making round trips to the Tri-Cities, 365 days per year. To that end, barging is the most fuel-efficient mode of transportation when compared to railroads and trucking. Each barge that must be replaced by a truck means more pollution, more traffic, increased costs and increased wear and tear on our roads – and that’s if we could even hire the drivers needed to drive these trucks in the increasingly tight labor market for drivers.

Path Forward

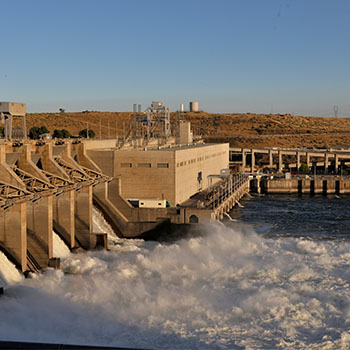
We strongly believe that dams and salmon can and do co-exist. With a myriad of challenges facing the salmon population, we are committed to building upon current investments and technological advancements. Currently, the Lower Snake River Dams have world-class fish passage and juvenile survival rates upwards of 95 percent. We believe any work moving forward should build off the fish passages, instead of eliminating them. We also support investments made at the federal and state level for culvert removal, fish habitat restoration, toxin reduction, and predator abatement.

Conclusion

The opportunities to ensure salmon populations continue to grow do not have to come at the cost of destroying the integrity of the Columbia Snake River System and the livelihood of farmers. The importance of the river system for the agriculture industry, and particularly for grain growers across Washington, cannot be overstated. I look forward to discussing the importance of the four Lower Snake River Dams with you today. Thank you.

To read more about this issue, see these previous “Wheat Letter” posts:

Exports Depend on Snake River Dams

USW Expresses Support for Maintaining Lower Snake River Dams

Wheat Leaders: Protect Lower Snake River Dams

thumbnail

In a series of articles on U.S. supply chain transportation, we have explored the importance of barging and rail on U.S. wheat exports and how they contribute to the reliability of the U.S. marketing system. Barging and rail account for 89% of all U.S. wheat export shipments.

After traveling through the inland logistics system, on average, 90% of all U.S. wheat is exported via maritime transportation routes. Ocean freight is pivotal in wheat exports as the primary mode of transporting U.S. wheat to importers worldwide. With the significance of bulk ocean freight in mind, today’s article will evaluate recent trends in maritime transportation as rates begin to rise after an extended period of stagnant prices.

This chart tracking ocean freight rates the past year show rate rising after a long period of decline.

Ocean freight rate indices are tracking higher after a stretch of stagnation. Until recently, freight markets were weighed by low demand and little price direction. Source: U.S. Wheat Associates Price Report.

Fundamental Shifts

Throughout the fall of 2022, ocean rates steadily decreased, touching COVID-era lows in February 2023, driven down by low demand, an increasing supply of vessels, and normalized oil prices. After a brief uptick in March and April, freight rates and indices remained surprisingly stable until recently.

Oil prices are back on the rise after a steady decline throughout much of 2022 and the initial months of 2023. In April, major oil producers in OPEC and allied countries (OPEC+) decided to decrease oil production by 3.6 million barrels per day (3.7% of global demand). The OPEC+ alliance cited weak demand and “interferences” in the market (Western sanctions on Russian oil production) as the primary reasons for the shift. With rising oil prices, vessel owners are paying more for diesel fuel and pass on the extra cost to their bulk commodity customers via higher rates.

This chart of Brent crude oil prices indicates the market price is rising.

Oil prices have reversed their recent downward trend and are back up around $90/barrel for the first time since Russia invaded Ukraine in early 2022. Source: Trading Economics.

En Route to China

Moreover, China’s increasing freight demand is adding cost. In our last freight update, we highlighted China as one of the primary ocean freight rate drivers as the world’s leading importer of dry bulk commodities, specifically coal and iron ore. In 2022, China’s GDP growth slowed to 2.8% compared to 8.1% in 2021; as a result, manufacturing activity and demand for iron ore decreased, helping freight rates come down.

Since then, there has been a resurgence of Chinese economic activity and the possible infusion  of 1 trillion yuan ($137 billion) in infrastructure projects and lower interest rates to boost the economy. Likewise, Chinese demand for agricultural commodities is on the rise. Recently, for example, China purchased more than 200,000 metric tons of U.S. soft red winter (SRW), the largest single purchase since 2019.

This chart shows The Chinese Import Dry Bulk Freight Index is back on the rise after stagnation throughout 2023.

The Chinese Import Dry Bulk Freight Index is back on the rise after stagnation throughout 2023, driven by the combined demand for iron ore and agricultural products, specifically soybeans. Source: Shanghai Shipping Exchange.

Issues To Watch

Despite recent positive signs for the Chinese economy, major property developer China Evergrande Group still faces repercussions of Chapter 15 bankruptcy, casting a shadow of doubt over Chinese economic recovery. At the same time, economists are unsure if recent gains will hold or if a stimulus would be sufficient to support the economy long term. Economic recovery in China, or lack thereof, will continue to drive dry bulk ocean freight trends in the near future.

Another ocean freight concern is the effect of low water levels on the Panama Canal. The Panama Canal serves 5% of world trade, and severe drought continues to impact trade flows. Only up to 32 ships are currently authorized to transit daily, down from 36 ships in normal conditions. Maximum vessel draft has decreased to 44 feet, down from 50 feet. Water levels at Gatun Lake, the primary water source for the canal, were at 24.2 meters (79.7 feet) in mid-September, down from 26.6 meters. It will be important to observe how the emerging El Niño weather pattern may affect water levels and, thus, transportation through the canal.

Integral Part of the System

As the last leg of the U.S. supply chain, ocean freight plays a significant role in transporting U.S. wheat to destinations worldwide. Monitoring trends in ocean freight is critical to understanding the cost and potential price risks for importers. Changes in ocean freight rates can greatly impact the landed cost of U.S. wheat for importers, so it is critical to distinguish what factors influence the price of U.S. wheat at every point in the supply chain, from inland logistics to the ocean vessel.

This article is part of a series outlining the transportation logistics for U.S. wheat, highlighting barge freight, the railroads, infrastructure investments, and maritime transportation trends.

By USW Market Analyst Tyllor Ledford

thumbnail

As the COVID-19 pandemic fades into a not-so-distant memory, one can remember a time when “Supply Chain Disruptions” made every headline and container backlog in the Port of Long Beach required direct intervention from the U.S. government. Since the highs hit in the fall of 2021 freight prices have dropped to lows not seen since June 2020. Coupled with a recent break in wheat prices, decreased ocean freight costs have helped turn the tides back in the importers’ favor.

As Jay O’Neil of HJ O’Neil Commodity Consulting says, “the current outlook is not bullish, but vessel owners believe things must go up, as they don’t believe they can go lower…”

The Baltic Index price chart of dry bulk freight rates shows the impact on rates from the Russian invasion of Ukraine.

On February 6, the Baltic Dry Index hit 621, a level not seen since June 2020. The index has fallen 88% from its peak in October 2021. Source: Tradingview.com.

The China Effect

In recent years, dry bulk freight and Chinese economic growth have become interconnected. Dry bulk vessel sizes known as Handy (25,000 to 39,000 deadweight tons (dwt)), Handymax (40,000 to 49,999 dwt), and Panamax (60,000 – 78,999 dwt) that carry wheat and other grain cargos are also used to ship iron ore. And, according to S&P Global Commodity Insights, China accounts for almost 60% of dry bulk demand to help supply the country with over 1.1 billion MT of iron ore.

Until recently, however, China’s Zero Covid policy severely impacted economic growth. In 2022 China’s GDP growth slowed to 2.8% from 8.1% in 2021, thus diminishing iron ore demand by 2% as steelmaking slowed. With decreased Chinese vessel demand, freight rates have plummeted. As the seasonal lulls in economic activity around the Chinese Lunar New Year holiday dissipate, China remains a wildcard in global shipping as the country relaxes its COVID-19 restrictions, potentially opening the door for accelerating growth and industrial activity.

Congestion

According to Lloyd’s List, in the fall of 2021, 5.7% of the world’s bulk fleet was anchored off Chinese ports due to strict quarantine requirements. As the global economy started its recovery from the pandemic, immense port congestion tied up hundreds of vessels, sending dry bulk freight soaring. Easing congestion in Chinese ports is expanding dry bulk capacity and will continue to play an essential role in freight markets in 2023, especially as China lifts more COVID-related restrictions.

Map showing massive vessel congestion around Chinese ports in 2021 that affected freight rates.

Port congestion in China supported the bulk carrier rates in 2021, with upwards of 600 vessels queued to load or discharge cargo. Source: Lloyds List Maritime Intelligence.

Vessel Supply and Demand

Over the last 13 years, the dry bulk vessel fleet has increased steadily, marking an average yearly increase of 4.8%, total growth of 53.8% since 2010. In 2022 dry bulk fleet growth slowed to 2.8% and is forecast to slow to 2.3% in 2023 (S&P Global, HJ O’Neil Commodity Consulting). Meanwhile, dry bulk demand declined by 1.9% in 2022 due to low iron ore and reduced grain shipments. If vessel supply continues to outpace demand, the downward pressure will continue to impact ocean freight.

Bar chart showing a 53% increase in the global dry bulk vessel fleet from 2007 to 2020 to show the effect on freight rates.

The bulk vessel fleet size had grown by 53.8% on a steady pace over the last decade. Source: Drewry Shipping Consultants Ltd.

Oil Prices

After Russia’s invasion of Ukraine in February 2022, oil prices skyrocketed as sanctions were placed against Russia, the world’s second largest oil produce. As oil prices increase, the fuel input cost for dry bulk vessels also increase, supporting freight prices. In the year since the invasion, oil prices have normalized, taking pressure off the market.

Will This Pattern Hold?

As the freight market continues in freefall, importers and exporters must ask if this pattern is sustainable. According to Breakwave Advisors “one of the slowest weeks of the year for Chinese activity is now behind us” as we move into February and past the Lunar New Year festivities. Vessel supply and demand, port congestion, oil prices, and the on-going supply chain disruptions will continue to impact the market as economies normalize post-COVID; however, China remains in the driver’s seat of global freight. The resilience of the Chinese economy will be put to the test as economic activity increases post COVID, but for now, the world is waiting and all eyes are on China.

By Tyllor Ledford, USW Market Analyst

thumbnail

This was supposed to be the year dry bulk freight vessel owners turned a profit, Jay O’Neil, a commodities consultant and author of a weekly transportation report recently commented. And U.S. Wheat Associates (USW) shared similar thoughts early in 2021. Instead, S&P Global Market Intelligence noted recently that freight rates for dry bulkers have fallen over the past three months after rates peaked earlier than expected in the second quarter of 2022.

As rates recently climbed, however, O’Neil said the freight market may have finally found its bottom.

Bearish Factors

Since early 2020, shipping has faced uncertainties: labor shortages, various COVID restrictions made worse by each country applying different restrictions, port congestion, and supply chain breakdowns have all competed to make shipping tough. The challenges to shipping logistics have abated. As a result, the number of available vessels floating in the dry bulk freight market has increased.

As China Goes…

China plays such a dominating role in the dry bulk shipping market that analyzing economic activity there can predict the dry bulk fleet’s prospects. China’s economic growth slowed under the government’s zero-COVID policy. The global iron ore trade, one aspect that drives the dry bulk fleet, was down 6% last month compared to a year ago. An analyst with S&P Global Market Intelligence said “slower than expected economic growth” could exist through the second half of 2023. O’Neil covered bearish factors for the dry bulk freight market for USW’s 2021 Crop Quality report.

Russian Coal

Putin’s war in Ukraine has also rerouted some cargo flows and driven up demand for coal, another commodity that absorbs dry bulk shipping capacity. Sanctions on Russian gas supplies have quickly reversed European Union plans to close many coal-fired plants. While the E.U. looks to the United States for coal imports, India and China are taking advantage of cheap Russian coal and changing demand for different bulker size categories.

Another key component that helped bring down dry bulk shipping rates is the easing of port congestion.

“Inefficiencies of last year do not apply to the current market anymore and the supply-demand equation is more straightforward,” said one ship owner. AXS said a primary driver behind the lower rates is the drop in ton-miles.

Overall, Breakwave Advisors, a shipping publication, agreed saying, “Following a period of high uncertainty and significant disruptions across the commodity spectrum, the gradual normalization of trade is shifting the market’s attention back to the traditional demand and supply dynamics that have shaped dry bulk profitability for decades.”

This was all good news for dry bulk freight customers, including the world’s wheat buyers.

Line chart shows the Baltic Dry Index change from April 2022 to September 2022

Stormy Seas for Dry Bulk Freight. After peaking in the second quarter of 2022, the Baltic Exchange Dry Index retreated before bouncing up in September. Some suggest the market found a bottom, yet bearish economic factors continue.

Turning Tides

Yet signs of rate recovery are evident. The Baltic Index on September 9 notched its largest weekly increase in 8 years, according to Reuters data. The index was up 12% to 1,213. On September 12, the Baltic Index marked its fourth consecutive session of gain. AgriCensus, in a story published on August 31, noted that the purchasing managers’ index (PMI) rose to 49.4 in August, up 0.4 compared to July. But still, the index remained below the 50-point mark which separates contraction from growth.

Despite the current strengthening in the shipping index, generally bearish factors affecting dry bulk freight rates such as China’s economic situation remain. Those that follow the market closely say that rebound may simply be a market correction. For now, it seems like vessel owners may have to wait longer before turning that profit that many predicted not long ago.

By Michael Anderson, USW Market Analyst