• Facebook
  • Twitter
  • Vimeo
  • LinkedIn
  • SUBSCRIBE
  • MEMBER LOGIN
U.S. Wheat Associates
  • Our Story
    • About USW
    • Dependable People. Reliable Wheat.
    • Board of Directors
    • Staff Directory
    • Office Locations
  • Market Information
    • Market Information
    • Price Reports
    • Price Charting Tools
    • Supply and Demand
    • Commercial Sales
  • Crop Quality
    • Crop Quality
    • Harvest Reports
    • Hard Red Winter
    • Hard Red Spring
    • Hard White
    • Soft White
    • Soft Red Winter
    • Durum
  • Working With Buyers
    • Working With Buyers
    • Customer Conferences
    • Wheat Classes
    • Wheat Glossary
    • Wheat Grade Factors
    • How to Buy
    • Ask the Expert
    • Resources
  • Who We Represent
    • Who We Represent
    • Board Meetings
    • State Wheat Commissions
    • Partners
    • Trade Activities
  • Policy
    • Policy
    • Trade Negotiations
    • Trade Barriers
    • Innovation and Sustainability
    • Food Security and Assistance
    • Public–Private Partnership
  • News
    • Newsroom
    • Wheat Letter Blog
    • News Releases
    • Videos
  • Search
  • Menu Menu
You are here: Wheat Letter Blog 1
Dry Bulk Freight

Ocean Freight Rates Revert to Pandemic Lows

Vessel at port loading wheat to illustrate how dry bulk freight rates have declined.

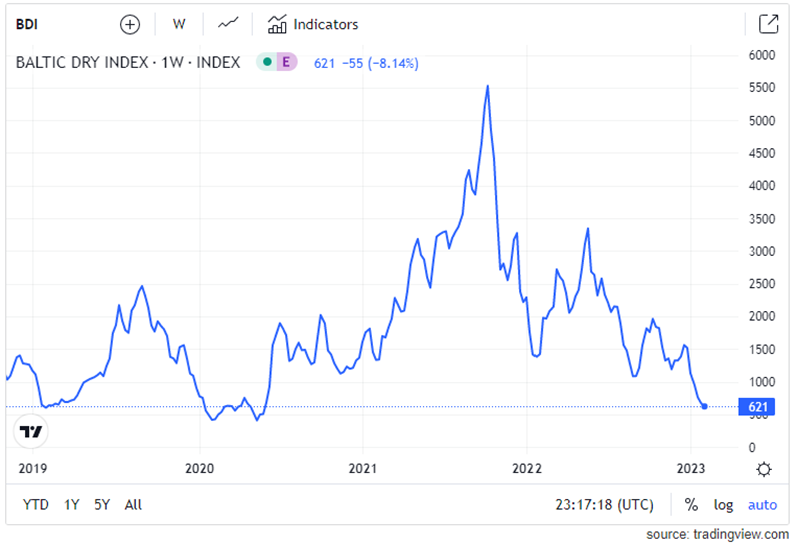
As the COVID-19 pandemic fades into a not-so-distant memory, one can remember a time when “Supply Chain Disruptions” made every headline and container backlog in the Port of Long Beach required direct intervention from the U.S. government. Since the highs hit in the fall of 2021 freight prices have dropped to lows not seen since June 2020. Coupled with a recent break in wheat prices, decreased ocean freight costs have helped turn the tides back in the importers’ favor.

As Jay O’Neil of HJ O’Neil Commodity Consulting says, “the current outlook is not bullish, but vessel owners believe things must go up, as they don’t believe they can go lower…”

The Baltic Index price chart of dry bulk freight rates shows the impact on rates from the Russian invasion of Ukraine.

On February 6, the Baltic Dry Index hit 621, a level not seen since June 2020. The index has fallen 88% from its peak in October 2021. Source: Tradingview.com.

The China Effect

In recent years, dry bulk freight and Chinese economic growth have become interconnected. Dry bulk vessel sizes known as Handy (25,000 to 39,000 deadweight tons (dwt)), Handymax (40,000 to 49,999 dwt), and Panamax (60,000 – 78,999 dwt) that carry wheat and other grain cargos are also used to ship iron ore. And, according to S&P Global Commodity Insights, China accounts for almost 60% of dry bulk demand to help supply the country with over 1.1 billion MT of iron ore.

Until recently, however, China’s Zero Covid policy severely impacted economic growth. In 2022 China’s GDP growth slowed to 2.8% from 8.1% in 2021, thus diminishing iron ore demand by 2% as steelmaking slowed. With decreased Chinese vessel demand, freight rates have plummeted. As the seasonal lulls in economic activity around the Chinese Lunar New Year holiday dissipate, China remains a wildcard in global shipping as the country relaxes its COVID-19 restrictions, potentially opening the door for accelerating growth and industrial activity.
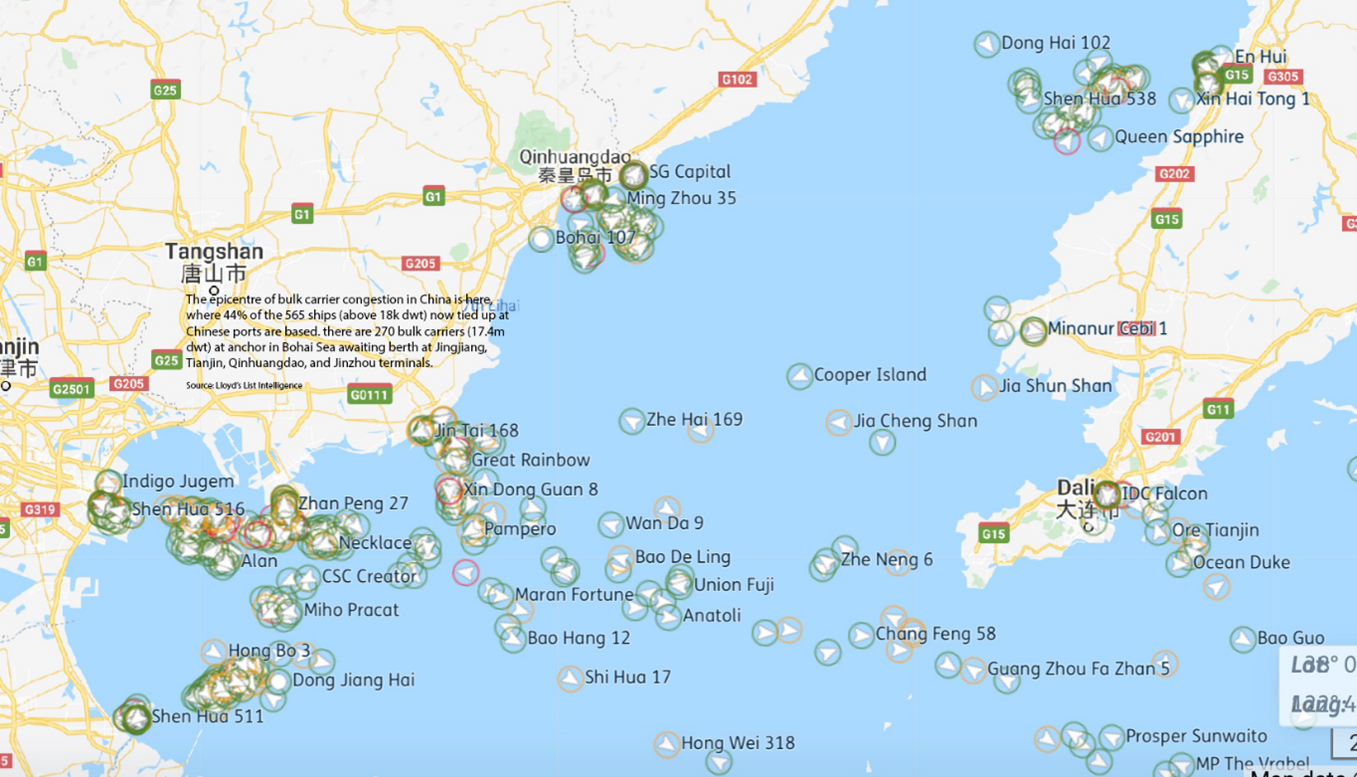
Congestion

According to Lloyd’s List, in the fall of 2021, 5.7% of the world’s bulk fleet was anchored off Chinese ports due to strict quarantine requirements. As the global economy started its recovery from the pandemic, immense port congestion tied up hundreds of vessels, sending dry bulk freight soaring. Easing congestion in Chinese ports is expanding dry bulk capacity and will continue to play an essential role in freight markets in 2023, especially as China lifts more COVID-related restrictions.

Map showing massive vessel congestion around Chinese ports in 2021 that affected freight rates.

Port congestion in China supported the bulk carrier rates in 2021, with upwards of 600 vessels queued to load or discharge cargo. Source: Lloyds List Maritime Intelligence.

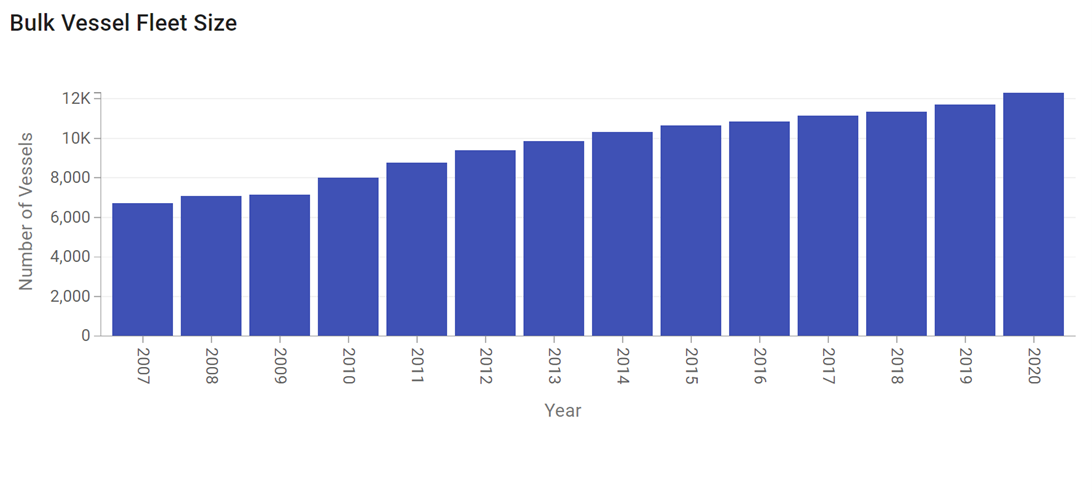
Vessel Supply and Demand

Over the last 13 years, the dry bulk vessel fleet has increased steadily, marking an average yearly increase of 4.8%, total growth of 53.8% since 2010. In 2022 dry bulk fleet growth slowed to 2.8% and is forecast to slow to 2.3% in 2023 (S&P Global, HJ O’Neil Commodity Consulting). Meanwhile, dry bulk demand declined by 1.9% in 2022 due to low iron ore and reduced grain shipments. If vessel supply continues to outpace demand, the downward pressure will continue to impact ocean freight.

Bar chart showing a 53% increase in the global dry bulk vessel fleet from 2007 to 2020 to show the effect on freight rates.

The bulk vessel fleet size had grown by 53.8% on a steady pace over the last decade. Source: Drewry Shipping Consultants Ltd.

Oil Prices

After Russia’s invasion of Ukraine in February 2022, oil prices skyrocketed as sanctions were placed against Russia, the world’s second largest oil produce. As oil prices increase, the fuel input cost for dry bulk vessels also increase, supporting freight prices. In the year since the invasion, oil prices have normalized, taking pressure off the market.

Will This Pattern Hold?

As the freight market continues in freefall, importers and exporters must ask if this pattern is sustainable. According to Breakwave Advisors “one of the slowest weeks of the year for Chinese activity is now behind us” as we move into February and past the Lunar New Year festivities. Vessel supply and demand, port congestion, oil prices, and the on-going supply chain disruptions will continue to impact the market as economies normalize post-COVID; however, China remains in the driver’s seat of global freight. The resilience of the Chinese economy will be put to the test as economic activity increases post COVID, but for now, the world is waiting and all eyes are on China.

By Tyllor Ledford, USW Market Analyst

February 14, 2023/by Steve Mercer
Share this
  • Share on Facebook
  • Share on Twitter
  • Share on WhatsApp
  • Share on LinkedIn
  • Share by Mail
https://www.uswheat.org/wp-content/uploads/P1050373.jpg 1536 2048 Steve Mercer https://www.uswheat.org/wp-content/uploads/USW-Logo-Full-Color.png Steve Mercer2023-02-14 13:40:112023-02-14 17:52:16Ocean Freight Rates Revert to Pandemic Lows

Wheatletter Sidebar

Quick Links

  • Newsroom
  • Wheat Letter Blog
  • News Releases
  • Videos

Wheat Letter Related Blogs

A mature soft white wheat field in the Pacific Northwest on a stormy day showing the impact of La Nina on wheat production.
Market and Crop Analysis, Wheat Prices, Wheat Production and Harvest

Changing Weather Patterns Could Favor U.S. Wheat Production

Over the last few weeks, we have analyzed several factors that are shifting or have the potential…
MORE
March 28, 2023
https://www.uswheat.org/wp-content/uploads/Soft-White-Washington-Bailey-Harvest-2019-2.jpg 1600 2400 Steve Mercer https://www.uswheat.org/wp-content/uploads/USW-Logo-Full-Color.png Steve Mercer2023-03-28 14:44:492023-03-28 14:44:49Changing Weather Patterns Could Favor U.S. Wheat Production
Image of a hybrid wheat field with a field sign and the name AgriPro HY127.
Hybrid Wheat, Plant Breeding Innovation, Wheat Quality, Wheat Research

USW Welcomes Syngenta’s Hybrid Wheat Commitment

U.S. Wheat Associates (USW) is encouraged that technology company Syngenta expects to have…
MORE
March 28, 2023
https://www.uswheat.org/wp-content/uploads/HY127-scaled.jpg 1920 2560 Steve Mercer https://www.uswheat.org/wp-content/uploads/USW-Logo-Full-Color.png Steve Mercer2023-03-28 11:39:092023-03-28 11:39:09USW Welcomes Syngenta’s Hybrid Wheat Commitment

Stay up to date on wheat industry news!

SUBSCRIBE

Think Farm Export Programs Don’t Matter? Think Again.

GET THE REST OF THE STORY

Our Story

  • About USW
  • Dependable People. Reliable Wheat.
  • Board of Directors
  • Staff Directory
  • Office Locations

Market Information

  • Market Information
  • Price Reports
  • Price Charting Tools
  • Supply and Demand
  • Commercial Sales

Crop Quality

  • Crop Quality
  • Harvest Reports
  • Hard Red Winter
  • Hard Red Spring
  • Hard White
  • Soft White
  • Soft Red Winter
  • Durum

Working with Buyers

  • Working With Buyers
  • Customer Conferences
  • Wheat Classes
  • Wheat Glossary
  • Wheat Grade Factors
  • How to Buy
  • Ask the Expert
  • Resources

Who We Represent

  • Who We Represent
  • Board Meetings
  • State Wheat Commissions
  • Partners
  • Trade Activities

Policy

  • Policy
  • Trade Negotiations
  • Trade Barriers
  • Innovation and Sustainability
  • Food Security and Assistance
  • Public-Private Partnership

News

  • Newsroom
  • Wheat Letter Blog
  • News Releases
  • Videos

DTN Wheat Detail
DTN Corn Detail

2008-2013 U.S. Wheat Associates. All Rights Reserved
Privacy Policy | Non-Discrimination Statement

Scroll to top