On March 28, the United States Department of Agriculture (USDA) released its yearly Prospective Plantings and quarterly Grains Stocks reports. The reports provide crucial insights to U.S. wheat importers as we enter the concluding months of the 2023/24 marketing year and look ahead to the 2024 harvest. This article will analyze USDA’s recent reports on wheat planting and stocks and their implications as we look ahead to 2024/25.
Seeding Less
USDA estimates put the total U.S. wheat area at 47.5 million acres (19.2 million hectares), marking a 4% reduction from the previous year.
Breaking down the estimates by class, the area for winter wheat fell by 7% to 34.4 million acres (13.9 million hectares), with Hard Red Winter (HRW) wheat plantings decreasing by 5% on the year, Soft Red Winter (SRW) falling by 15%, and white wheat (winter and spring) decreasing by 2%. Meanwhile, the Hard Red Spring (HRS) area is expected to increase by 2%, while durum may rise by up to 22%.
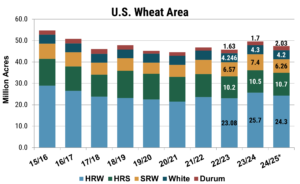
The 2024 wheat area is forecast at 47.5 million acres (10.2 million hectares), down 4% from 2023 but 500,000 acres (202,350 hectares) higher than the USDA Outlook Forum Estimates. The area consists of 24.3 million acres of HRW (approximately 9.83 million hectares), 6.26 million acres for SRW (about 2.53 million hectares), and 4.2 million acres of white wheat (roughly 1.7 million hectares). The HRS area is projected to reach 10.7 million acres (around 4.33 million hectares), while durum is estimated at 2.0 million acres (approximately 0.81 million hectares). The wheat area is forecast at 47.5 million acres (10.2 million hectares), down 4% from 2023 but 500,000 acres (202,350 hectares) higher than the USDA Outlook Forum Estimates. The area consists of 24.3 million acres of HRW (approximately 9.83 million hectares), 6.26 million acres for SRW (about 2.53 million hectares), and 4.2 million acres of white wheat (roughly 1.7 million hectares). The HRS area is projected to reach 10.7 million acres (around 4.33 million hectares), while durum is estimated at 2.0 million acres (approximately 0.81 million hectares).
When the 2023 U.S. winter wheat crop was seeded in 2022, income potential looked favorable, with prices still elevated by Russia’s invasion of Ukraine. As a result, total seeded wheat area for 2023 was up 8% from the prior year. With current prices falling in line with pre-war trends, and input prices lagging, profit margins have tightened, placing additional pressure on farmers and driving the downward shift in acres. Although the 2024 wheat area is down from last year, the overall area remains 2% higher than the five-year average and represents the second-largest area since the 2018/19 season.
Though the spring wheat and durum is not yet planted, favorable prices for durum relative to spring wheat may incentivize producers to substitute durum acres for HRS, particularly in non-traditional durum growing areas. As of April 3, the average country elevator bid for durum sits at $9.88/bu, a significant jump from an average bid of $5.92 for HRS. The favorable price spreads may push durum area as high as 2.0 million acres (810,000 hectares). If realized this would be the largest durum area since 2018/19.
Crop Competition
Profitability continues to drive crop competition, but an increasing reliance on crop rotations is moderating the impact. Farmers use rotations to reduce price risk and control disease cycles, making them less inclined to make significant acreage adjustments based on price alone.
According to USDA’s estimates, soybean area is anticipated to rise 3% to 86.5 million acres (approximately 34.99 million hectares), aligning with traders’ expectations. Meanwhile, the estimated corn area has decreased 5% to 90.0 million acres (about 36.42 million hectares), falling short of the anticipated 91.7 million acres (226.6 million hectares). However, when considering grain and oilseed acres in the context of all principal field crops, the share of acreage planted with wheat, corn, and soybeans remains relatively stable. Wheat and corn account for 15% and 29% of all acres, consistent with the ten-year average, while the proportion of acres planted with soybeans sits about 1% above the long-term average at 28%.
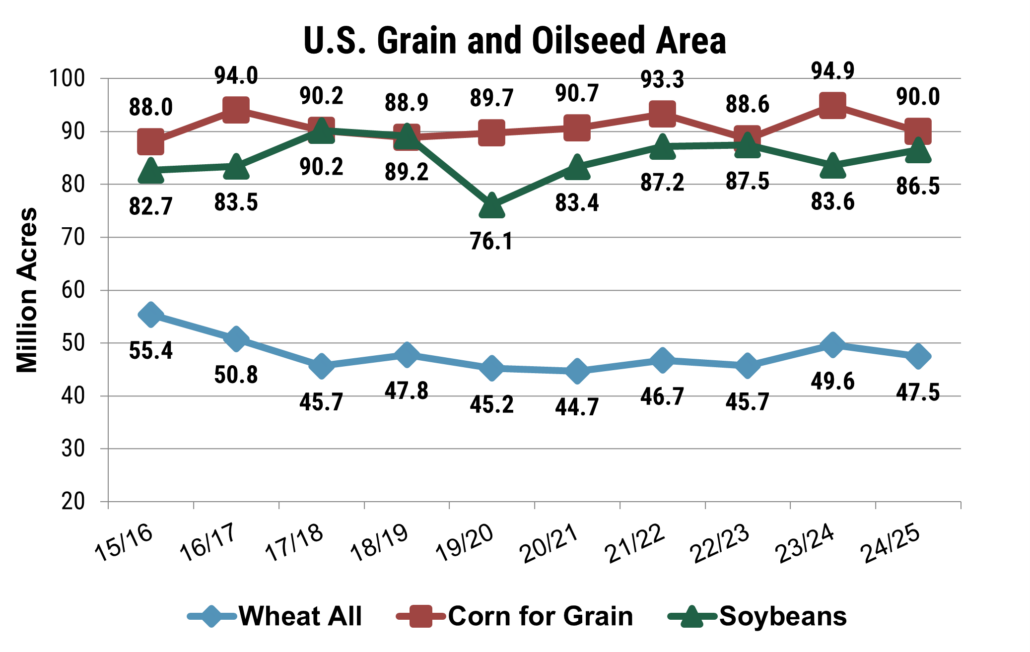
The combined area planted with corn, soy, and wheat decreased by 2% to 224 million acres (90.6 million hectares), down from the near-record 228.1 million acres (92.3 million hectares) from the previous year. Even so, the share of acreage planted with corn, soybeans, and wheat remains in line with the five- and ten-year averages. Source: USDA Prospective Planting s Report
Stocks: Up But Still Tight
Also released on March 28, the quarterly USDA Grain Stocks report put total wheat stocks at 29.6 MMT, as of March 1. On-farm stocks were estimated at 7.4 MMT, up 16% from last year, while off-farm stocks came in at 22.2 MMT, up 14% from the year prior. The increased stock levels bolster USDA’s ending stocks estimate of 18.3 MMT, marking an 18% rise from 2023/24 and the first increase since 2015/16. Increased ending stocks helps relieve short term pressure on the U.S. balance sheet.
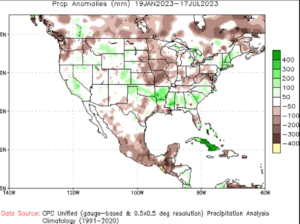
Moreover, even as planted area is forecast to decrease, the prospects for increased yields and greater wheat production are optimistic as drought conditions improve across the U.S. Southern Plains. The first USDA Crop Progress report of the year indicates that 56% of winter wheat is in good to excellent condition, a significant improvement from 28% at the same time last year. Increased production will help loosen the U.S. balance sheet and diminish supply related price pressures.
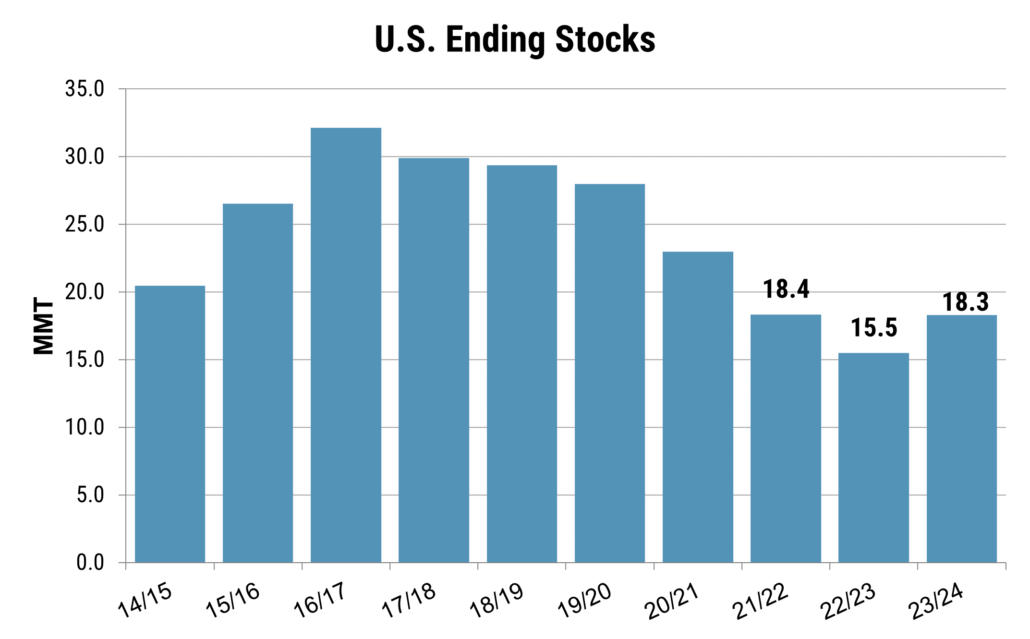
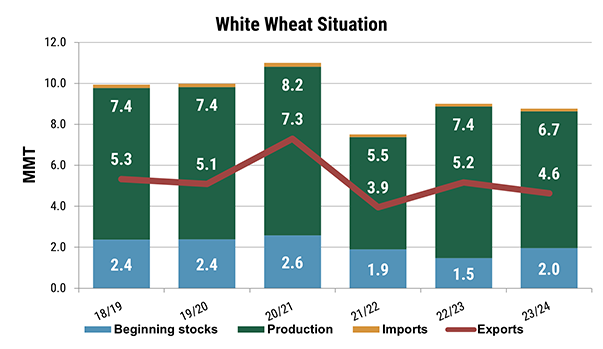
On-farm stocks were estimated at 7.4 MMT, up 16% from last year, while off-farm stocks came in at 22.2 MMT, up 14% from last year. The increased stock levels help confirm higher ending stocks for 2023/24. As exports remain lackluster and domestic demand steady, the USDA ending stocks are expected to grow 18% to 18.3 MMT. Source: World Agricultural Supply and Demand Estimates
Nevertheless, underlying tightness remains. U.S. stocks still sit at one of the lowest levels since 2013/14, and with global wheat consumption surpassing production, the global stocks-to-use ratio (excluding China) has dropped to 20%, the lowest point since the 2007/08 season.
More to Come
With a looser balance sheet in the short term tempered by decreased acres, the recent 2024 crop reports provided a mixed sentiment. It is also important to note that USDA’s estimates are based on surveys of U.S. farmers current intensions and may be subject to change as planting ramps up in the coming weeks. With spring wheat planting only 1% completed and winter wheat 4% headed, a definitive statement regarding the 2024 crop is yet to be written.
Moving forward, the May 2024 World Agricultural Supply and Demand Estimates (WASDE) will provide further insights into the 2024/25 marketing year and the July 2024 WASDE will give the initial by-class wheat production estimates. Also, make sure to follow the weekly and monthly reports from USW and USDA on crop conditions, harvest, and production. As always, U.S. Wheat Associates remains committed to offering information and support as we transition into the 2024/25 marketing year.
By USW Market Analyst Tyllor Ledford.