Last week, USDA released three reports giving some indication of what may be ahead for the 2022 global wheat market. Those USDA reports were the monthly World Agricultural Supply and Demand Estimates (WASDE) report, the quarterly Grain Stocks report, and the annual Winter Wheat Seedings report.
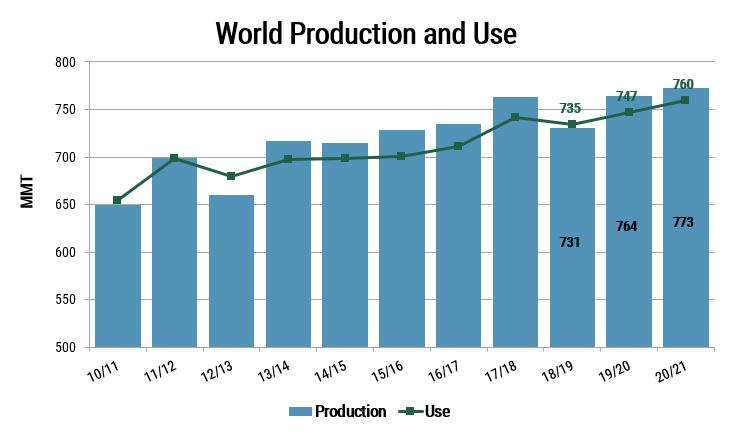
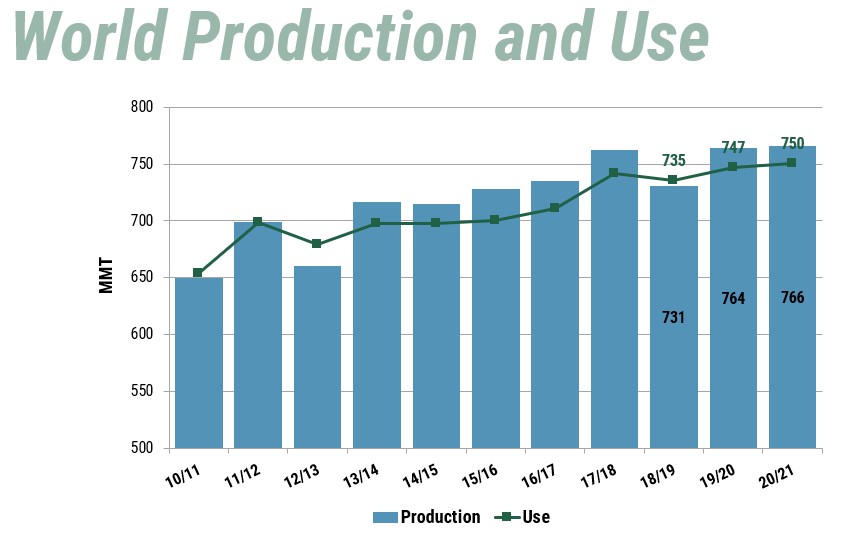
Considering all three reports, U.S. Wheat Associates (USW) notes that the latest WASDE report showed few unexpected changes to the worldwide balance sheet of wheat. Some upward revisions were made in Argentina and the EU. Still, the reports forecast global consumption far higher than production. The Grain Stocks report reflected the significant drop in total 2021/22 U.S. wheat production. Predictably, U.S. farmers seeded more winter wheat for a second year in a row.
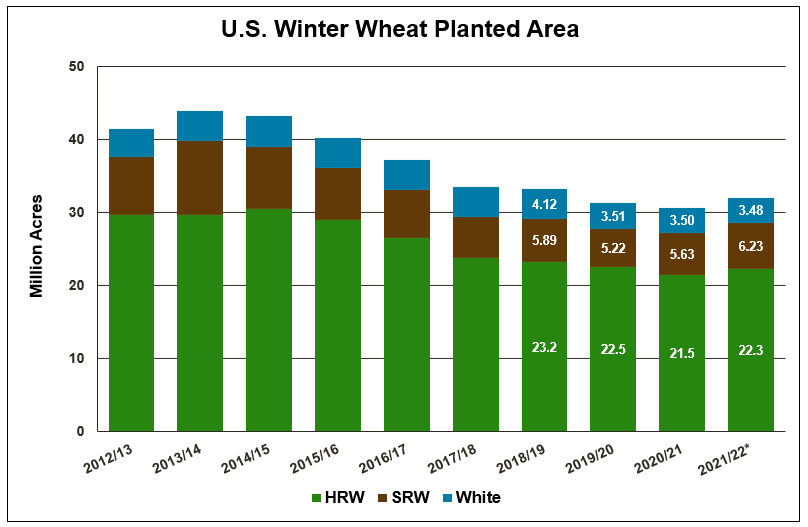
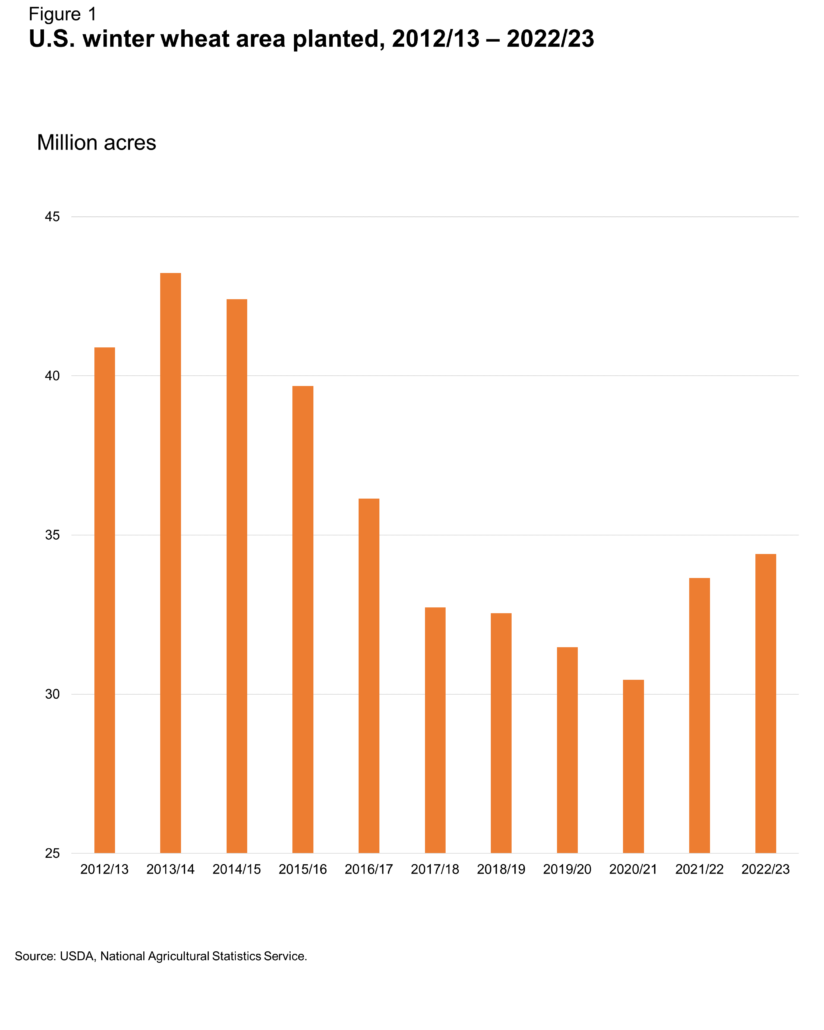
In fact, after winter wheat plantings fell to their lowest level in more than a century in 2020/21, U.S. winter wheat seeded area for marketing year 2022/23 has increased for the second year in a row, up 2% from 2021 and 13% compared to 2020 reported the National Agricultural Statistics Service (NASS) in their annual Winter Wheat Seedings report released Jan. 12, 2022. Winter wheat seeded acres are the most they have been since 2016/17.
According to recent USDA reports, U.S. farmers are responding to increased global demand and lower U.S. stocks by seeding more winter wheat in 2022.
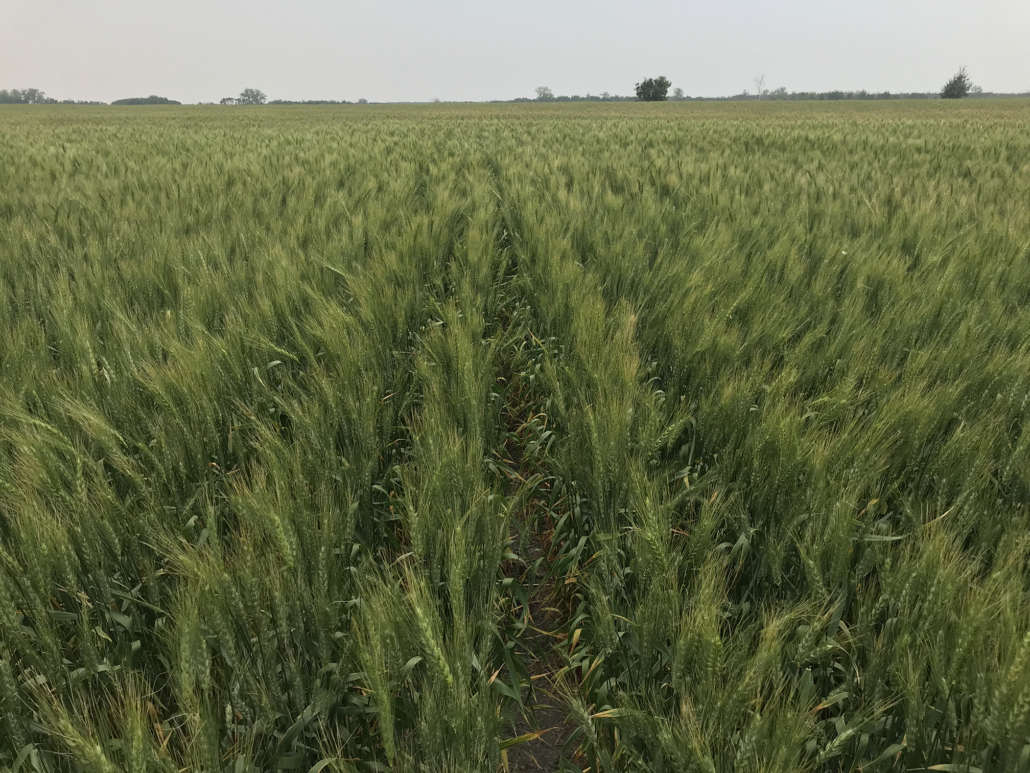
The Winter Wheat Seedings report showed farmers planted 23.8 million acres (9.6 million hectares) of hard red winter (HRW). This report is up 1% from 2021, led by Kansas, up 3%, and Texas, up 2%. Notable drops in seeded area came in Colorado, down 2%, and New Mexico down 11%.
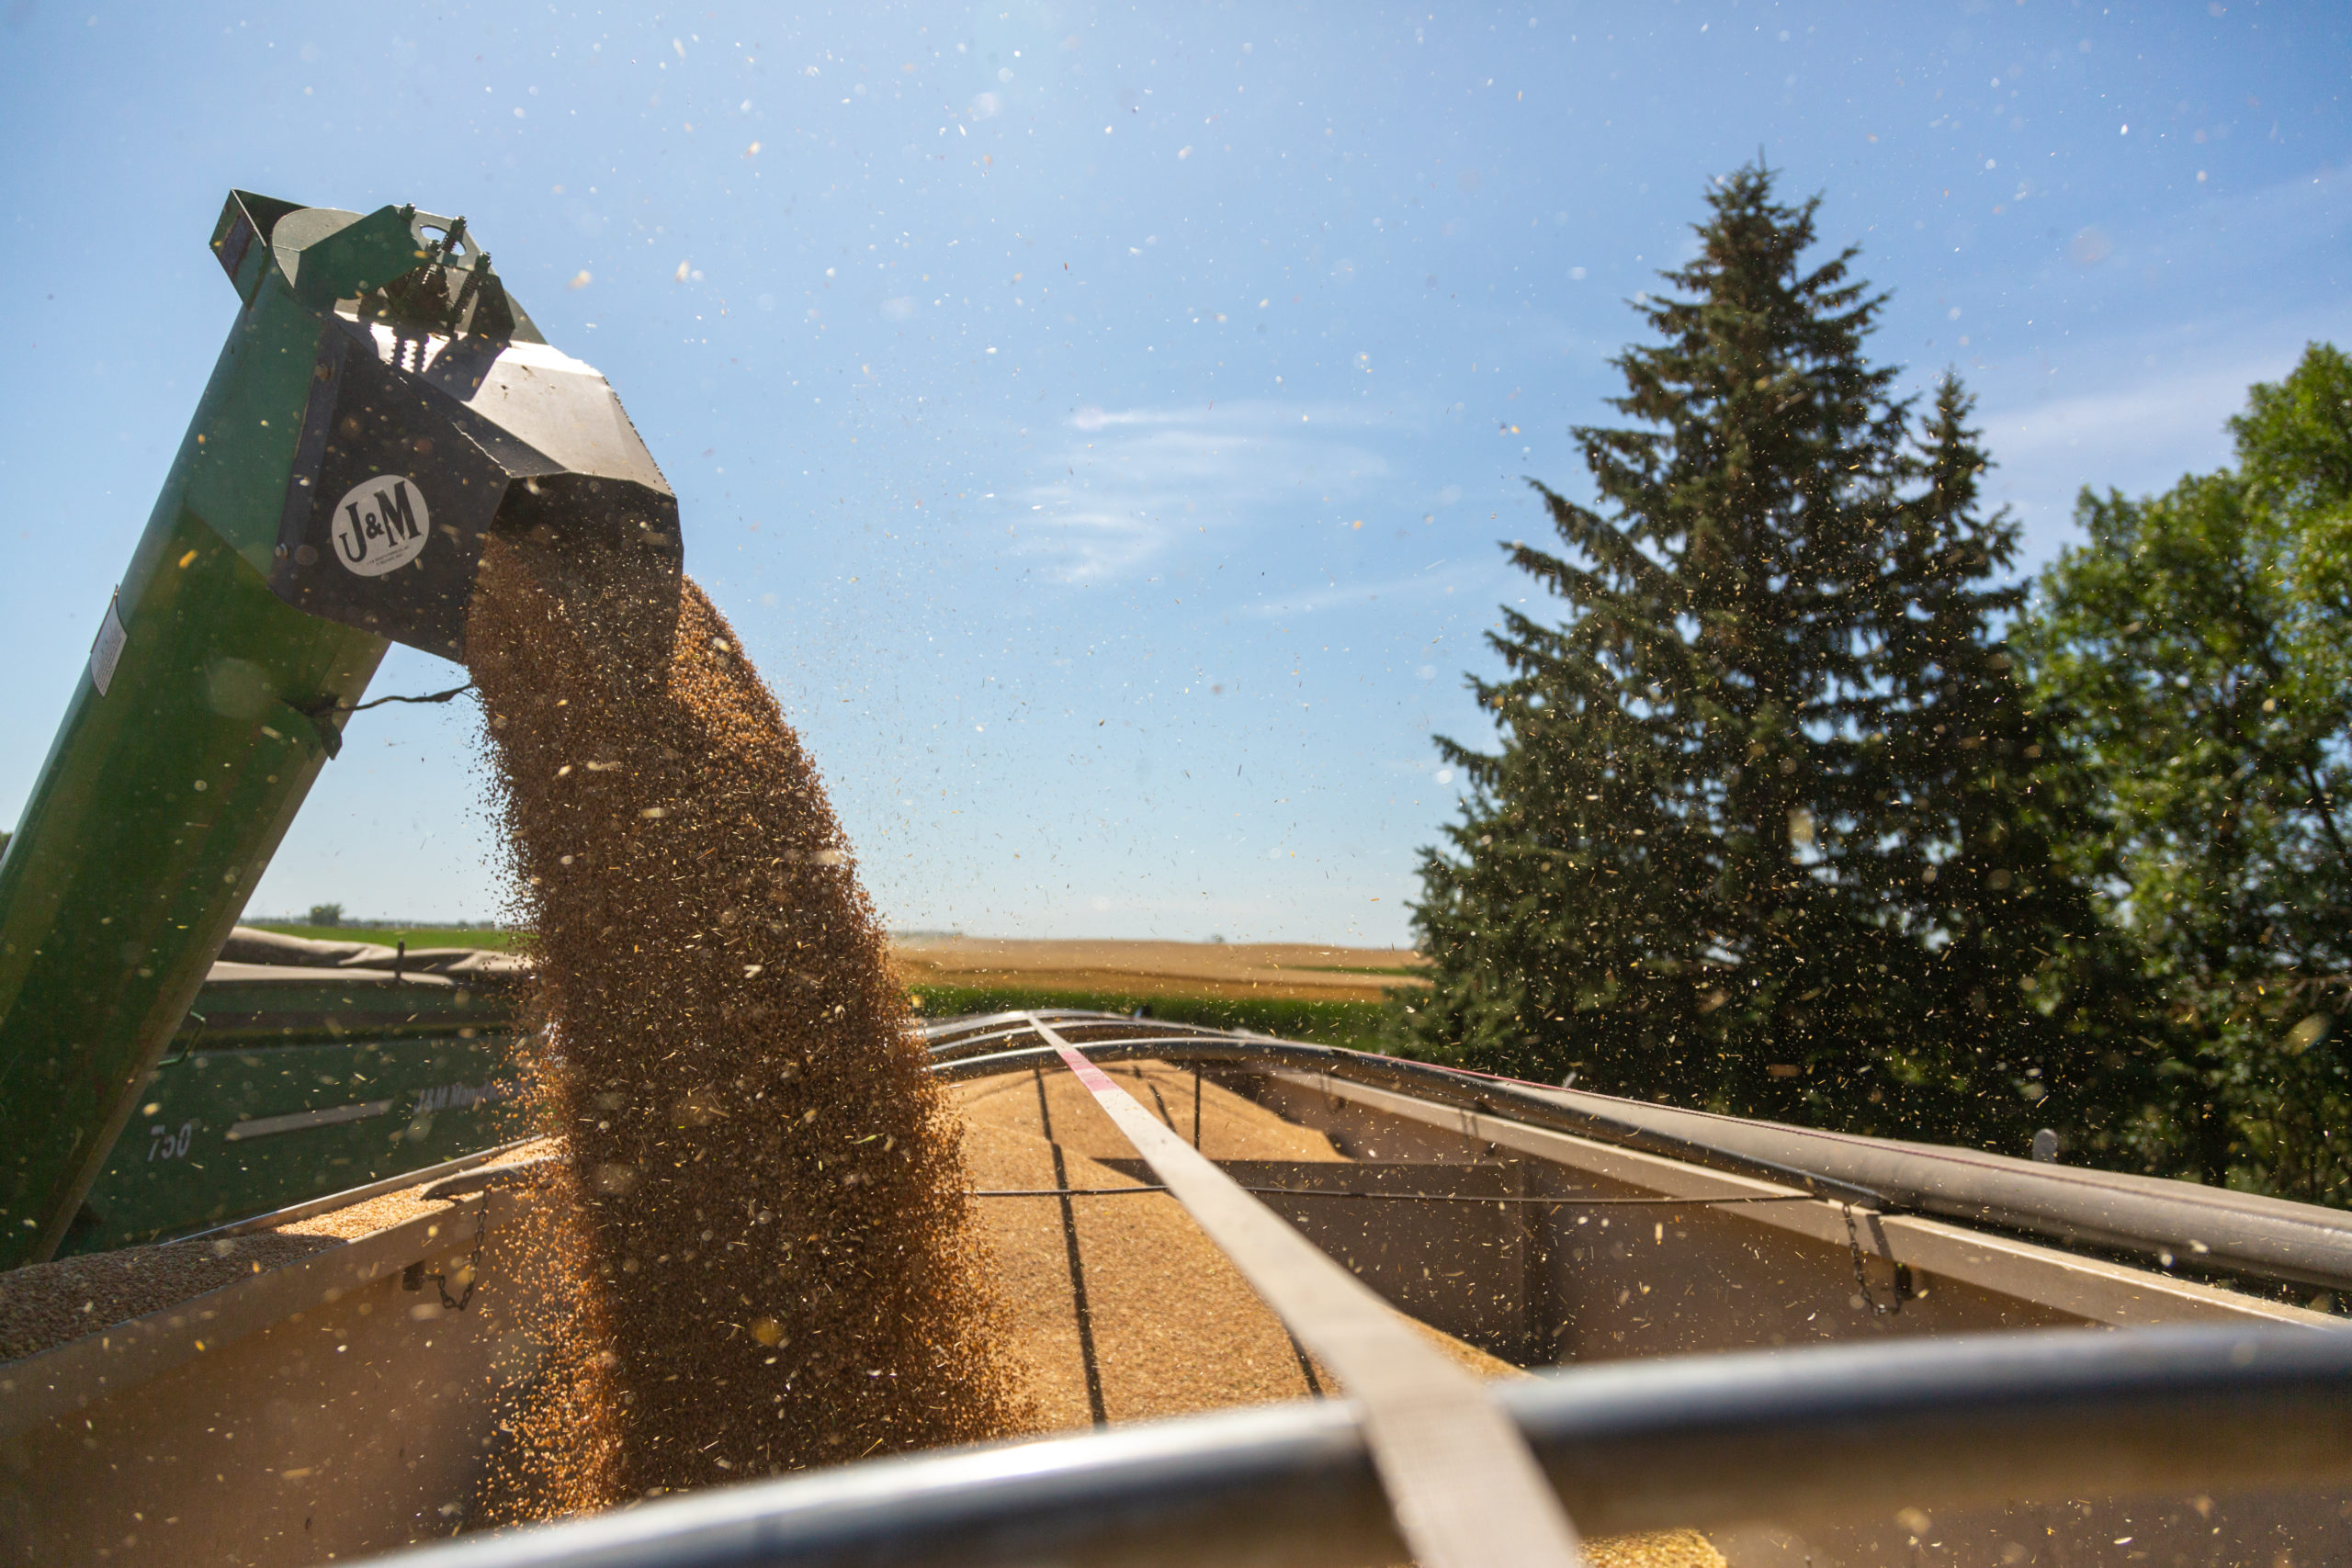
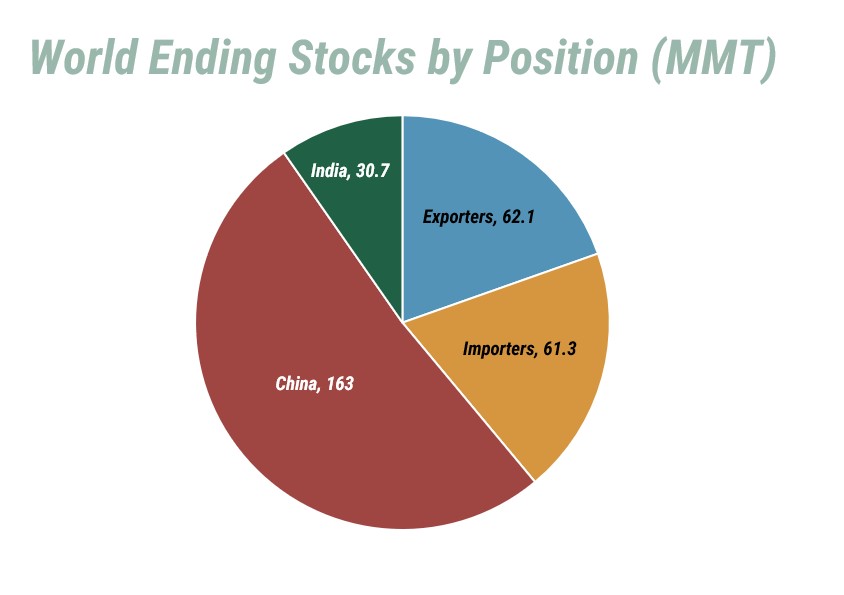
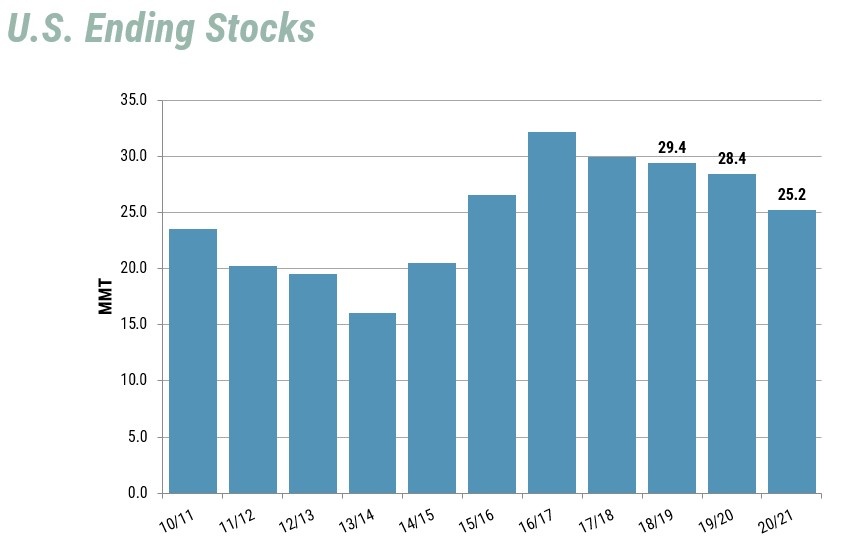
The quarterly USDA Grain Stocks report confirmed all U.S. wheat in storage, both on and off farm, was down 18% compared to a year ago, while disappearance was down 16% compared to the year before. Analysts expect ending stocks for the 2021/22 marketing year to be the smallest since 2013/14 at 628 million bushels (17.09/MMT).
Price Signals
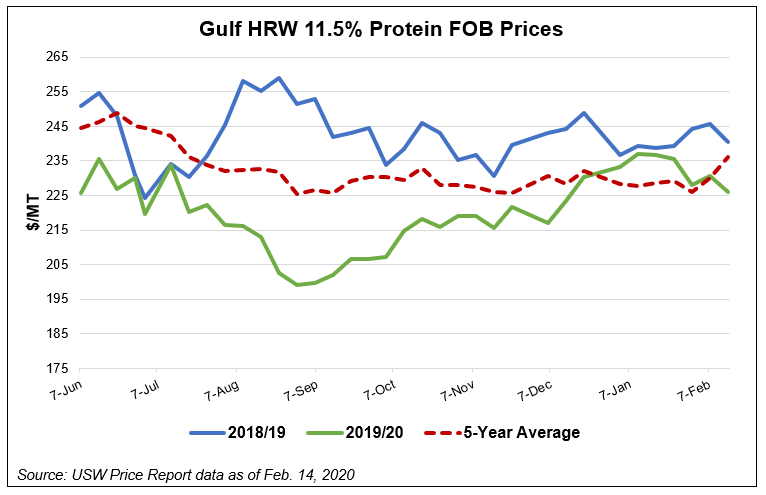
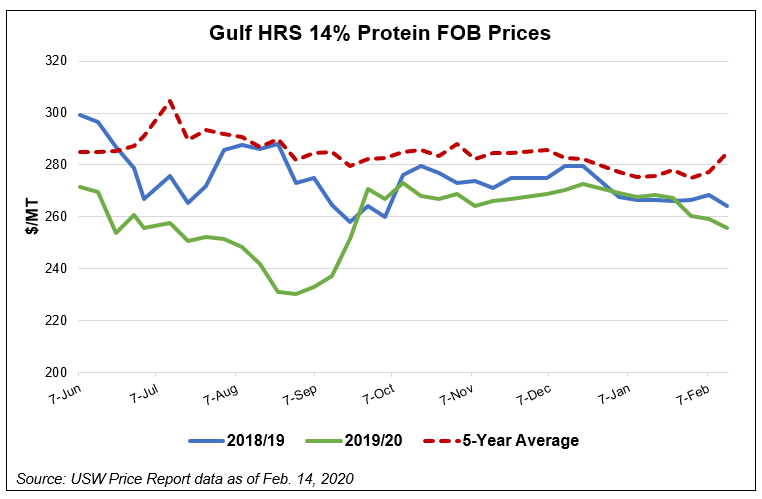
Increased cash price this year has no doubt played a role in farmer decisions to seed more HRW acres. Kansas Wheat Commission CEO Justin Gilpin noted higher HRW prices as one reason for a second consecutive year of higher wheat plantings. Year-over-year prices for HRW at 12% protein (12% moisture basis) are up 24%.
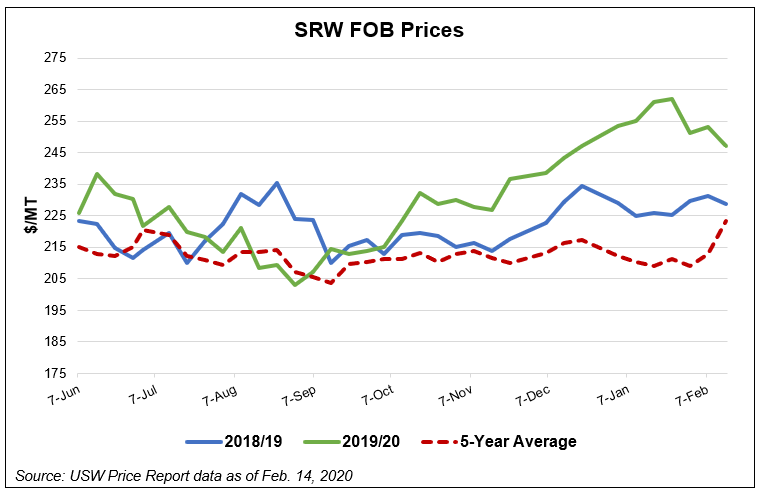
Soft red winter (SRW) farmers have also taken advantage of strong pricing and increased export demand to plant more SRW acres. Estimates of SRW for the 2022/23 marketing year are 7.07 million acres (2.86 million hectares), 6% higher than last year. Increased acres are largest in Missouri, up 38%, North Carolina is up 31% and Ohio up 21%. USDA reported decreases in Maryland, down 16%, and Michigan, down 23%. The 2021/22 SRW export pace is 50% ahead of last year’s pace year-to-date.
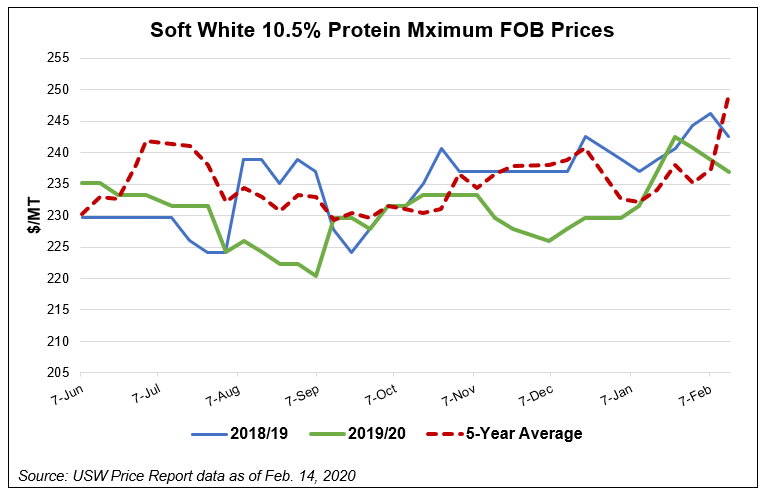
Estimated white winter wheat (soft white and hard white) are 3.56 million acres (1.44 million hectares). This estimate is up 2% from 2021.
Desert Durum® seeded area in California and Arizona of 90,000 acres (36,421 hectares) is up 15% compared to last year and 20% compared to 2020.
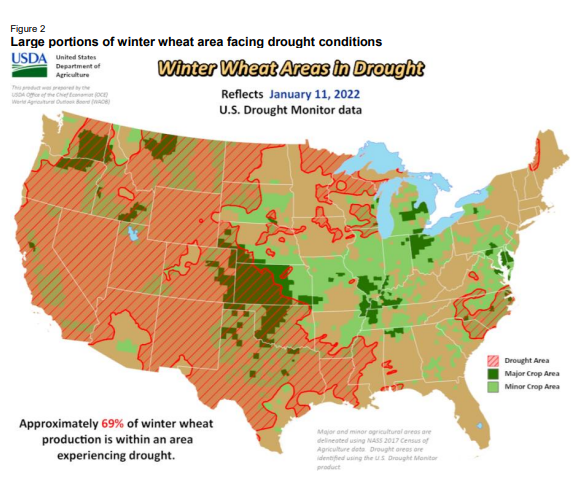
Drought Lingers in the Plains
In the monthly “Wheat Outlook” report published by the Economic Research Service (ERS) of the USDA, analysts reported that major HRW producing states, mostly concentrated in the Plains states, saw conditions for winter wheat degrade since November but noted that spring conditions are more influential on production numbers. Kansas’s Gilpin noted “attention has turned to expanding drought ratings across HRW regions and potentially yield and production impacts. Dry conditions and higher input costs both are concerns.”
By Michael Anderson, USW Market Analyst