Six sets of seven chromosomes make the wheat genome five times larger than the human genome. This complexity makes wheat breeding even more difficult, but technology like double haploid breeding has helped public and private researchers unlock potential agronomic, quality and even nutritional traits. Key to this work is a farmer-backed, for-profit plant services company housed at the Kansas Wheat Innovation Center — Heartland Plant Innovations (HPI).
Starting with Synergy
Technology for crop improvement experienced a boom in the early 2000s, but applying those techniques was focused on corn and soybeans. The push to start HPI was the result of the industry’s recognition that wheat was being left behind when it came to applying innovative breeding tools.
“We were just trying to bring the message that we needed to make sure that wheat stayed relevant in the United States compared to other crops,” said HPI President/CEO Dusti Gallagher. “We wanted to let them know producers, specifically in Kansas and HRW (hard red winter wheat) producers, were really interested in bringing innovations and technology to the forefront with wheat because, at the time, we were losing a little ground to other crops.”

Dusti Gallagher
The industry faced another significant challenge at the time — a lack of synergy and collective focus. As a result, a core group brought together representatives from across the industry, including producers representing the Kansas Wheat Commission and the Kansas Association of Wheat Growers, Kansas State University, the University of Kansas (K-State) and private companies.
“It started with communication. At that time, there was very little communication between the public and private sectors on wheat breeding; everybody was doing their own thing,” Gallagher said. “So, it started with bringing everybody to the same table to talk about what our common interests were. And once we did that, it started falling into place.”
Heartland Plant Innovations was officially formed in 2009. Kansas farmers, through state organizations, have majority ownership in HPI, and other members include private companies, universities and individual shareholders. The company started in Throckmorton Hall but quickly recognized that their work to amp up breeding technology required lab space, growth rooms, greenhouse space and other spaces to mix soil, plant pots, thresh heads and more. As a result, the early success of HPI helped provide the spark that led to the construction of the Kansas Wheat Innovation Center, where the company is now housed.
Today, HPI has seven full-time staff drawn from all over the world for their unique expertise, including agronomy, molecular biology, botany and biotechnology. In addition, two to three part-time students gain hands-on experience by assisting with harvesting, threshing, caring for plants and more.
Doubling Down on Double Haploids
Instead of competing with public and private wheat breeding programs, Heartland Plant Innovations was built around the idea of providing additional bandwidth and applying very specific technologies to assist those programs. The first — and still primary — of these tools is the production of double haploids, which essentially cuts half the time out of the wheat breeding process.
“We’re basically taking only the genetic material from one of the parents, the female parent, and we’re keeping those genetics and rebuilding that plant to where it can be a mature seed-producing plant,” Gallagher said. “And so, there’s a lot of steps along the way.”
The goal of the double haploid process is to create a population of plants that all have the same genetics across all their chromosomes, something that takes generations of traditional breeding to achieve but can be accomplished in a single year with the double haploid process.
The doubled haploid process rapidly yields true-breeding lines that can reliably be tested and selected for specific, desirable improvements. Conventional plant breeding techniques achieve the same objective but over a much longer time. For winter wheat, the doubled haploid process delivers true breeding wheat lines in just one year, as compared to about six years for conventional methods. Source: Heartland Plant Innovations.
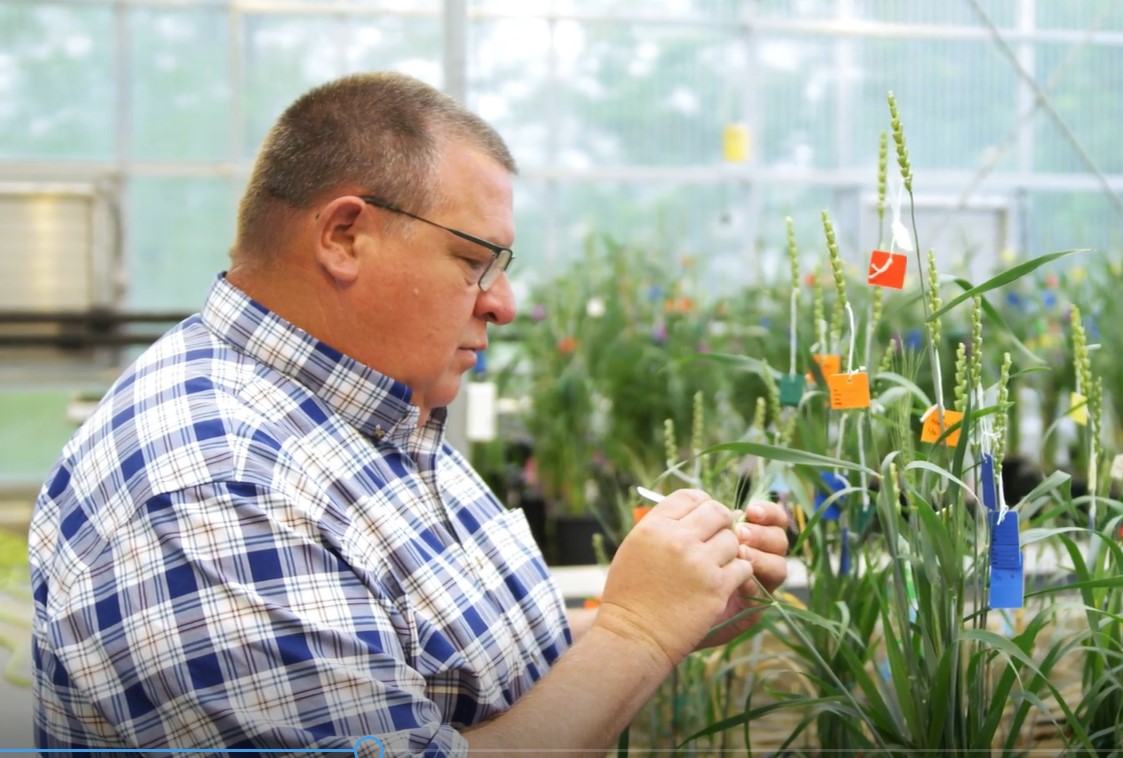
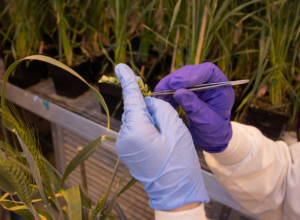
“We’re basically rescuing a very tender, very delicate haploid embryo and culturing it and taking care of it until it becomes a viable seedling,” Gallagher said. “Then we double its chromosomes through a process that we’ve created and that we’ve refined here at HPI. And that doubling process then creates a double haploid plant.”
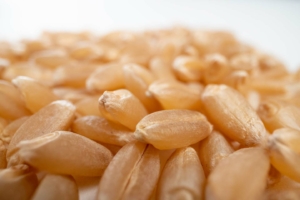
The seeds from these plants then go back to wheat breeding programs, where breeders know the exact genetic material and can more efficiently evaluate lines in their programs.
“When they take it to the field, and they grow it, and they start evaluating it, they know its genotype, then they can make better decisions, and they can either advance that line quickly through their program, or they can make a decision that they need to do more crossing with it,” Gallagher said. “So, the double haploid process is a tool that allows a better-quality line to go through the process, and breeders can advance it quickly, and they can make better decisions based on that very pure genetic line that we provide to them.”
Heartland Plant Innovations has capacity to produce 20,000 double haploids a year and works with customers from all over the United States, from wheat breeders to public and private crop improvement programs. The process is fee-for-service, so it is open to the entirety of the wheat breeding pipeline.
“Over the last couple of years, we’ve seen the first seeds that have gone through our program,” Gallagher said. “They’ve been released to producers, and so they’ve been very good, healthy varieties that have proven to be profitable for producers.”
In addition to double haploid production, HPI also provides technical expertise using other advanced plant breeding tools, including genotyping and marker-assisted selection as well as supporting traditional wheat breeding programs and proprietary projects. Every piece of the business, however, is built on partnerships.
“The producers are really the foundation for all of this,” Gallagher said. “Everything that we do is driven toward making a better opportunity for those producers to have better varieties to be able to improve their bottom lines.”
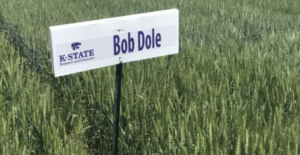
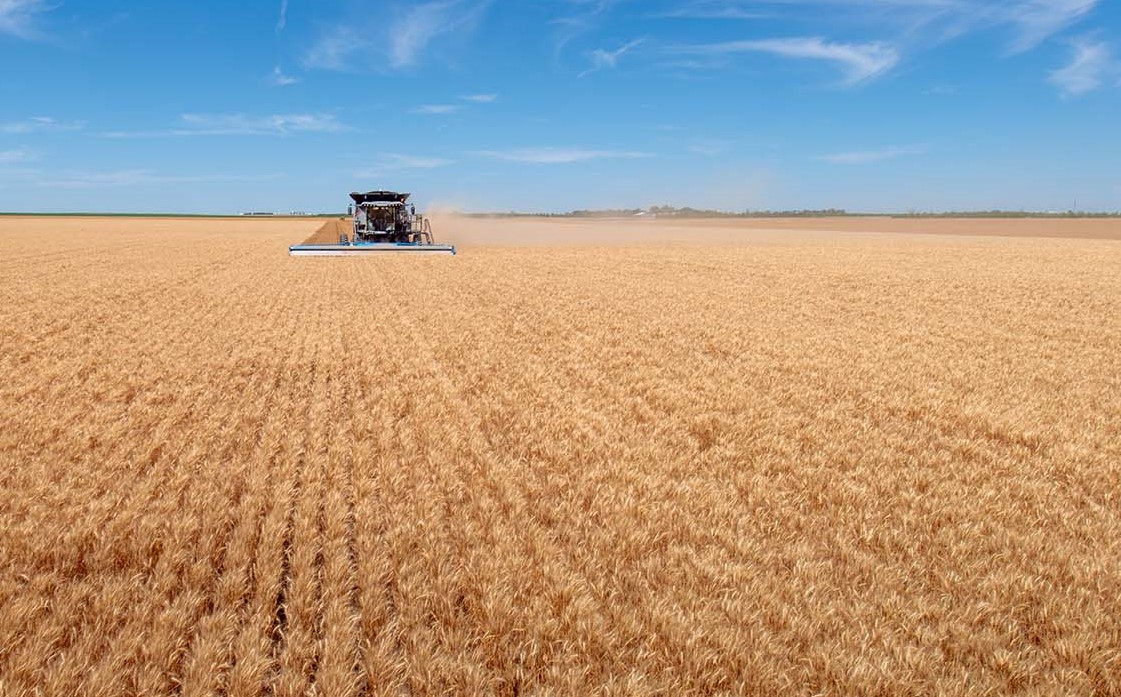
The end result of breeding research at the Kansas Wheat innovation Center – Heartland Plant Innovations is new high-yielding, high-quality wheat varieties for farmers and their milling and baking customers around the world.
More to Come
![]() From uncovering the dense nutrients for improving wheat as a food crop to bringing in trails from wheat’s wild relatives or improving agronomic traits, Gallagher told Harries there is still more to unlock in the wheat genome.
From uncovering the dense nutrients for improving wheat as a food crop to bringing in trails from wheat’s wild relatives or improving agronomic traits, Gallagher told Harries there is still more to unlock in the wheat genome.
“I really don’t believe that we have tapped the genetic potential of wheat,” Gallagher said. “We’re just now getting to the point where we’ve mapped the wheat genome, and there’s still so much in there that we need to help discover, and that takes time.”
“Investment in wheat research is critical to us continuing to uncover the vast benefits wheat has to offer,” Gallagher said. “Continue to support universities and checkoffs because it’s those wheat research dollars that are really going to make an impact. We just need to keep doing what we’re doing, but also looking at new opportunities and new technologies — and that’s what we’re here to do at HPI.”
Julia Debes wrote this article for Kansas Wheat, a member of U.S. Wheat Associates (USW). Gallagher recently sat down with Aaron Harries, Kansas Wheat Vice President of Research and Operations, on the Kansas Wheat “Wheat’s on Your Mind” podcast to discuss HPI’s positive impact on the wheat breeding pipeline.