thumbnail

With U.S. hard red winter (HRW) and hard white (HW) wheat moving into its crucial vegetative state, U.S. Wheat Associates (USW) and its state wheat commission member organizations have started weekly conference calls to share wheat condition reports. Overall, wheat in Central and Southern Plains entered 2024 in better condition than compared to the prior three years. Although recent weather has turned warm, windy, and dry, industry participants remain optimistic for the 2024 crop.

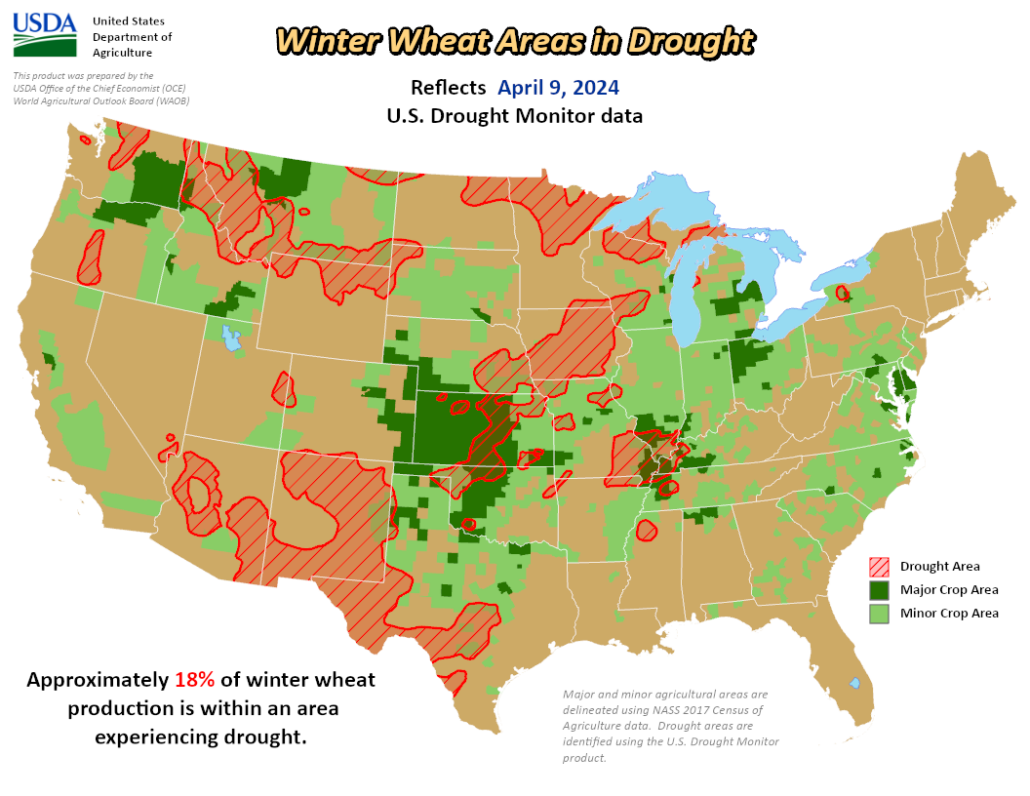
The most recent 2024 USDA Crop Progress report rated 56% of the winter wheat crop in good to excellent condition, up significantly from 27% last year. As of April 8, 6% of winter wheat is headed in the Southern Plains. USDA reported as of April 9, an estimated 18% of all U.S. winter wheat production is within an area experiencing drought.

Latest HRW Wheat Conditions

As usual, Texas leads the way in crop progress with 27% of its HRW and soft red winter wheat headed. At 44% good to excellent, conditions remain encouraging.

In Central Oklahoma, wheat progress continued to benefit from recent rains with 55% at the jointing stage. Good to excellent wheat condition in the state was 68% as of April 7. USW Chair Michael Peters farms northwest of Oklahoma City and reported this week that the condition of his HRW wheat varies from excellent to “just okay.”

Conditions in Kansas are also variable with 49% rated good to excellent. Jason Ochs farms in far western Kansas and recently told Kansas Wheat that it was a nice change to get a good stand right from the start last fall. Yet he also said his topsoil is dry.

“We missed the last three of four moisture chances, so optimism is going down a little bit,” Ochs said. “As of now, it looks like we are going to raise above-average yields. I don’t know how you cannot be a little excited about that.”

Drought has eased for the 2024 U.S. winter wheat crop. On April 18, 2023, 50% of winter wheat production was within an area experiencing drought.

Mixed Bag in Colorado

High winds in eastern Colorado have dried out fields and hurt winter wheat stands.

“Overall things are looking better than they did a year ago at this time,” said Madison Andersen, Colorado Wheat Administrative Committee Director of Communications and Policy. “However, it is a critical time for moisture, especially after the high winds and warm temperatures we have seen the last two weeks.”

In Nebraska, good to excellent winter wheat was at 68% as of April 7, but with the area’s dry and windy conditions, industry representatives say more rain is needed to make the crop. And in Wyoming’s southeastern region, USDA estimates that 91% of the wheat is in fair to good condition. That is up from 63% at the same time in 2023 and from the five-year average for this date of 74% fair to good.

USW will start publishing its 2024 weekly Harvest Reports after the combines start to roll in Texas. Follow the reports, posted every Friday, online here, or sign up here to have Harvest Reports emailed to you.

thumbnail

On March 28, the United States Department of Agriculture (USDA) released its yearly Prospective Plantings and quarterly Grains Stocks reports. The reports provide crucial insights to U.S. wheat importers as we enter the concluding months of the 2023/24 marketing year and look ahead to the 2024 harvest. This article will analyze USDA’s recent reports on wheat planting and stocks and their implications as we look ahead to 2024/25.

Seeding Less

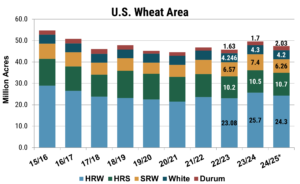
USDA estimates put the total U.S. wheat area at 47.5 million acres (19.2 million hectares), marking a 4% reduction from the previous year.

Breaking down the estimates by class, the area for winter wheat fell by 7% to 34.4 million acres (13.9 million hectares), with Hard Red Winter (HRW) wheat plantings decreasing by 5% on the year, Soft Red Winter (SRW) falling by 15%, and white wheat (winter and spring) decreasing by 2%. Meanwhile, the Hard Red Spring (HRS) area is expected to increase by 2%, while durum may rise by up to 22%.

Bar chart showing seeded area of 5 wheat classes between 15/16 and 24/25.

The 2024 wheat area is forecast at 47.5 million acres (10.2 million hectares), down 4% from 2023 but 500,000 acres (202,350 hectares) higher than the USDA Outlook Forum Estimates. The area consists of 24.3 million acres of HRW (approximately 9.83 million hectares), 6.26 million acres for SRW (about 2.53 million hectares), and 4.2 million acres of white wheat (roughly 1.7 million hectares). The HRS area is projected to reach 10.7 million acres (around 4.33 million hectares), while durum is estimated at 2.0 million acres (approximately 0.81 million hectares). The wheat area is forecast at 47.5 million acres (10.2 million hectares), down 4% from 2023 but 500,000 acres (202,350 hectares) higher than the USDA Outlook Forum Estimates. The area consists of 24.3 million acres of HRW (approximately 9.83 million hectares), 6.26 million acres for SRW (about 2.53 million hectares), and 4.2 million acres of white wheat (roughly 1.7 million hectares). The HRS area is projected to reach 10.7 million acres (around 4.33 million hectares), while durum is estimated at 2.0 million acres (approximately 0.81 million hectares).

When the 2023 U.S. winter wheat crop was seeded in 2022, income potential looked favorable, with prices still elevated by Russia’s invasion of Ukraine. As a result, total seeded wheat area for 2023 was up 8% from the prior year. With current prices falling in line with pre-war trends, and input prices lagging, profit margins have tightened, placing additional pressure on farmers and driving the downward shift in acres. Although the 2024 wheat area is down from last year, the overall area remains 2% higher than the five-year average and represents the second-largest area since the 2018/19 season.

Though the spring wheat and durum is not yet planted, favorable prices for durum relative to spring wheat may incentivize producers to substitute durum acres for HRS, particularly in non-traditional durum growing areas. As of April 3, the average country elevator bid for durum sits at $9.88/bu, a significant jump from an average bid of $5.92 for HRS. The favorable price spreads may push durum area as high as 2.0 million acres (810,000 hectares). If realized this would be the largest durum area since 2018/19.

Crop Competition

Profitability continues to drive crop competition, but an increasing reliance on crop rotations is moderating the impact. Farmers use rotations to reduce price risk and control disease cycles, making them less inclined to make significant acreage adjustments based on price alone.

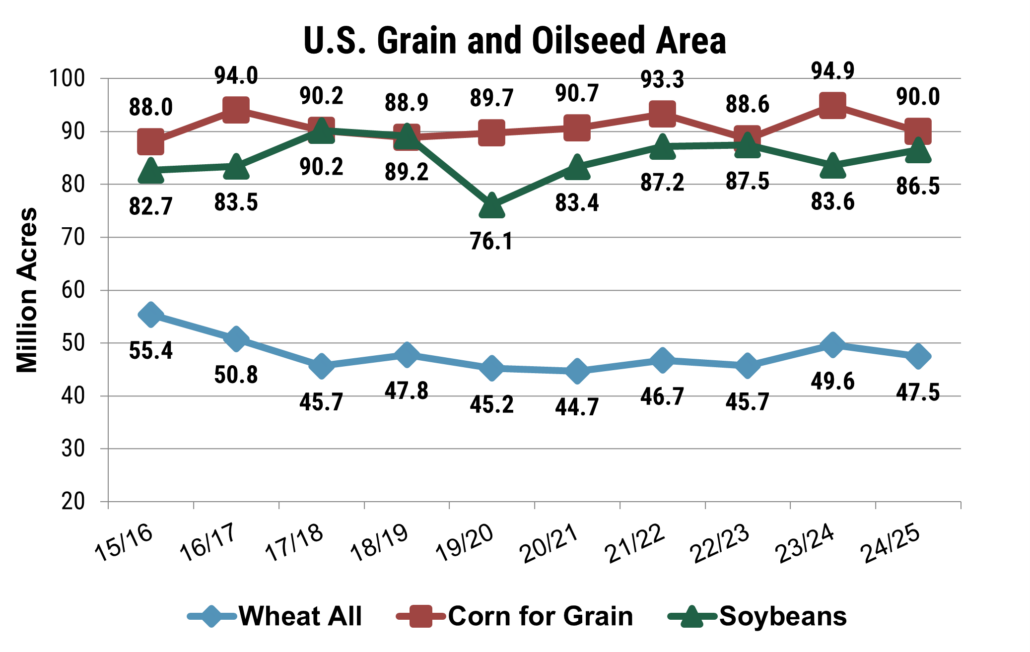
According to USDA’s estimates, soybean area is anticipated to rise 3% to 86.5 million acres (approximately 34.99 million hectares), aligning with traders’ expectations. Meanwhile, the estimated corn area has decreased 5% to 90.0 million acres (about 36.42 million hectares), falling short of the anticipated 91.7 million acres (226.6 million hectares). However, when considering grain and oilseed acres in the context of all principal field crops, the share of acreage planted with wheat, corn, and soybeans remains relatively stable. Wheat and corn account for 15% and 29% of all acres, consistent with the ten-year average, while the proportion of acres planted with soybeans sits about 1% above the long-term average at 28%.

Line chart shows the number of acres planted to corn, soybeans and wheat annually from 15/16 to 24/25.

The combined area planted with corn, soy, and wheat decreased by 2% to 224 million acres (90.6 million hectares), down from the near-record 228.1 million acres (92.3 million hectares) from the previous year. Even so, the share of acreage planted with corn, soybeans, and wheat remains in line with the five- and ten-year averages. Source: USDA Prospective Planting s Report

Stocks: Up But Still Tight

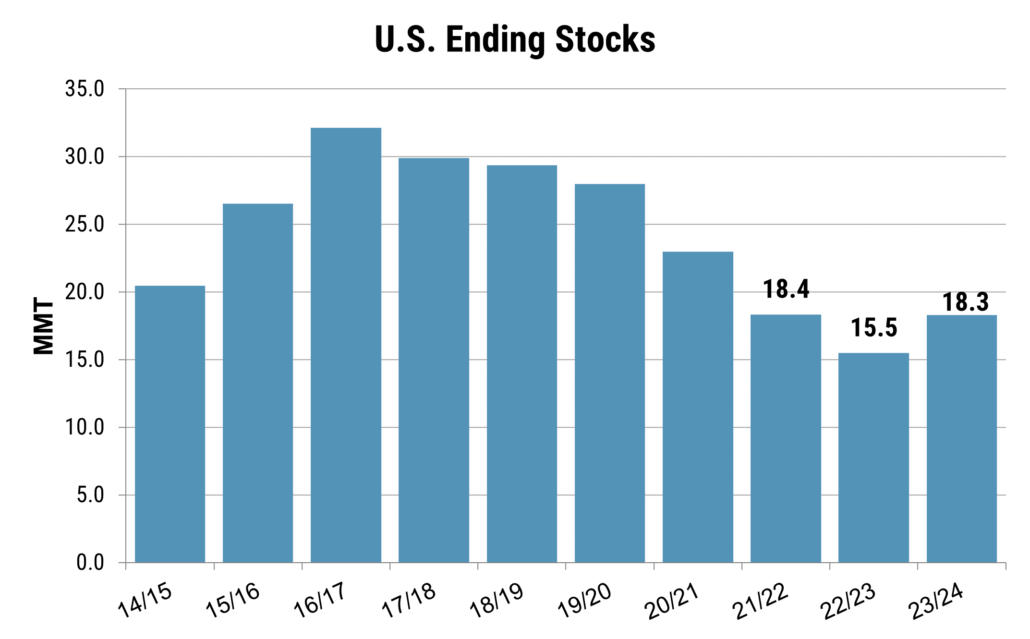
Also released on March 28, the quarterly USDA Grain Stocks report put total wheat stocks at 29.6 MMT, as of March 1. On-farm stocks were estimated at 7.4 MMT, up 16% from last year, while off-farm stocks came in at 22.2 MMT, up 14% from the year prior. The increased stock levels bolster USDA’s ending stocks estimate of 18.3 MMT, marking an 18% rise from 2023/24 and the first increase since 2015/16. Increased ending stocks helps relieve short term pressure on the U.S. balance sheet.

Moreover, even as planted area is forecast to decrease, the prospects for increased yields and greater wheat production are optimistic as drought conditions improve across the U.S. Southern Plains. The first USDA Crop Progress report of the year indicates that 56% of winter wheat is in good to excellent condition, a significant improvement from 28% at the same time last year. Increased production will help loosen the U.S. balance sheet and diminish supply related price pressures.

Bar chart shows the annual U.S. wheat ending stocks level from 14/15 to 23/24.

On-farm stocks were estimated at 7.4 MMT, up 16% from last year, while off-farm stocks came in at 22.2 MMT, up 14% from last year. The increased stock levels help confirm higher ending stocks for 2023/24. As exports remain lackluster and domestic demand steady, the USDA ending stocks are expected to grow 18% to 18.3 MMT. Source: World Agricultural Supply and Demand Estimates

Nevertheless, underlying tightness remains. U.S. stocks still sit at one of the lowest levels since 2013/14, and with global wheat consumption surpassing production, the global stocks-to-use ratio (excluding China) has dropped to 20%, the lowest point since the 2007/08 season.

More to Come

With a looser balance sheet in the short term tempered by decreased acres, the recent 2024 crop reports provided a mixed sentiment. It is also important to note that USDA’s estimates are based on surveys of U.S. farmers current intensions and may be subject to change as planting ramps up in the coming weeks. With spring wheat planting only 1% completed and winter wheat 4% headed, a definitive statement regarding the 2024 crop is yet to be written.

Moving forward, the May 2024 World Agricultural Supply and Demand Estimates (WASDE) will provide further insights into the 2024/25 marketing year and the July 2024 WASDE will give the initial by-class wheat production estimates. Also, make sure to follow the weekly and monthly reports from USW and USDA on crop conditions, harvest, and production. As always, U.S. Wheat Associates remains committed to offering information and support as we transition into the 2024/25 marketing year.

By USW Market Analyst Tyllor Ledford.

thumbnail

As March begins, world wheat markets look to new information that may provide a glimpse into what the 2024/25 marketing year brings. As northern hemisphere winter wheat crops break dormancy, weather becomes increasingly important. Meanwhile, southern hemisphere farmers shift their focus to spring crops and the winter wheat planting season.

While world crop updates will help provide a snapshot of global wheat production and latest conditions over the next few months, U.S. Wheat Associates (USW) is taking this early look at how the 2024/25 world wheat crop is shaping up.

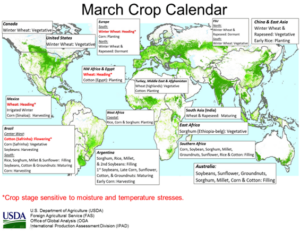
USDA world map showing the current state of major crops around the world including world wheat.

In March, much of the world wheat crop will enter its vegetative state in the northern hemisphere. Although, it is not as sensitive to heat and temperature stress in this stage, conditions can still influence the crop’s yield potential. Source: USDA Monthly Crop Stage Calendar.

Southern Hemisphere

The southern hemisphere planting program generally begins in April and continues through August, with harvest occurring between October and February, depending on the specific latitude. For marketing year 2023/24, the harvest is complete, with near-final production numbers available for major wheat-producing. Over the last month, Australia and Argentina have benefited from scattered showers and warm weather, boosting yield potential for summer crops, and helping replenish soil moisture for winter wheat planting. Looking ahead, weather analysts predict the potential for a rapid transition from an El Niño weather pattern to a La Niña event between June and August, which will impact weather patterns in the latter half of 2024.

This interactive image shows the predicted transition from an El Nino to La Nina global weather phenomenon that will impact world wheat production.

Climate models anticipate that the El Niño weather event will dissipate between April and June, with potential for a rapid transition into another La Niña weather cycle, influencing the 2024/25 wheat crop in the southern hemisphere. Source: NOAA.

Argentina – The 2023/24 wheat harvest is complete in Argentina, with USDA production estimates at 15.5 MMT, up 3.0 MMT from the previous year. Production is much improved from drought the year prior, though it still sits 12% below the five-year average.

Australia – USDA put Australian wheat production at 25.5 MMT, while the Australian Bureau of Agricultural and Resource Economics (ABARES) estimate was 26.0 MMT for 2023/24. ABARES projected that the 2024/25 harvest may reach upwards of 28.4 MMT due to increased precipitation expected from the transition into a La Niña weather pattern.

Northern Hemisphere

Due to the large geographic area and delineation between winter and spring wheat, northern hemisphere crop calendars vary significantly by region. Winter wheat is generally planted between September and November, while harvest runs from the south to the north from through September. Spring wheat planting typically begins in April and wraps up in June, while harvest can start in July and finish in September. Although the region is geographically diverse, recent weather has been relatively mild across the northern hemisphere; however, winterkill remains a concern in areas with low snow coverage following a cold snap in January.

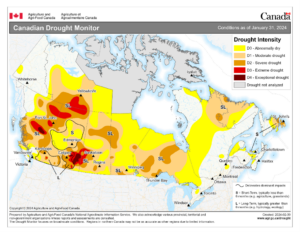
Canada– The Canadian Grain Commission puts 2024 production at 33.9 MMT. Despite a decrease in acreage from 10.9 million hectares to 10.7 million hectares, the commission expects production to increase on normalized weather and alleviated drought pressure. However, moisture deficits remain in the wheat-producing provinces of Alberta and Saskatchewan. Much of the crop has not yet been planted, but Statistics Canada will release its crop intentions report on March 11.

This map of Canada shows current drought conditions as of Jan. 31, 2024.

Long term moisture deficits persist in some of the wheat producing regions of Alberta and Saskatchewan after the drought in 2023/24, a factor to watch moving into 2024 harvest. Source: Canadian Grain Commission.

United States – For harvest in 2024, USDA forecasts total winter and spring wheat planted area at 47.0 million acres (116.1 million hectares), down from 49.6 million acres (122.5 million hectares) in 2023. The USDA Prospective Plantings Report on March 31 will provide additional insight into U.S. wheat plantings. The USDA Grains and Cereals Outlook put U.S. 2024/25 production at 51.7 MMT. Weather remains generally warm in the U.S. Plains, helping winter wheat transition from dormancy.

EU – The EU planted area sits at a four-year low, down 3% to 23.3 million hectares. Wet fall weather inhibited some farmer’s ability to plant in France, Germany, and Poland. Some private analysts have 2024/25 EU production estimates at 142.3 MMT. The weather has been warm and dry in western Europe, contrasting cool and wet weather in the east.

Russia – Private analysts forecast Russian production at 87.7 MMT for 2024/25, while Russian government analysts put output at upwards of 93.0 MMT. Mild weather and above-average precipitation have prevailed across much of Russia, although a cold snap may have slowed crop development in the Volga region.

Ukraine – Similar to Russia, the weather has been warm, accelerating winter wheat transition from dormancy. Estimates are Ukraine has planted approximately 4.2 million hectares for the 2024 harvest, down from 4.4 million hectares last year.

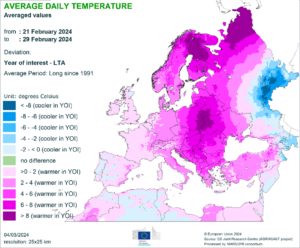
This map of Europe, North Africa, and western Russia indicates temperatures in February 2024 were generally warmer than normal with effect on world wheat production.

Weather has been warmer than normal throughout Europe, accelerating crop development and aiding in spring fieldwork. Source: JRC MARS.

Today’s recap is only a snapshot of the current world wheat situation, which will change as the 2024/25 crop develops and enters different stages of production. As always, weather will ultimately dictate where final production numbers will land. Until then, buyers can look to U.S. Wheat Associates and its state wheat commission members for up-to-date information on crop conditions, weather, and the global supply and demand situation.

By USW Market Analyst Tyllor Ledford


thumbnail

News and Information from Around the Wheat Industry


Speaking of Wheat

“Locks and dams on the Lower Snake River and the Columbia River provide essential infrastructure for moving U.S.-grown wheat to high-value markets around the world. We cannot overstate the positive value they create for U.S. farms, [the] economy of the Pacific Northwest and far beyond.” – From USW letter to House subcommittee hearing on the Columbia Snake River System

Happy Chinese New Year!

The U.S. Wheat Associates (USW) Beijing office sent the digital “Happy Chinese New Year” card at the top of the page. We all hope “The Year of the Dragon” is safe and prosperous for the U.S. friends we represent, for our customers, and for our USW colleagues!

Past Chair Brian O’Toole Honored

Brian O’Toole, a past USW chairman and a partner in the sixth-generation T.E. O’Toole Farms has been named to the North Dakota Agricultural Hall of Fame. O’Toole served for 12 years on the North Dakota Wheat Commission, chaired the North Dakota Crop Improvement and Seed Association. He served for 16 years at the Wheat Marketing Center in Portland, Ore. During his years of service, O’Toole promoted North Dakota and U.S. wheat on trade missions to 23 countries. He has received Outstanding Young Farmer, Master Farmer, and Premier Seed Grower Awards. Congratulations, Brian, and thank you for your service! Read more here.

Brian O'Toole with Japan Flour Millers Association member.

Then USW Chairman Brian O’Toole presented this gift from U.S. wheat farmers to the Japan Flour Millers Association in 2015.

Winter Wheat Serves Conservation and Food Security

Kansas Wheat shared information about the National Association of Wheat Growers (NAWG) is advocating to officially classify intentionally seeded winter wheat as a “cover crop” under USDA’s Natural Resources Conservation Service (NRCS) and other “climate-smart” programs, while not impacting its eligibility as a harvestable cash crop insurable through federal programs. “Climate-smart” activities like cover crops help farmers continue to be the best stewards of their lands, but winter wheat has been overlooked as a vital tool in both conservation and food security.

NAWG Recruiting Communications Professional

The National Association of Wheat Growers (NAWG) has a job opening for Director of Communications and Partnerships. The position’s main role is to oversee all media requests, publish the weekly newsletter and monthly podcast, communicate conference responsibilities, and help cultivate industry partnerships. Applications need to be submitted to [email protected] by Feb. 14, 2024.

February Cereal Sciences Events Calendar

Dr. M. Hikmet Boyacioglu of KPM Analytics compiles a listing of noteworthy worldwide conferences, expos, symposiums, and other events for the grains, milling, and baking industries. Visit https://lp.kpmanalytics.com/en-us/cerealgrain-science-event-calendar to download the February calendar and future posts.

NCI Announces Leadership Changes

The Northern Crops Institute (NCI) named Technical Manager David Boehm and Program Development Manager Dr. Casey Peterson as interim co-directors. The two will fill the role of Mark Jirik, who announced in December that he would step down after nearly six years heading the institute. The NCI and NDSU will begin their search for a permanent NCI director this spring. The change in leadership comes as the NCI is preparing to move into its new home at the Peltier Complex on the campus of North Dakota State University. The NCI and NDSU will begin their search for a permanent NCI director this spring. “Both David and Casey know the organization very well and will do a great job of leading the organization until a national search can be concluded,” said Matt Swenson, vice chair of the Northern Crops Council, a member of the North Dakota Oilseed Council and member of the interim search committee. 

U.S. Miller Supports Soft Red Winter Wheat Development

U.S. Wheat was pleased to participate in the “Double Crop Farmers’ Forum” sponsored by the Illinois Wheat Association and the Illinois Soybean Association Feb. 5, 2024. At the meeting, the University of Illinois College of Agricultural, Consumer and Environmental Sciences announced that Siemer Milling Company, Teutopolis, IL, made a major gift to the college’s Department of Crop Sciences to, in part, fund an endowed chair in wheat breeding. Professor Jessica Rutkowski, the University wheat breeder, will be the first to hold this chair. Illinois farmers annually produce more soft red winter wheat than any other state. To see how Siemer Milling ensures the highest quality wheat for its grist, watch this video.

Group of people in front of a large room.

Announcing the Siemer Milling Company gift at the Double Crop Farmers’ Forum in Mt. Vernon, Ill., were (left to right) University of Illinois Dean Germán Bollero, Crop Sciences Department Head Adam Davis, President Richard Siemer, Siemer Milling Company, and Professor Jessica Rutkowski, small grains breeder and quantitative geneticist, who will hold the first Siemer Milling Company Professorship.

thumbnail

Drought in major U.S. wheat-growing regions over the past few years is well-documented. The persistent dry conditions acutely impacted U.S. wheat yield and increased abandonment, with 2023/24 production coming in 6% below the pre-drought five-year average. Now, entering the second half of the marketing year, the focus has shifted to the 2024 harvest and its impact on both U.S. and global supply and demand. Although it is early, optimism has begun to bloom for the 2024 winter wheat harvest, and the following highlights the factors that have helped boost the U.S. wheat outlook.

Acreage Down, But Conditions Improved

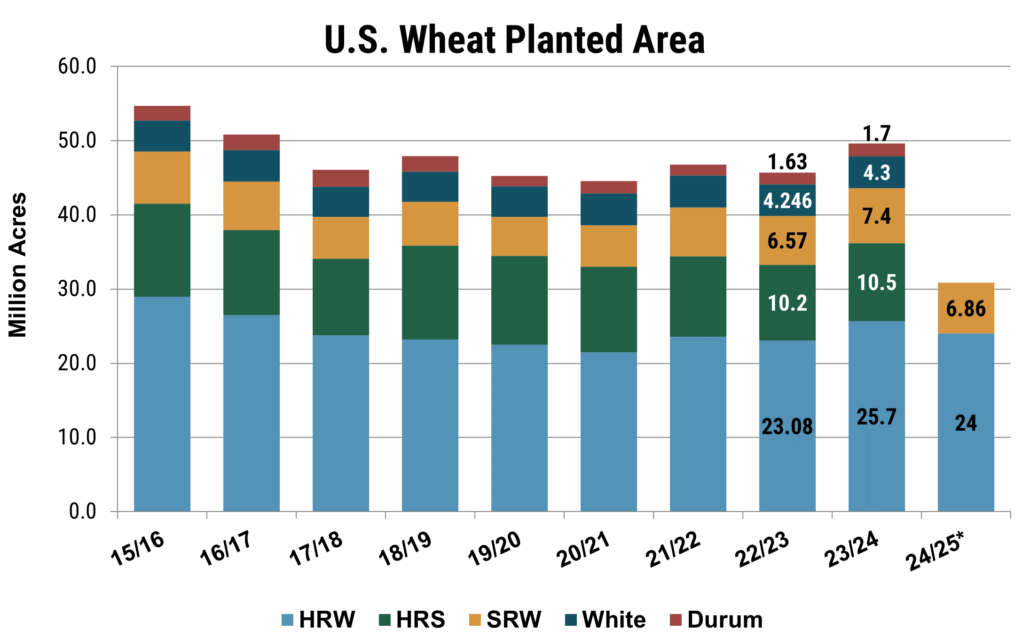
The Winter Wheat and Canola Seedings Report, published on Jan. 12, put the preliminary winter wheat acreage at 34.4 million acres (m.a.) (34.3 million hectares), down 6% from 2023 but still 4% ahead of the five-year average. The hard red winter (HRW) wheat area is estimated at 24.0 m.a. (9.7 million hectares), down 5% on the year, while the soft red winter (SRW) area is approximately 6.89 m.a. (2.8 million hectares), a 7% decrease. The white winter wheat (including soft white and hard white winter) area came in at 3.5 m.a. (1.4 million hectares). Desert Durum® seedings in Arizona and California for the 2024 harvest are estimated at 65,000 acres (26,300 hectares) total, up 16% from 2023 and 48% below 2022.

This bar chart shows U.S. wheat planted area by class between 2013/14 to 2023/24.

According to the Winter Wheat and Canola Seedings Report, published on Jan. 12, the winter wheat acreage is estimated at 34.4 m.a., down 6% from 2023 but still 4% ahead of the five-year average. The HRW area is estimated at 24.0 m.a., SRW at 6.89 ma, and the white winter wheat area came in at 3.5 m.a. Desert Durum® seedings in Arizona and California are estimated at a combined 65,000 acres. Source: USDA Winter Wheat and Canola Seedings Report.
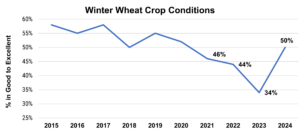
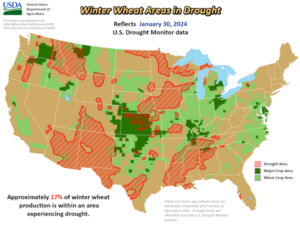
Moving toward fall of 2023, moisture helped replenish dry soil in the U.S. Southern Plains, aided planting, and supported early-season growth and emergence, while making visible improvements in the U.S. Drought Monitor. According to USDA, as of Jan. 30, 2024, winter wheat area in drought registered at 17%, down from 22% the week prior and 58% last year. Meanwhile, the last aggregate USDA Crop Progress Report, published on Nov. 27, 2023, put 50% of winter wheat in the good to excellent category, the highest since 2020.

This line chart shows the percentages of U.S. winter wheat rated "good to excellent" from 2015 to 2024.

The last national USDA Crop Progress Report put 50% of the U.S. winter wheat crop in good to excellent condition, the highest since 2020. Source: USDA NASS Data.

Despite the decreased acreage, the cautious optimism about wheat conditions suggests the potential for improved yield and reduced abandonment for the 2024 harvest. Improved yields will provide a welcome boost to U.S. wheat production, helping improve supply and relieving pressure on the U.S. balance sheet and wheat prices.

An Early State-by-State Snapshot

Comments from producers at a recent meeting of the U.S. Wheat Associates (USW) Wheat Quality Committee echoed the optimistic sentiment. However, despite the objectively improved crop outlook from the year prior, winter conditions have started to vary as the season progresses, serving as a reminder that much can change before harvest time.

Following are condition recaps in major winter wheat-producing states from committee members and National Agricultural Statistics Service (NASS) data as of Jan. 28:

Kansas. Data from NASS rates 54% of Kansas winter wheat good to excellent, and optimism has bloomed regarding the 2024 harvest. Kansas wheat farmer and USW Secretary-Treasurer elect Gary Millershaski highlighted visible improvements to wheat stands compared to the previous year.

Texas. NASS data put Texas wheat conditions at 42% good to excellent, while Texas farmers remain optimistic about current conditions.

Oklahoma. An Oklahoma farmer commented that soil moisture remains adequate, and the wheat entered dormancy in good condition. Oklahoma crop conditions rated 63% of the crop in the good to excellent category.

Colorado. About 61% of the crop sits in the good to excellent category, though winds and dry weather this winter may cause some condition deterioration.

Nebraska. According to a Nebraska farmer, rain during planting helped boost conditions, and the stands continue to benefit from the soil moisture. Current conditions put Nebraska winter wheat at 69% good to excellent.

South Dakota. South Dakota Wheat Commission CEO Jon Kleinjan commented that the state’s HRW wheat was seeded with adequate moisture. As good snow cover remains, he is optimistic about the 2024 crop. Likewise, NASS put 53% of winter wheat in good to excellent.

Montana. Approximately 41% of the HRW crop sits in the good category; however, cold and a lack of snow coverage have negatively impacted crop conditions this winter.

USDA/NOAA Map of Winter Wheat in Drought from Jan. 30, 2024.

According to the weekly USDA Agriculture in Drought Report, as of Jan. 30, 2024, 17% of U.S. winter wheat resides in areas experiencing drought, down from 22% last week and much improved from 58% last year. Source: U.S. Agriculture in Drought.

More Data to Come

The upcoming USDA Prospective Plantings Report will provide preliminary estimates for spring wheat, durum, and the white spring wheat area and update the winter wheat estimates. It is important to remember that the 2024 harvest is still months away, and conditions can and will change as the crop year progresses. Nonetheless, even after an extended drought, U.S. wheat farmers remain resilient and committed to growing a reliable supply of high-quality wheat for their customers around the world.

By USW Market Analyst Tyllor Ledford

thumbnail

Kitchen table math can be a chore this time of year, as U.S. wheat farmers shovel their crop production costs into calculators, hoping the numbers they scoop out next year will be magically heavier than those they tossed in this year.

But here’s a secret about the math of farming: it isn’t really magic.

“There’s a lot of work and a lot of luck involved in making a profit in our business,” is how U.S. Wheat Associates Chairman Michael Peters put it. “The numbers are rarely where you need them to be or where you want them to be.”

An important thing for customers of U.S. wheat to keep in mind is that input costs and the prices farmers receive for their crops each year go a long way toward determining which crops farmers choose to plant the next year.

“The goals of a U.S. farmer are to help feed the world and to also feed our own families,” said Peters, who grows wheat and raises beef cattle in Oklahoma. “We make a lot of decisions each year based on market conditions and expenses. And those are two things that tend to go up and down a lot. They are never stagnant.”

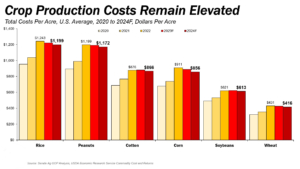
This chart by USDA shows the average cost per acre to produce crops in the U.S. between 2020 and 2024. According to USDA, among the major field crops, the cost-of-production for wheat is forecast to be the lowest at $416 per acre, down 2.3%.

This chart by USDA shows the average cost per acre to produce crops in the U.S. between 2020 and 2024. According to USDA, among the major field crops, the cost-of-production for wheat is forecast to be the lowest at $416 per acre, down 2.3%.

Farming’s ‘Reality’ Math

Although 2023 input costs have been, in general, mostly lower than the costs wheat farmers endured a year ago, a profitable 2024 is far from guaranteed. While crop production expenses have fallen a bit and are expected to remain lower compared to last year’s cycle, commodity prices – including the prices paid to farmers for their wheat – are also forecasted to be lower.

That’s farming’s reality math.

Wheat prices have declined about 27% since the start of 2023, according to Rabobank, and now trades at levels well below those seen before the war in Ukraine began in early 2022. Lower wheat prices are attributed mostly to strong Russian wheat production and a pattern of opportunistic import purchases.

Despite lower prices, farmers appear committed to putting wheat in the ground. In its most recent forecast, USDA put the planted area for wheat that will be harvested in 2024 at 48 million acres, which would be down 1.2 million acres from the 49.6 million acres in 2023 but above the 5-year average of 46.4 million acres.

In general, the cost of putting wheat seed into the ground in 2023 saw a slight decline in many parts of the country, as fertilizer and fuel costs dropped after spiking the past two years. However, wheat prices also fell, cutting into potential farmer profits.

In general, the cost of putting wheat seed into the ground in 2023 saw a slight decline in many parts of the country, as fertilizer and fuel costs dropped after spiking the past two years. However, wheat prices also fell, cutting into potential farmer profits.

Better and Worse

In mid-2024, USDA’s Economic Research Service released a cost-of-production forecast for major field crops that included updated projections for 2023 costs and the first look at estimated production expenses for 2024. Notably, input costs for the 2024 growing season are expected to be the third-highest all-time, behind only 2022’s record-high and 2023’s second-all-time high.

The slight downward trend in input costs does hold some promise, farmers say.

“Chemical prices are probably half of what they were and fertilizer prices are down 30% to 40%, maybe 50% in some cases, depending on the product,” said North Dakota wheat farmer and USW Secretary-Treasurer Jim Pellman. “Fuel prices have moderated a little bit. So generally, major inputs have reduced the last couple of years. But at the same time, you’re seeing lower prices. The best-case scenario for a farmer is low inputs and high grain prices. The worst-case scenario is high inputs and low prices. We are not seeing either of those right now. So it could be better, but it could be worse.”

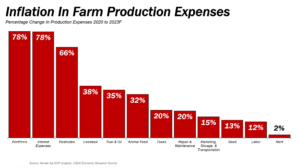
This chart provided by USDA shows the percentage change in farm production expenses between 2020 and 2023.

This chart provided by USDA shows the percentage change in farm production expenses between 2020 and 2023.

Some Hope for Wheat Growers?

While input costs remain relatively high, according to USDA, among the major field crops, the cost-of-production for wheat is forecast to be the lowest at $416 per acre, down 2.3%. Yet challenges remain.

“Describing the last three years of global agricultural commodity prices as volatile is an understatement,” said Carlos Mera, head of agri-commodities at Rabobank. “Producers are still grappling with the after-effects of war, adverse weather, high farm input inflation and weak consumer demand, but eyeing 2024 as the return to a semblance of normality.”

Winners and Losers

Rabobank predicts that prices wheat will remain subject to weather and export-related uncertainty, as it has for several years now.

“Winners and losers will emerge as agricultural commodities go through different points of the cycle next year,” Mera said.

For wheat, Rabobank expects another supply deficit in the global market. There will be little relief from the Southern Hemisphere crops in the coming months, with both Argentina and Australia underperforming. El Niño could leave fields in Australia with little moisture ahead of the 2024 planting season, according to Rabobank.

U.S. wheat farmers have been through these kinds of up-and-down supply and demand cycles before. They do their best to make planting decisions based on the best information they have in the fall and spring each year.

“The difficult part for a farmer is that we have to make our planting plans far in advance, well before we know exactly what the market is going to be like at harvest time,” explained Pellman. “We can’t predict the weather, either. That’s our world. But, we are still able to produce a high-quality crop every year.”

thumbnail

The 2023 U.S. hard red spring (HRS) crop was produced under a wide range of growing conditions. A late spring delayed planting but the early moisture helped establish the crop. Then conditions across the region turned hot and dry with only spotty areas of rain. The rain returned and delayed mid- to late-harvest. Ultimately, total production reached 12.7 million metric tons (MMT), 14% more than in 2022.

U.S. Wheat Associates (USW) reports hard red spring quality highlights for three export locations. First is for HRS from the western region that supplies export facilities in the Pacific Northwest (PNW). Quality data for HRS that moves from the eastern region to the Gulf of Mexico and to the Great Lakes are reported together. The complete 2023 USW Crop Quality Report and detailed by-class reports are being produced now and will be posted online over the next few weeks.

Close up photo of hard red spring wheat kernels.

2023 HRS PNW-Exportable Overview and Highlights

The 2023 U.S. hard red spring (HRS) wheat crop grown in the western (PNW-exportable) region offers strong grading characteristics, good protein content, typical dough strength, and improved bake parameters compared to recent years. 

The average grade for the 2023 PNW-exportable HRS harvest survey is U.S. No. 1 Northern Spring (NS), with 84% of samples grading U.S. No. 1.

Average test weight is 60.7 lb/bu (79.8 kg/hl).

The PNW-exportable crop has lower VITREOUS KERNEL (DHV) content, averaging 61% compared to 88% in 2022 and 84% for a 5-year average.

Wheat protein averages 14.1% (12% mb), below 2022 and the 5-year average. Distribution of protein is 32% below 13.5% protein and 40% above 14.5% protein.

Average 1000 kernel weight (TKW) is 32.1 g, well above 2022 and the 5-year average.

Buhler Laboratory Mill flour yield averages 66.7%, above 2022 and the 5-year average. Lab mill settings are not adjusted to account for kernel parameter shifts between crop years. The extraction is calculated on a tempered wheat basis.

Average flour ash is 0.48%, lower than last year and the 5-year average.

Wet gluten averages 32.4%, lower than 2022 and the 5-year average.

Amylograph average of 639 BU is much lower than 2022 and lower than the 5-year average, reflective of isolated areas with harvest rains.

Dough properties suggest a crop that exhibits strong characteristics with greater extensibility, compared to 2022 and the 5-year average.

Farinograph peak and stability times of 7.6 and 12.2 min, respectively, indicate the PNW-exportable crop is similar to 2022 and the 5-year average. Absorption values average 62.8%, down from 2022 and the 5-year average.

The average Alveograph P/L ratio is 0.68 compared to 0.74 in 2022, and the W-value is 384 (10-4 J), down from 396 last year.

The overall extensibility and resistance to extension of the 135-min Extensograph are 13.4 cm and 1001 BU, compared to 12.9 cm and 927 BU last year indicating slightly stronger, yet more extensible dough properties compared to last year.

The average loaf volume is 993 cc, above 940 cc in 2022, and 962 for a 5-year average.

Average bake absorption is 65.4%, lower than 2022 and the 5-year average.

2023 Gulf/Great Lakes-Exportable Overview and Highlights

The 2023 U.S. hard red spring crop grown in the eastern (Gulf/Great Lakes-exportable) region offers a nice balance of protein, strong dough characteristics and very good bake parameters. Overall, this is a highly functional crop.

The average grade is U.S. No. 1 Northern Spring (NS), with 95% of samples grading U.S. No. 1.

Average test weight is 61.7 lb/bu (81.2 kg/hl), lower than 2022 but similar to the 5-year average.

Average vitreous kernel (DHV) content is 44%, lower than last year’s 59% and the 5-year average of 65% due to late-season rain.

Wheat protein averages 14.3% (12% mb) with 21% of the surveyed crop below 13.5%, and 42% above 14.5%.

Average 1000 kernel weight (TKW) is 36.6 g, well above 2022 and the 5-year average.

Buhler Laboratory Mill flour yield averages 66.8, above 2022 but below the 5-year average. Lab mill settings are not adjusted to account for kernel parameter shifts between crop years. The extraction is calculated on a tempered wheat basis.

Average flour ash is 0.47%, similar to 2002, and lower than the 5-year average of 0.51%.

Wet gluten averages 33.2%, slightly lower than 2022 and the 5-year average.

Amylograph average of 566 BU is down from 2022 but similar to the 5-year average.

Dough properties suggest a stronger, slightly less extensible crop as compared to last year and the 5-year average.

Farinograph peak and stability times of 8.2 and 16.1 minutes respectively indicate the Gulf/Great Lakes-exportable crop is much stronger than average. Absorption values average 62.1%, down slightly from 2022, and similar to the 5-year average.

The average Alveograph P/L ratio is 0.78 compared to 0.63 for the 5-year average, and the W-value is 411 (10-4 J), compared to 388 for the 5-year average.

The overall extensibility and resistance to extension of the 135-min Extensograph are 14.0 cm and 1171 BU, compared to 15.6 cm and 743 BU last year indicating stronger, less extensible dough properties.

The average loaf volume is 971 cc, higher than 2022, and similar to the 5-year average.

Average bake absorption is 63.8%, significantly lower than 2022, and lower than the 5-year average.

thumbnail

The 2023 U.S. hard red winter (HRW) growing season saw a mixed bag of conditions from another severe drought in the southern and central Great Plains to nearly ideal rain and temperatures in the northern plains and Pacific Northwest (PNW).

Total production, while still quite low historically, reached 16.4 million metric tons (MMT), a 13% increase from 2022. As for functional qualities, this is a sound crop that meets or exceeds typical HRW contract specifications and should provide high value to customers.

U.S. Wheat Associates (USW) reports hard red winter quality highlights for HRW grown in regions that supply feed into export facilities in the Gulf of Mexico and for export facilities in the PNW. The complete 2023 USW Crop Quality Report and detailed by-class reports are being produced now and will be posted online over the next few weeks.

Gulf-Exportable Hard Red Winter Crop Highlights

The average grade is U.S. No. 2 HRW with 84% of the crop grading No. 2 or better.

Test weights trended lower this year with an overall average of 59.7 lb/bu (78.6 kg/hl).

Kernel data indicate uniform and dense kernels with 69% exhibiting large size, a much higher level than in previous years.

Protein content average is 12.9% (12% mb), with 63% of Gulf samples 12.5% or higher.

Alveograph W average value of 260 (10-4 J) is exceptionally high for dough strength and an L value of 110 (mm) indicates very good extensibility.

Farinograph peak and stability averages of 4.9 and 8.9 minutes, respectively, are well within industry target ranges.

Average bake absorption is 64.6%, significantly higher than the 5-year average.

Average loaf volume is 936 cc, comparable to last year and indicative of excellent baking quality.

PNW-Exportable Hard Red Winter Crop Highlights

The average grade for the 2023 PNW-exportable crop is U.S. No. 1 HRW with 81% of samples grading No. 1 and 93% grading No. 2 or better.

PNW test weights trended slightly lower this year with an overall average of 60.7 lb/bu (79.8 kg/hl).

Protein content average is 11.8% (12% mb) with 59% of the crop 11.5% or higher.

Wheat moisture average is 10.4%, adding additional value for milling customers.

Kernel data indicate uniform and dense kernels with 69% exhibiting large size, which is a significant increase from last year and comparable to the 5-year average.

Alveograph W values were exceptionally high for dough strength at 296 (10-4 J) and the extensibility L values are high at 95 (mm).

Dough properties suggest an acceptable crop that is comparable to the 5-year average.

Loaf volume average is 868 cc, comparable to the 5-year average and above U.S. industry targets of 850 cc.


thumbnail

“It was a challenging year,” said Oregon farmer David Brewer of the 2023 soft white (SW) wheat production season. “However, I believe that our investments into variety development and adoption of sustainable management practices have helped us ensure the best functionality from the 2023 crop.”

Seeding conditions were good in the fall of 2022 with sufficient moisture to get the soft white winter wheat crop off to a good start in the Pacific Northwest (PNW). Dryness set in just as the crop was breaking dormancy and turned hot as farmers seeded their spring SW. Hot, dry conditions persisted and accelerated maturity and harvest.

Those growing conditions affected yields, with SW production now estimated at 5.3 million metric tons (MMT) or almost 195 million bushels. That is 23% less SW than PNW farmers produced in 2022.

U.S. soft white wheat kernels

Soft white (SW) wheat.

The dry conditions also contributed to a SW crop with above-average protein. Yet, the crop has appropriately weak to medium gluten strength and acceptable or better finished product characteristics. Stocks of more typical protein SW from 2022 are also available to buyers. In addition, the higher protein SW in this crop provides opportunities in blends for crackers, Asian noodles, steamed breads, flat breads, and pan breads.

The following 2023 crop quality highlights include functional data for Club, a sub-class of SW with very weak gluten strength, typically used in a Western White blend with SW for cakes and delicate pastries.

U.S. Club wheat kernels

Club wheat.

2023 SW Crop Highlights

  • The overall average grade of the 2023 SW crop is U.S. No. 1 SW; Club average is also U.S. No. 1.
  • Test weight averages trended lower this year with an average of 60.3 lb/bu (79.3 kg/hl) for SW and 60.7 lb/bu (79.8 kg/hl) for Club.
  • Protein (12% mb) is higher this year with an average of 11.1% for SW and 10.6% for Club.
  • Falling number average is 336 sec or higher for all SW composites and 327 sec for Club.
  • Buhler Laboratory Mill average extraction for SW is 70.3%, and 72.1% for Club. Commercial mills should see better extractions, although some adjustments may be necessary for portions of the crop with lower test weights. Flour extractions should not be compared to last year or the 5-year average as the calculation has shifted from a total product weight basis to a tempered wheat weight basis.
  • Solvent Retention Capacity (SRC) lactic acid and water values for SW are 105% and 51%, respectively, indicating weak to medium gluten strength. Overall, SW composites have SRC profiles suitable for good cookie and cracker performance. Lactic acid and water SRC values for Club are 71% and 51%, respectively, and are indicative of very weak gluten with low water holding capacity.
  • Starch pasting properties include amylograph and RVA viscosities for SW and WC indicating the crop is suitable for batter-based products. The low protein SW composite average of 368 BU/2122 cP peak viscosity is reflective of a slightly lower falling number (313 sec). The overall SW and WC averages are similar to last year.
  • Soft white and Club dough properties are typical and suggest very weak to medium gluten strength and low water absorption values similar to their respective 2022 and 5-year averages.
  • Sponge cake volumes average 1089 cc for SW and 1110 cc for Club. Hardness value for SW is 353 g and 337 g for Club. All SW and Club cakes were baked from an experimentally milled straight grade flour. For comparison, control cakes baked at the same time from a commercially milled short patent cake flour (2022 harvest) have an average volume of 1205 cc and an average firmness of 242 g.
  • Cookie diameter values are 7.7 for SW and 7.9 for Club. Spread ratio for SW is 8.2 and 8.8 for Club. These values should not be compared to 2022 or the 5-year averages as the cookie method has changed as of 2023 (see analysis methods).
  • Average soft white pan bread bake absorption is 56.1% and loaf volume is 696 cc. Blends of hard wheat with up to 20% SW should produce acceptable pan breads, especially from higher protein SW.
  • Chinese southern-type steamed bread values for Club, and medium and high protein SW composites scored similar to or better than the control due to greater volume and whiter internal crumb color. Specific volume and total score averages are SW 2.7 mL/g, 70.8 and Club 2.7 mL, 70.7, respectively.
thumbnail

The 2023 U.S. wheat harvest has ended and U.S. Wheat Associates (USW) published its final weekly Harvest Report Oct. 6. This year’s first Harvest Report appeared May 19 and was published every Friday afternoon (Eastern Time) throughout the season with updates and comments on harvest progress, crop conditions for hard red winter (HRW), soft red winter (SRW), hard red spring (HRS), soft white (SW) and northern durum wheat.

#1 HAD

U.S. hard amber durum kernels.The final northern durum weekly report showed that compared to the prior week, wheat moisture increased to 11.4%, falling number increased to 416 sec and HVAC decreased from 81% to 80%. Compared to 2022, protein content, 1000-kernel weight, and percent damaged kernels were higher while falling number, test weight and shrunken and broken kernels were lower. The overall grade remained U.S. No. 1 Hard Amber Durum (HAD).

The Durum wheat Quality & Pasta Processing Laboratory at North Dakota State University is completing testing on the composites for the full northern durum regional crop quality report and USW’s 2023 Crop Quality Report.

Important Resource

Harvest Report is a key component of USW’s international technical and marketing programs as a resource that helps customers understand how the crop situation may affect basis values and export prices. USW’s overseas offices share the report with their market contacts and use it as a key resource in meetings and for answering inquiries. Several USW offices publish the report in the local language.

Anyone may subscribe to receive the Harvest Report directly to their email inbox by filling out a quick form found at this link.

The accumulated quality data gathered during the season and reported in Harvest Report builds to the annual USW Crop Quality Report coming soon. USW thanks the many partner organizations who support this work and Vice President of Programs Erica Oakley for managing these important reports.