As harvest rolls throughout the U.S. Plains, farmers see the culmination of their year’s hard work and investment as crops move from field to bin, eventually becoming products consumed worldwide. After three years of drought that reduced yields, impacted quality, and drove near-record abandonment, the 2024 harvest season stands out as the most promising in recent memory.
The following will outline current harvest progress, crop conditions, and export trends for the marketing year to date as the 2024 crop suggests production will “turn a corner” away from the challenges seen over the last three years.
A Look Back
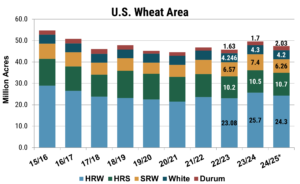
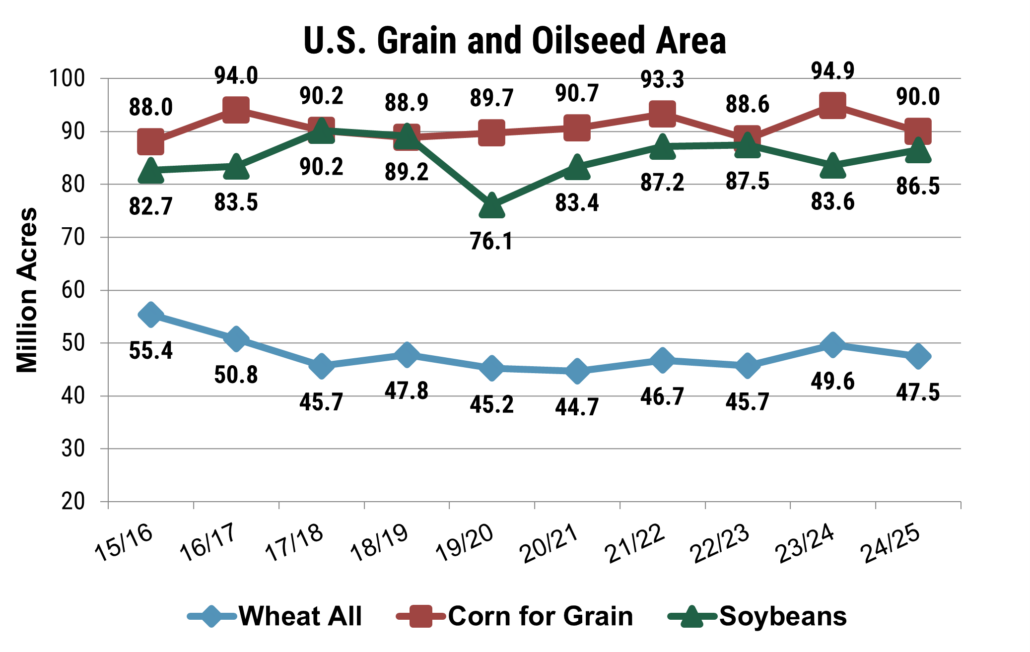
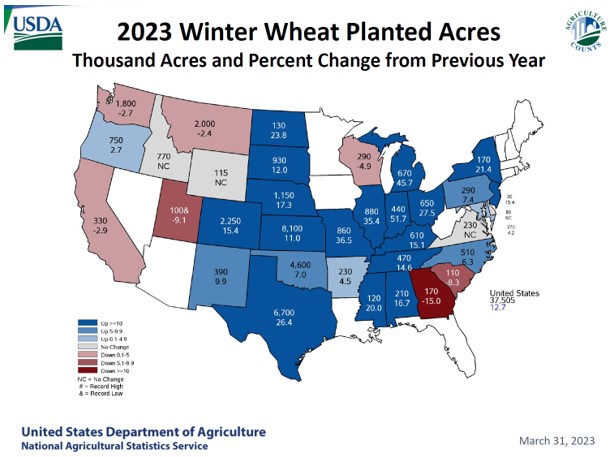
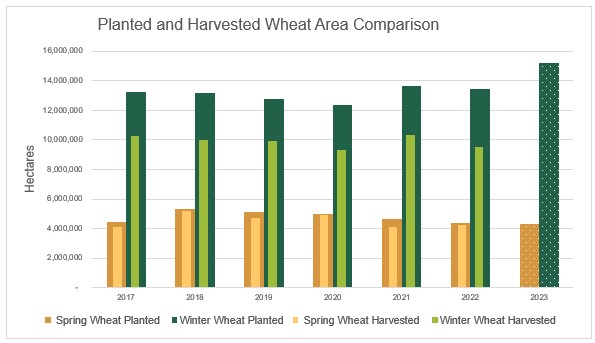
When the 2023 U.S. winter wheat crop was seeded in 2022, income potential for wheat appeared favorable, with prices still elevated by Russia’s invasion of Ukraine. As a result, total seeded wheat area for 2023 was up 8% from the prior year. With current prices falling in line, or in some cases below pre-war trends, and input prices remaining high, profit margins have tightened, placing additional pressure on farmers. As a result, 2024 wheat acres were down 5% to 47.2 million acres, nearly even with the five-year average.

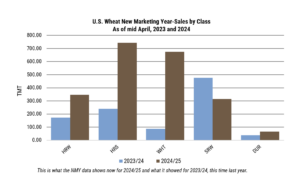
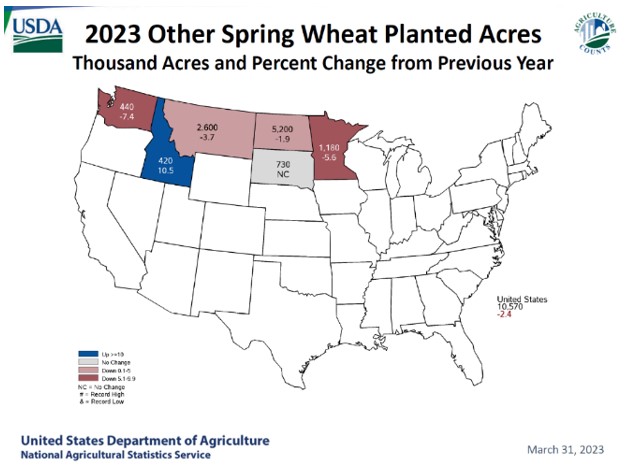
Looking at the acreage by class, the area included 24.1 million acres of HRW (down 6% year over year), 6.1 million acres of SRW (down 17%), 10.6 million acres of HRS (up 1%), 2.2 million acres of durum (up 31%), and 4.6 million acres of white wheat (up 6%). Although the 2024 wheat area is lower year over year, the July 2024 World Agricultural Supply and Demand Estimates (WASDE) put U.S. wheat production a 54.6 MMT, up 10% from the year prior on increased yields, improved weather, and good moisture. Source: July WASDE
A Current Harvest Snapshot
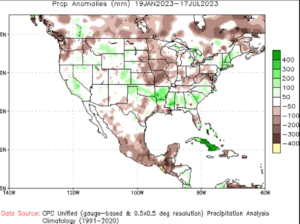
As the U.S. winter wheat harvest begins to wind down, the July 21 Crop Progress Report estimates that 76% of winter wheat is in the bin, up 11 points from the year prior and 4 points ahead of the five year average. Warm weather and improved moisture accelerated crop maturation across much of the hard red winter (HRW) growing region and the first by class estimates put HRW production at 20.8 MMT, a 27% increase from the year prior. On the other hand, soft red winter (SRW) production estimates sit at 9.4 MMT, down 23% from last year’s record yields, though still sitting 4% ahead of the five-year average.
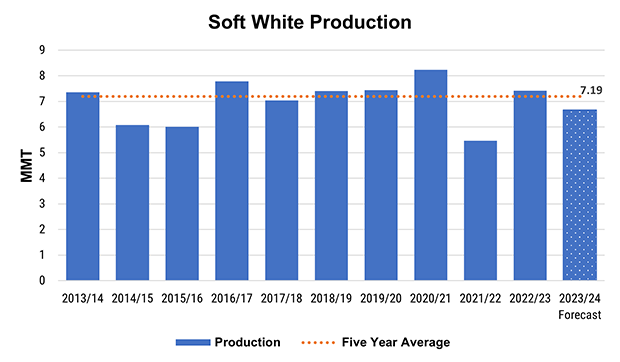
Spring wheat development remains on schedule with 89% of the crop headed, nearly even with the five-year average. As of July 21, 77% of the crop sits in good to excellent condition, up from 49% last year as rains and cool weather boost yield potential. A reflection of the good ratings, the July WASDE put hard red spring (HRS) production at 14.5 MMT and durum at 2.4 MMT, a yearly increase of 14% and 51%, respectively. For white wheat (which includes both winter and spring varieties), production estimates sit at 7.6 MMT, a 19% increase year over year.

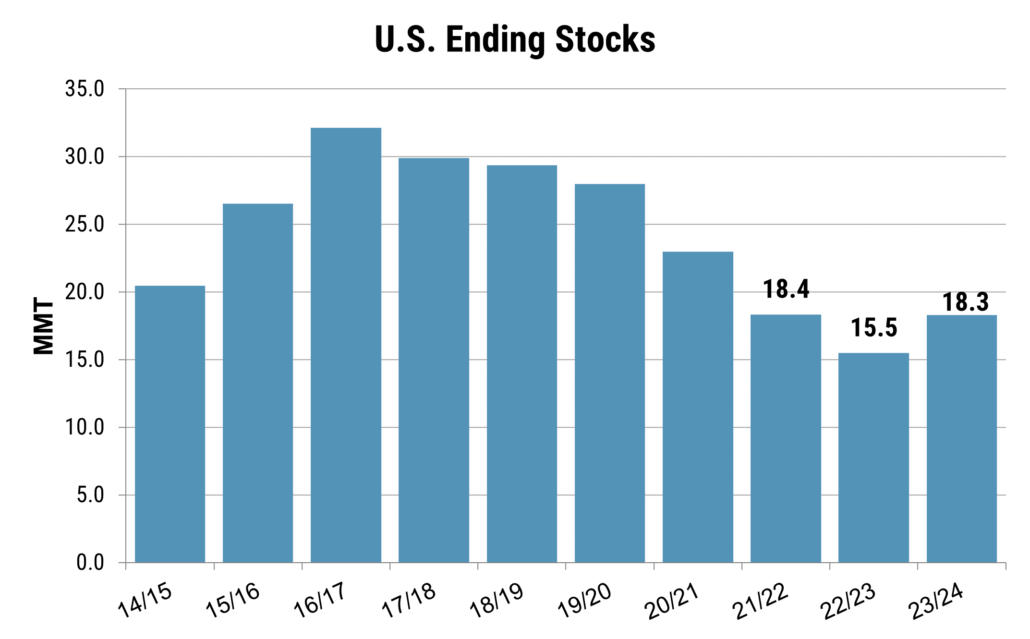
Although the 2024 wheat area is lower year over year, the July 2024 World Agricultural Supply and Demand Estimates (WASDE) put U.S. wheat production a 54.6 MMT, up 10% from the year prior on increased yields, improved weather, and good moisture. The USDA estimates also show renewed optimism for exports, with the July projections setting exports at 22.4 MMT, the highest since 2020/21, but still 15% below the pre-drought five-year average. Source: July WASDE
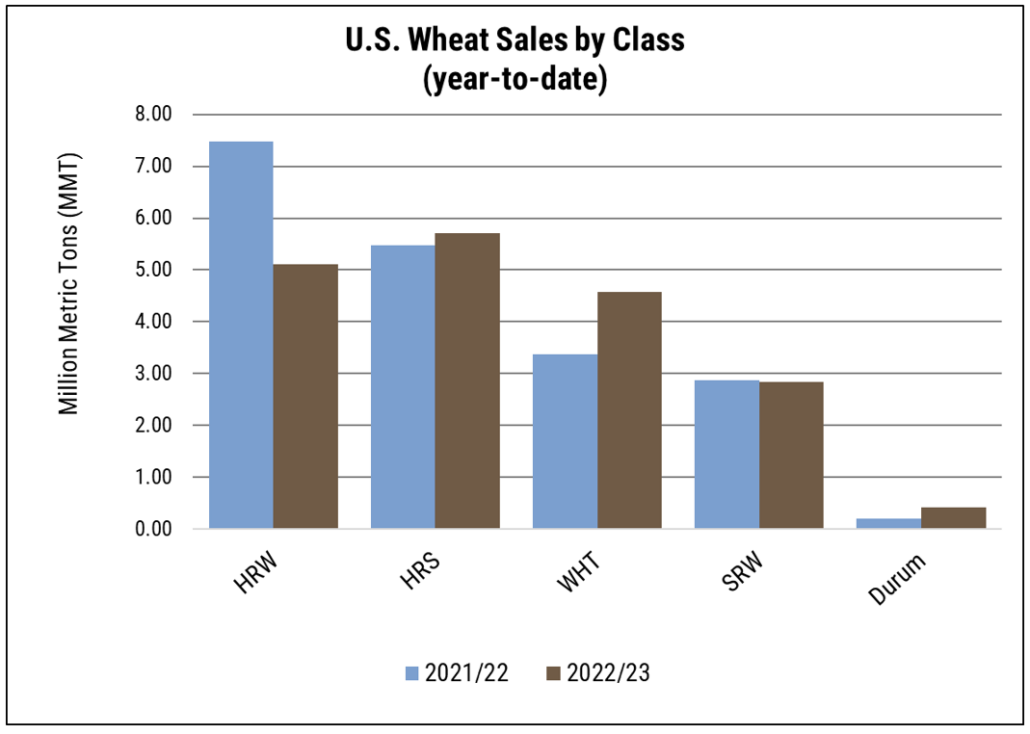
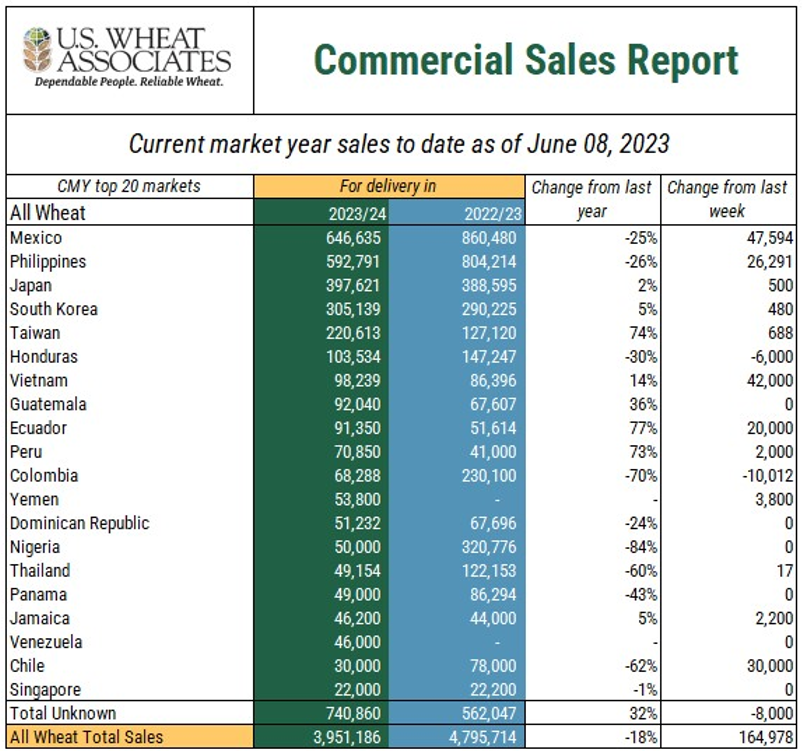
Customers Capture Value
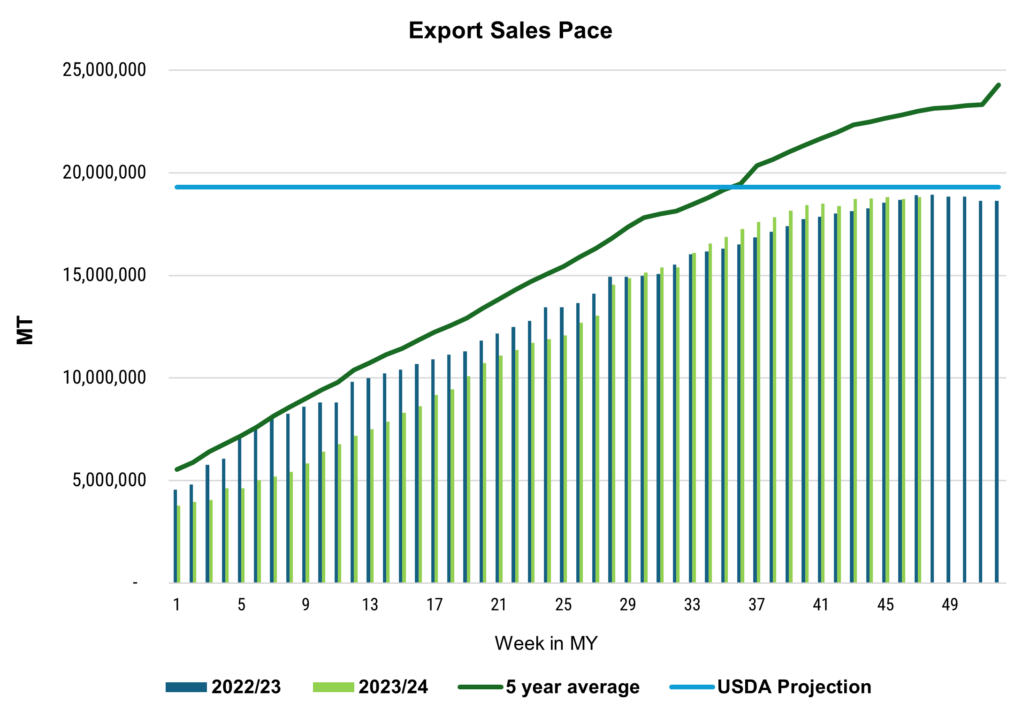
More normalized production has helped prices become more competitive in recent weeks. When U.S. wheat prices hit multi year lows in late June, buyers responded with increased purchases of U.S. wheat, peaking at 805,300 MT on June 27, 2024. Over the last month, weekly net sales averaged 576,200 MT and as of July 11, the total known outstanding sales for MY 2024/25 reached 7.7 MMT, 49% ahead of last year’s pace.

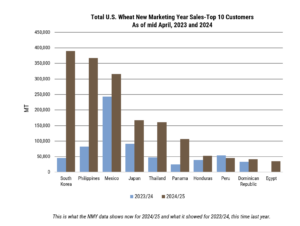
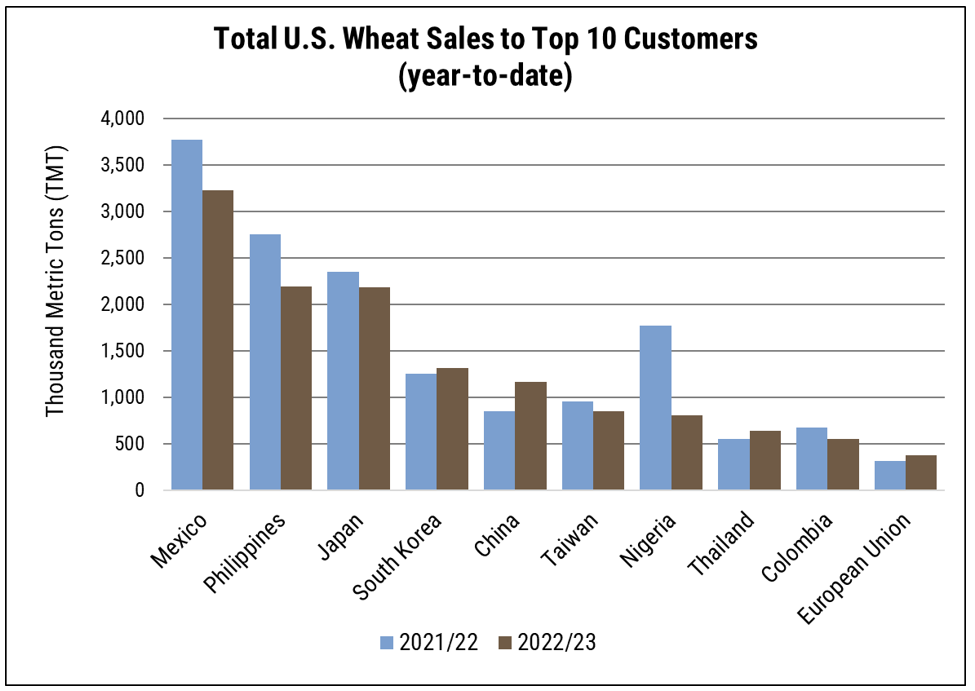
Customers worldwide have increased their purchases relative to last year, with notable increases in four of the top five U.S. wheat importers to date. Likewise, buyers in Panama, Brazil, Thailand, and Indonesia have logged additional sales, showing increase of 571%, 240%, 175%, and 273%. Source: USDA FAS Export Sales Data
Customers worldwide have increased their purchases relative to last year, with notable increases in four of the top five U.S. wheat importers to date. The USDA’s July projections reflect this renewed optimism, setting exports at 22.4 MMT, the highest since 2020/21, though still 15% below the pre-drought five-year average.
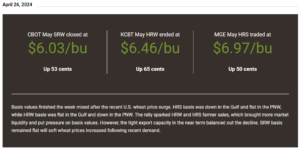
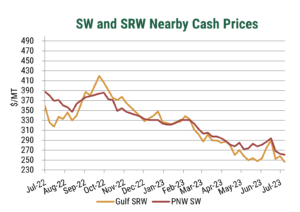
As the harvest progresses, there is an opportunity to capitalize on the value of U.S. wheat. Price spreads have narrowed and continue to align more closely with other origins. Improved production simplifies purchasing decisions, and as always, U.S. Wheat Associates is ready to help customers find the best value.