thumbnail

As the southern hemisphere wheat harvest nears completion and world anticipates the next northern crop, many buyers, mill owners, and end-product manufacturers are considering purchasing decisions that will affect their businesses into the first quarter of marketing year 2024/25. With forward thinking in mind, USDA released its latest Grains and Oilseeds Outlook on Feb. 15, providing initial projections for U.S. wheat. Though subject to change, these projections help provide a baseline for future updates and a glimpse into the issues and opportunities that may emerge as the year progresses.

Preliminary Acreage, Production, and Use Outlook

The Grains and Oilseeds Outlook projected total grains and oilseeds planted area at 225.5 million acres (91.25 million hectares), down from 227.8 million acres (92.2 million hectares) last year due to lower farm prices. USDA forecasted 2024 total wheat area at 47.0 million acres (19.0 million hectares), down from 49.6 million (20.1 million hectares) in 2023 but above the five-year average of 46.4 million (18.7 million hectares). The January Winter Wheat and Canola Seedings report estimated winter wheat area down 6% to 34.4 million acres (13.9 million hectares), leaving 12.6 million acres (5.1 million hectares) for hard red spring wheat (HRS), white spring wheat, and durum. USDA expects combined spring wheats and durum area to be slightly lower. However, private analysts and traders feel HRS acres may remain steady to slightly higher if planting conditions are favorable.

Bar chart from USDA;s 2024 outlook shows wheat harvested area over the last 10 years.

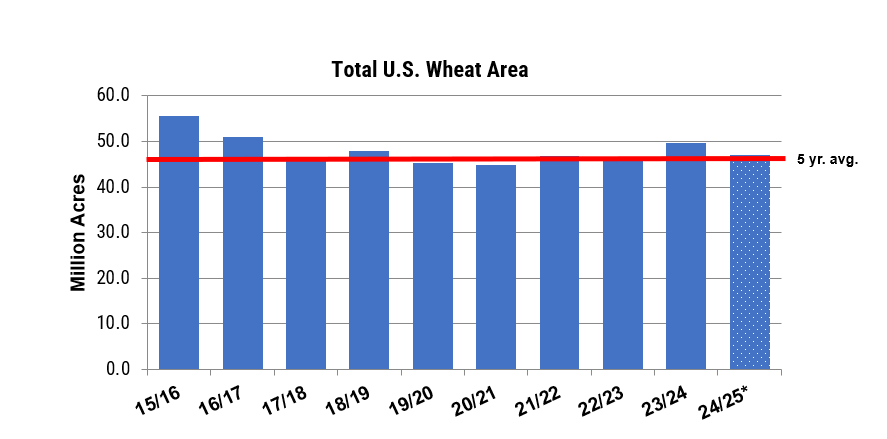
USDA forecasts wheat area at 47.0 million acres (19 million hectares), down 5% year over year but sitting just ahead of the five-year average of 46.4 million acres (18.7 million hectares). Source: USDA Grains and Oilseeds Outlook.

Despite the lower total planted area, USDA’ outlook anticipates a 2% yield increase to 49.5 bu/acre (3.33 MT/hectare). Following record abandonment in 2023, USDA’s estimated harvested area of 38.4 million acres (15.5 million hectares) is up 3%. The combined impact of improved yield and lower abandonment due to improved soil moisture conditions is expected to boost production to 51.7 MMT from 49.3 MMT in 2023/24. With the inclusion of higher beginning stocks, U.S. wheat supply estimate sits 6% higher year over year.

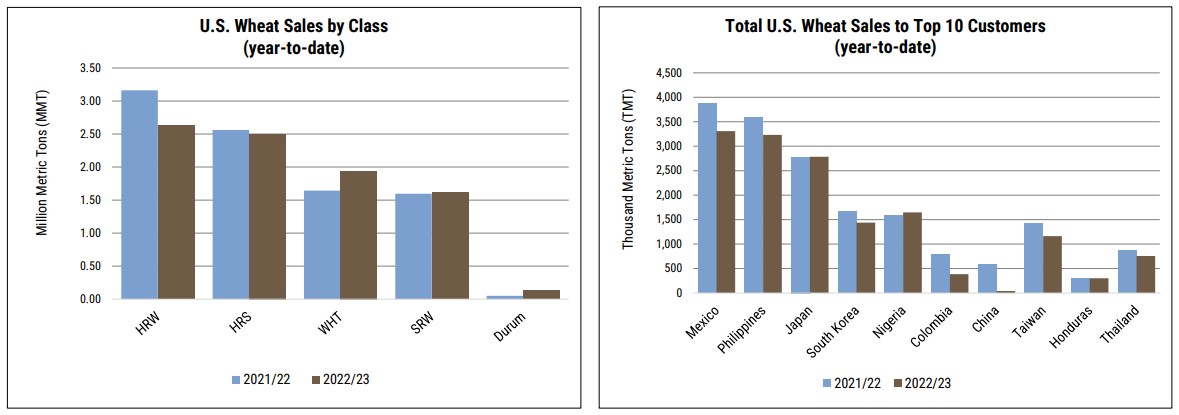
USDA predicts a slight decrease in domestic consumption to 30.8 MMT, marking a year-over-year reduction of 272,000 MT. In contrast, USDA expects U.S. wheat exports to bounce back to 21.09 MMT in 2024/25 on increased supplies.

A Looser Balance Sheet to Come?

Over the last seven years, there has been a steady erosion of U.S. ending stocks, falling from the recent high in 2016/17 of 32.1 MMT to a low in 2022/23 of 15.5 MMT, demonstrating the tightening of the U.S. balance sheet and providing underlying support to U.S. wheat prices. U.S. stocks will end 2023/24 slightly higher that with the improved production outlook suggests continued reversal of the downward trend.

Bar chart from USDA's outlook shows a trend down, then up in U.S. wheat ending stocks.

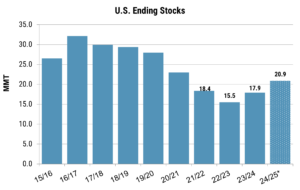
USDA forecasts 2024/24 U.S. ending stocks to increase 16% to 20.9 MMT on higher production and beginning stocks. Despite the increase, ending stocks still sit 35% below the peak of 32.1 MMT in 2016/17. Source: USDA Grains and Oilseeds Outlook and February 2024 WASDE.

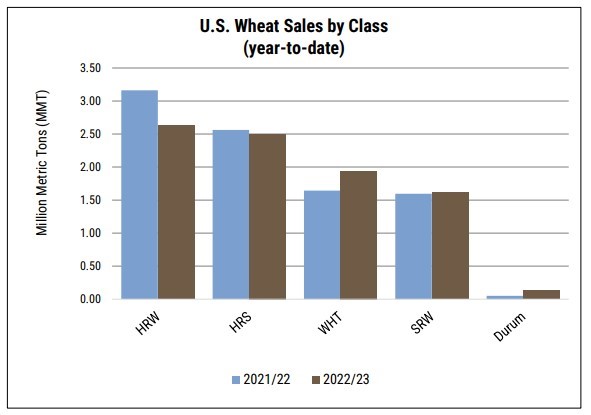
The current outlook casts a bearish tint on the upcoming crop year, but there is ample time between now and harvest for market conditions to change. For example, U.S. wheat total commercial sales and exports for 2023/24 sit at 17.6 MMT, 7% above last year’s pace and 89% of total projected exports. Crop conditions for winter wheat are much better than in the past few years but weather going forward will dictate final production.

USDA’s Prospective Plantings report, to be released on Mar. 28, and the May 2024 WASDE will provide detailed revisions for the 2024 U.S. wheat balance sheet, while Crop Progress Reports will provide updates on current crop conditions and planting progress. In the interim between harvests, world wheat markets will continue to search for new direction and shift based on emerging information. U.S. Wheat Associates (USW) will closely watch the crop and share additional information as the season progresses.

By Tyllor Ledford, USW Market Analyst

thumbnail

Final export commitment data for marketing year (MY) 2022/23 that ended May 31 is now available, providing an overview of the year’s export and demand trends.

In this article, we will look back on the MY 2022/23 demand trends and current MY 2023/24 data to provide context for the year to come as the world wheat market conditions continue to recover from the year’s volatility.

Since the start of 2022/23, wheat prices and freight decreased, and currency markets stabilized following the steep price shock of Mr. Putin’s unprovoked invasion of Ukraine. Despite the improved conditions, volatility and its consequences still reverberate through the U.S. and global wheat markets.

MY 2022/23 Year End Commercial Sales

Even with the year’s price risk, when ordinary hard red winter wheat exported from the Gulf of Mexico averaged $10.70/MT FOB, Mexico, the Philippines, Japan, South Korea, and Taiwan remained among the top U.S. wheat importers in 2022/23 and have consistently been among the leading importers over the last five years.

As U.S. wheat competitiveness began to improve early in calendar 2023, China entered the market, ultimately surpassing Taiwan to claim the number five spot as their purchases surged 38% above the year prior. Moreover, China became the world’s largest wheat importer with the June World Agricultural Supply and Demand Estimates (WASDE) putting Chinese wheat imports at a record 14.0 MMT.

Bar chart compares U.S. wheat sales to top 10 customers in marketing year 2022/23 to MY 2021/22 indicating Mexico, Philippines, Japan, South Korea were among the top importers.

Mexico, the Philippines, Japan, and South Korea have been consistently among the top five U.S. wheat importers. In 2022/23, China became the world’s largest wheat importer, surpassing Taiwan to claim the fifth-place spot among U.S. wheat importers. Source: USW Commercial Sales Report/USDA Export Sales Data.

Hard red winter (HRW) wheat sales were 32% behind 2021/22, a function of high prices driven by drought and exacerbated by the war risks. Hard red spring (HRS) sales were up 4% following the drought in 2021/22 that severely diminished the crop and put exports at their lowest level since 2008/09. Soft red winter (SRW) sales were nearly even with the year prior and 9% above the five-year average as SRW remained competitive on the global market. Following drought-stressed production in 2021/22, white wheat exports were up 35% at 4.5 MMT and tracking SRW trends. Durum sales were up 109% due to improved production increased sales to Algeria and the European Union.

Bar chart compares U.S. wheat by-class sales in marketing year 2023/24 to the same date in MY 2021/22.

Some classes saw improved export sales year-over-year despite an overall reduction in demand. HRW wheat sales were 32% behind 2021/22, HRS was up 4%, SRW was nearly even with the year prior, white wheat was up 35% and durum was up 109%. Source: USW Commercial Sales Report/USDA Export Sales Data.

MY 2023/24 to Date

Demand has been relatively light so far in MY 2023/24 as many buyers delay purchasing decisions for more concrete information about the upcoming harvest and price fundamentals. Adding optimism for importers are recent rains in the U.S. Plains that have helped boost winter wheat crop ratings and rapid planting progress in HRS production areas.

Overall, U.S. wheat commercial sales are down 18% from last year’s pace at 3.9 MMT. Even so, customers in Japan, South Korea, and Taiwan are ahead of their 2022/23 pace, and SRW commitments have surpassed last year’s level by 18% given its competitive price advantage.

USW Commercial Sales Report comparing export sales to specific countries in marketing year 2023/24.

Year-to-date marketing year 2023/24 commercial sales total 3.9 MMT, down 18% from the year prior. Meanwhile, purchases in Japan are 2% ahead of last year, South Korea up 5% and Taiwan up 75%. Vietnam, Guatemala, Ecuador, and Peru have also surpassed last year’s pace, highlighting how the market sentiment has shifted from a year ago. Source: USW Commercial Sales Report/USDA Export Sales Data.

New 2023/24 Estimates

Meanwhile, the June WASDE released on June 9 reported significant increases in world production estimates and ending stocks; however, the increases were unsurprising, leaving futures prices little changed.

World wheat production increased 10.4 MMT from the May estimates to 800.2 MMT on improved output in Russia, India, and the EU. World consumption increased by 4.4 MMT to 796.1 MMT, accounting for increased feed use in China, Russia, and India. Ending stocks increased to 270.7 MMT due to large projected stocks in India, Russia, and the EU. The estimates were also subdued on the domestic front, raising production by 100,000 MT, and increasing ending stocks by 200,000 MT with no other changes to the U.S. balance sheet.

Keep Up To Date

Though it is still very early in MY 2023/24, analyzing past trends and the monthly supply and demand updates helps provide context to aid purchasing decisions. Compared to this time last year, many influences have turned to favor wheat importers, though the war in Ukraine and weather patterns throughout the global wheat growing region add underlying risk. With risk still ever present, information is vital for planning and executing purchases. You can stay current on the latest reports via the U.S. Department of Agriculture and the U.S. Wheat Associates weekly Commercial Sales and Price Reports.

By U.S. Wheat Associates (USW) Market Analyst Tyllor Ledford

thumbnail

Early spring – before the harvest of winter wheat and the planting of spring wheat – is a perfect time to highlight tools U.S. Wheat Associates (USW) provides to inform U.S. wheat farmers and their customers around the world.

It’s also a good time to remind readers of this blog how to access those USW tools.

USW Price Report       

USW gathers information from market sources to compile timely reports on prices and export sales of U.S. wheat. The USW Price Report, which is sent to subscribers each Friday, also includes updates on market conditions and input from people involved in each step of the wheat trading process.

Monitoring the Chicago Board of Trade (CBOT), Kansas City Board of Trade (KCBOT) and Minneapolis Grain Exchange (MGEX) wheat futures is only part of the process.

“A huge component is talking with the grain trade, farmers and other industry representatives to get a firsthand account of what is going on in the market and how it is impacting wheat prices,” explained USW Market Analysis Tyllor Ledford, who is responsible for the USW Price Report. “By reaching out to each segment of the trade process, I try to get as balanced view as I can of what is going on in the wheat marketplace and really understand what is driving movements.”

Click HERE to sign up to receive USW’s Price Report.

Whether it's harvest season, planting season or the brief windows of time in between, USW provides several vehicles and platforms to keep wheat farmers and customers informed.

Whether it’s harvest season, planting season – or the brief windows of time in between – USW provides several products and platforms to keep wheat farmers and customers informed. All you need to do is sign up.

USW Commercial Sales Report

While the USW Price Report includes an update on commercial sales of U.S. wheat, more detailed information is available in the USW Commercial Sales Report, published each Thursday on the USW website and also compiled by Ledford.

Using data sourced from the USDA Foreign Agricultural Service Weekly Export Sales Report, the Commercial Sales Report contains wheat export sales-to-date by country and class for the current marketing year compared to the previous marketing year on the same date. The report also includes a 10-year commercial sales history by class and country.

USW Supply and Demand Report

USW’s Supply and Demand Report is published monthly on the USW website. Based on USDA’s World Agricultural Supply and Demand Estimates (WASDE), it includes U.S. wheat supply and demand summaries by class, as well as market factors and country- and region-specific export history.

Harvest Reports

Beginning in May and running through mid-October, USW and partner organizations compile updates on crop quality, harvest progress and crop conditions for hard red winter (HRW), soft red winter (SRW), hard red spring (HRS), soft white (SW) and durum wheat.

Each week, the USW Harvest Report is emailed to those who have signed up to receive it.

“The weekly harvest report is an example of how we keep everyone in the industry regularly updated on the wheat crop and current market conditions,” said USW Vice President of Programs Erica Oakley, who handles compilation of the Harvest Report. “We gather information about each class and each state that is in the process of harvest. It’s a very helpful way to monitor production throughout the harvest season.”

Click HERE to sign up to receive USW’s Harvest Report.

Wheat Letter

If you are reading this, you likely already subscribe to USW’s Wheat Letter, a blog and news source that focuses on issues facing U.S. wheat farmers – trade policy, crop quality and other pertinent wheat industry news.

The blog is updated regularly throughout the week, with a newsletter-style collection of those blog posts emailed to subscribers every other Thursday.

Click HERE to sign up to receive USW’s Wheat Letter. You can also pass this link along to someone who would be interested in subscribing.

Articles of Interest

Early each morning, USW Director of Programs Catherine Miller compiles Articles of Interest, a daily news report by conducting web searches to identify industry-related news articles. The goal is to help keep everyone updated on issues and events that may affect the U.S. wheat industry.

“It’s a news brief that highlights a variety of topics, including trade policy issues, supply and demand situations, wheat research and breeding crop conditions and news that involves the people who work in the industry,” said Miller. “We see it as a food way to start the day with the latest news and serves as a platform to share important stories an articles from all over the world.”

To be considered for the USW Articles of Interest mailing list, email [email protected].

Social Media

The newest platform in USW’s social media offerings is the USW YouTube Channel, which holds a growing number of USW-produced videos featuring USW staff, activities and partners.

USW is also has its own Facebook page, Twitter Account and Linked-In profile, each used to share information and quickly and efficiently.

thumbnail

A dramatic increase in demand for oilseeds could impact U.S. wheat production in coming years, with significantly more acres expected to be planted in soybeans destined for new and expanded crushing facilities.

Between 20 million and 25 million additional acres of soybeans will be needed to meet requirements of the renewable diesel industry, some analysts are predicting.

At the same time, global demand for wheat is also expected to rise, setting up dynamic competition for acreage in states where both crops are grown. For the U.S. wheat industry, the situation creates important questions: How much wheat acreage could potentially be lost to soybeans? Will lost acres impact the U.S.’ standing as the world’s most dependable wheat supplier? Can wheat and soybeans co-exist in a competitive environment?

This chart shows acreage planted in soybeans and wheat in 2022 in the country's top 10 soybean states, according to USDA's National Agricultural Statistics Service.

This chart shows total acreage planted in soybeans and total acreage planted in wheat in the country’s top 10 soybean states in 2022, according to USDA’s National Agricultural Statistics Service (NASS).

Where possible, farmers may adapt and double-crop more wheat and soybeans to maintain supplies of both crops. It is already a common practice in top soybean states like Illinois, Indiana and Ohio, where soft red winter wheat is the dominant class. But in soybean states that produce hard red winter and hard red spring wheat – Kansas, Nebraska, South Dakota and North Dakota, for example – allotting acreage is more complicated due to average rainfall and shorter growing seasons.

The ultimate question is if U.S. farmers will be able to meet the demand for both wheat and soybeans by doing what they have always done – figure out a way to do more with less.

Many Options, Limited Acres

Mike Krueger, a grain industry consultant with Lida Communications, put a spotlight on the emerging “competition for acreage” during last month’s U.S. Wheat Associates World Staff Conference.

While describing volatility in global wheat and grain markets due uncertain market conditions, Krueger noted a more predictable factor that will affect markets and decisions made by U.S farmers.

“Renewable diesel is projected to increase eight-fold by 2030 and significant investments of more than $2 billion are being put into new and expanded soybean processing plants in the U.S. right now,” Krueger explained. “The U.S. soybean crush will expand by 10%, or more. We are talking vast numbers, and while sunflower and canola should be big beneficiaries of renewable diesel, soybeans are certainly going to be in even higher demand.”

A boost of 20 million acres would catapult soybean and go a long way toward meeting the projected oilseeds demand.

But at what cost?

The U.S. has consistently ranked as one of the top five wheat producing countries in the world and one of the top three wheat exporting countries. Would a major shift in acreage affect U.S. production, thus its place as a supplier?

“We must remember there’s also a global demand for wheat, as well as corn, and we have to consider ongoing drought and weather patterns, not to mention political conflicts that are impacting grain production and supplies all over the world,” Krueger said. “All of this, all the things going on that affect global trade, will put major emphasis on overall crop production in the U.S. and the entire Northern Hemisphere. To be honest, no crop can afford to give up or lose acres.”

Can Double-cropping Help?

Higher prices caused by global demand for wheat and soybeans appears to be motivating more farmers in the Midwest to consider seeding soft red winter wheat in the fall and soybeans in the same field following wheat harvest.

About 40% of producers responding to a Purdue University Ag Economy Barometer survey in June indicated they have utilized a wheat and soybean double-crop rotation in the past. About 28% of those producers planned to increase the amount of cropland devoted to this rotation by seeding more wheat this fall followed by soybean plantings on the same acres in spring 2023.

Some analysts have predicted that renewable diesel demand in coming years will require the planting of at least 20 million additional acres of soybeans. This chart from USDA shows soybean acreage over the past decade.

Some analysts have predicted that renewable diesel demand in coming years will require the planting of at least 20 million additional acres of soybeans. This chart from USDA shows soybean acreage and harvest over the past decade.

Ultimately, the biggest factor behind whether farmers begin growing an extra crop of wheat is what price they can get for the crop.

“The shift toward increasing soft red winter wheat acreage is likely the result of the expected profitability improvement of the wheat and double-crop soybean rotation,” James Mintert and Michael Langemeier, authors of the Purdue survey, noted.

A move by the federal government earlier this year to increase the number of counties eligible for double-cropping insurance was a move aimed at boosting U.S. production of wheat and soybeans by reducing the risk for farmers who decide to take the double-crop route.

Producers are well-aware that there are drawbacks to double-cropping wheat and soybeans.

“Compared to single-crop soybeans, double-crop soybeans have a shorter growing season due to the delay in planting until the wheat is harvested, which often result in reduced yields,” said Scott Gerlt, Chief Economist for the American Soybean Association (ASA). “Despite this drawback, double-cropping does allow increased production.”

Wheat Demand to Grow

Despite questions about acreage and production, U.S. wheat continues to be in demand by international customers because of its consistent quality and reliability.

Krueger expects the demand will continue to expand.

“A primary reason is that global wheat supplies are likely to shrink due to a renewed focus on soybeans, and to a lesser extent, corn,” Krueger said. “Another factor favoring U.S. producers involves shipping and logistics limitations that hamper competing wheat-growing countries, including Russia and Ukraine.”

Effects from a third consecutive La Nina would further pressure global supplies.

“These things will undoubtedly lead to more export demand for wheat,” Krueger said. “Can the U.S. meet the demand? That is the puzzle that’s still being put together. Farmers make decisions every single planting season. They only have so many acres to work with.”


thumbnail
USW Vice Chair Michael Peter( left) with Sen. Frank Lucas, R-Oklahoman (center) and Yi-Cheun "Tony" Shu, chair of the TFMA, after the Letter of Intent signing at the U.S. Capitol.

USW Vice Chair Michael Peters ( left) with Sen. Frank Lucas, R-Oklahoma (center) and Yi-Cheun “Tony” Shu, chair of the TFMA, after the Letter of Intent signing at the U.S. Capitol.

Representatives from the Taiwan Flour Millers Association (TFMA) signed a Letter of Intent September 14, 2022,  with U.S. Wheat Associates (USW) to purchase 1.9 million metric tons – about 69.8 million bushels – of wheat from the U.S. over the next two years, a commitment with an estimated value of $576 million.

The signing, held at the U.S. Capitol in Washington, D.C., was a much-anticipated stop for the 2022 Taiwan Agricultural Trade Goodwill Mission, a team made up of Taiwanese government officials and representatives of some of the largest importers of U.S. grains. The group is led by Yi-Cheun “Tony” Shu, chair of the TFMA and of Formosa Oilseed Processing Co. Also participating is Dr. Ching-Cheng Huang, deputy minister of Taiwan’s Council of Agriculture.

Taiwan is the 6th largest U.S. wheat export market and the 7th largest overseas market for U.S. agricultural products. Along with its intent to purchase U.S. wheat in 2023 and 2024, the team also signed Letters of Intent with the U.S. Soybean Export Council (USSEC) and the U.S. Grains Council (USG) to purchase soybeans and corn. The total estimated commitment in the three letters total $3.2 billion.

Michael Peters, USW Vice Chairman, signed the TFMA Letter of Intent on behalf of the U.S. wheat industry.

“American farmers place great value on the relationship between U.S. agriculture and Taiwan,” Peters, a wheat producer and cattle rancher from Okarche, Oklahoma, said during the signing ceremony. “We pride ourselves as being dependable partners who grow the highest quality agriculture products in the world. The TFMA and its members have been great trading partners who fully recognize the value of purchasing U.S. wheat.”

Among U.S. officials on hand were Senators Kevin Cramer, R-North Dakota, John Hoeven, R-North Dakota, Frank Lucas, R-Oklahoma, Jim Risch, R-Idaho, and Chuck Grassley, R-Iowa. Representative Steven Chabot, R-Ohio, co-chair of the Congressional Taiwan Caucus, was also present to witness the signing.

Following the visit to Washington, D.C., flour millers on the Mission headed west to get a first-hand look at U.S. wheat production and meet the people responsible for supplying high-quality wheat to Taiwan. The team is scheduled to visit wheat farmers in Kansas, Idaho and Oregon. Other scheduled stops also include the Kansas Wheat Innovation Center and the Port of Portland in Oregon.

USW also joined USSEC, USGC, the National Association of Wheat Growers (NAWG) and the North American Export Grain Association (NAEGA) in hosting a reception for the Mission team on September 13. The event provided leaders of the U.S. wheat and grain industry an opportunity to catch up with members of the Taiwan Goodwill Mission, which last visited the United States in 2019.

USW President Vince Peterson addresses those gathered for a reception welcoming the 2022 Taiwan Agricultural Trade Goodwill Mission

USW President Vince Peterson addresses those gathered for a reception welcoming the 2022 Taiwan Agricultural Trade Goodwill Mission

USW President Vince Peterson addressed the gathering by pointing out the long and beneficial history of cooperation between Taiwan’s flour milling industry and the U.S. wheat industry that first opened a promotional office in Taipei 56 years ago.

“Our legacy organization Western Wheat Associates established a presence in Taiwan in 1966, so we are going on six decades of working with the country’s flour millers and food industry,” Peterson said. “In that time, Taiwan has purchased more than 45 million metric tons of U.S. wheat. This partnership between TFMA, U.S. Wheat Associates and U.S. wheat producers has been on a great path, and we plan to continue on that path in the future. We truly thank the Taiwan Goodwill Mission for coming to the United States and for its ongoing preference for U.S. wheat and other agricultural products.”

thumbnail

Editor’s Note: On Aug. 31, USDA/FAS Administrator Daniel Whitley announced the following statement:

“As a result of unanticipated difficulties with the launch of the new Export Sales Reporting and Maintenance System, USDA’s Foreign Agricultural Service will temporarily revert to the legacy system while we work to fully resolve the issues with the new system. FAS will be unable to publish weekly export sales data on Thursday, Sept. 1 or Thursday, Sept. 8, but we expect to resume regular reporting on Thursday, Sept. 15.” Read more here.

Each week the USDA publishes weekly commercial export sales for various commodities, including wheat. The Foreign Agricultural Service (FAS) collects data from U.S. exporters on  commodity quantity, type, class, the shipment marketing year, and the destination country. Exporters are also expected to report alterations to prior data such as order cancellations and changes in destination.

For the benefit of overseas wheat buyers, U.S. Wheat Associates (USW) posts an updated Commercial Sales Report each week on the USW website, based on this USDA data. Each updated commercial sales report shows the top 20 markets for total U.S. wheat sales and a breakdown by wheat class and destination.

FGIS Inspector

U.S. wheat commercial sales data is generated and reported by the Federal Grain Inspection Service as its teams inspect wheat and other grains before vessel loading. USDA publishes the data on Thursdays on a week delay.

Disruption

Unfortunately, there was a disruption in the report last week. A new technical system was used to report export sales as usual on Thursday, Aug. 25. However, following the publication of the report, traders questioned the contents. The report was taken offline, and the contents were redacted. Reuters reported the redaction occurred after the commodities markets had already closed for the day.

In a statement, the government said it encountered “challenges that affected the physical dissemination of the export sales data as well as data quality.”

The Gold Standard

In explaining the report’s significance, Reuters stated, “the export sales report, which has a week-long delay, is a key indicator for traders, input suppliers and farmers as it highlights recent demand for crops such as corn, soybeans, and wheat at a time of tight global supplies. It calculates the sales of U.S. commodity goods to international customers such as China and Mexico.”

Commercial sales as a percentage of export forecasts can help exporters and buyers understand the supply and outline the general market for a given product. Highlighting the significance of the data reported, Reuters described the weekly commercial sales report as a “gold standard.” In fact, early U.S. wheat leaders fought through the battle of the “Great Grain Robbery” by the Soviet Union and advocated for more transparency and information from USDA to help farmers and their overseas customers that helped lead to weekly commercial sales reports in 1976. The USDA also forecasts annual commodity exports in the World Agricultural Supply and Demand Estimates (WASDE) report.

USW Commercial Sales Charts

USDA Commercial Sales data 9above from Aug. 18, 2022) is needed to help understand market movements. USW expands and reports that data each week as it is released from USDA.

The USDA is addressing he technical issues now, and as of Aug. 30, the export reporting system was still down.

USW will continue to report commercial sales but only with data that we know to be accurate.

By Michael Anderson, USW Market Analyst