thumbnail

Drought in major U.S. wheat-growing regions over the past few years is well-documented. The persistent dry conditions acutely impacted U.S. wheat yield and increased abandonment, with 2023/24 production coming in 6% below the pre-drought five-year average. Now, entering the second half of the marketing year, the focus has shifted to the 2024 harvest and its impact on both U.S. and global supply and demand. Although it is early, optimism has begun to bloom for the 2024 winter wheat harvest, and the following highlights the factors that have helped boost the U.S. wheat outlook.

Acreage Down, But Conditions Improved

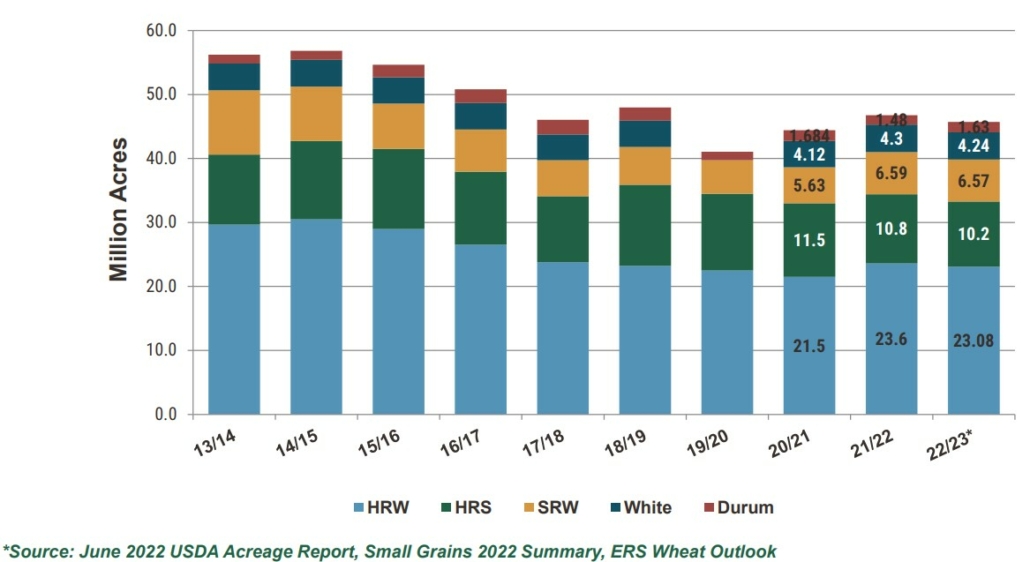
The Winter Wheat and Canola Seedings Report, published on Jan. 12, put the preliminary winter wheat acreage at 34.4 million acres (m.a.) (34.3 million hectares), down 6% from 2023 but still 4% ahead of the five-year average. The hard red winter (HRW) wheat area is estimated at 24.0 m.a. (9.7 million hectares), down 5% on the year, while the soft red winter (SRW) area is approximately 6.89 m.a. (2.8 million hectares), a 7% decrease. The white winter wheat (including soft white and hard white winter) area came in at 3.5 m.a. (1.4 million hectares). Desert Durum® seedings in Arizona and California for the 2024 harvest are estimated at 65,000 acres (26,300 hectares) total, up 16% from 2023 and 48% below 2022.

This bar chart shows U.S. wheat planted area by class between 2013/14 to 2023/24.

According to the Winter Wheat and Canola Seedings Report, published on Jan. 12, the winter wheat acreage is estimated at 34.4 m.a., down 6% from 2023 but still 4% ahead of the five-year average. The HRW area is estimated at 24.0 m.a., SRW at 6.89 ma, and the white winter wheat area came in at 3.5 m.a. Desert Durum® seedings in Arizona and California are estimated at a combined 65,000 acres. Source: USDA Winter Wheat and Canola Seedings Report.

Moving toward fall of 2023, moisture helped replenish dry soil in the U.S. Southern Plains, aided planting, and supported early-season growth and emergence, while making visible improvements in the U.S. Drought Monitor. According to USDA, as of Jan. 30, 2024, winter wheat area in drought registered at 17%, down from 22% the week prior and 58% last year. Meanwhile, the last aggregate USDA Crop Progress Report, published on Nov. 27, 2023, put 50% of winter wheat in the good to excellent category, the highest since 2020.

This line chart shows the percentages of U.S. winter wheat rated "good to excellent" from 2015 to 2024.

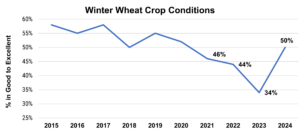
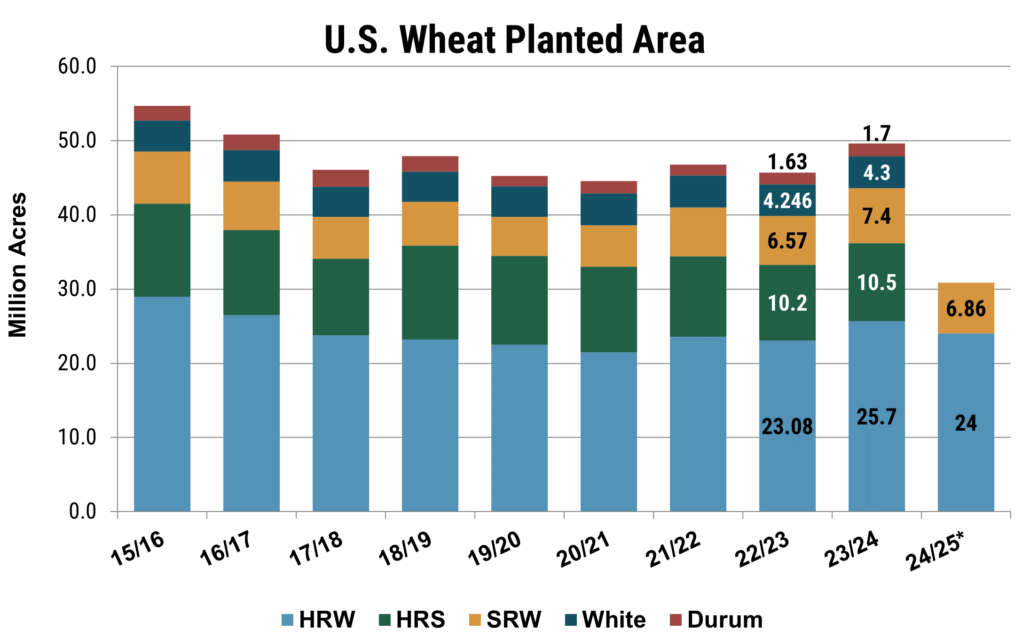
The last national USDA Crop Progress Report put 50% of the U.S. winter wheat crop in good to excellent condition, the highest since 2020. Source: USDA NASS Data.

Despite the decreased acreage, the cautious optimism about wheat conditions suggests the potential for improved yield and reduced abandonment for the 2024 harvest. Improved yields will provide a welcome boost to U.S. wheat production, helping improve supply and relieving pressure on the U.S. balance sheet and wheat prices.

An Early State-by-State Snapshot

Comments from producers at a recent meeting of the U.S. Wheat Associates (USW) Wheat Quality Committee echoed the optimistic sentiment. However, despite the objectively improved crop outlook from the year prior, winter conditions have started to vary as the season progresses, serving as a reminder that much can change before harvest time.

Following are condition recaps in major winter wheat-producing states from committee members and National Agricultural Statistics Service (NASS) data as of Jan. 28:

Kansas. Data from NASS rates 54% of Kansas winter wheat good to excellent, and optimism has bloomed regarding the 2024 harvest. Kansas wheat farmer and USW Secretary-Treasurer elect Gary Millershaski highlighted visible improvements to wheat stands compared to the previous year.

Texas. NASS data put Texas wheat conditions at 42% good to excellent, while Texas farmers remain optimistic about current conditions.

Oklahoma. An Oklahoma farmer commented that soil moisture remains adequate, and the wheat entered dormancy in good condition. Oklahoma crop conditions rated 63% of the crop in the good to excellent category.

Colorado. About 61% of the crop sits in the good to excellent category, though winds and dry weather this winter may cause some condition deterioration.

Nebraska. According to a Nebraska farmer, rain during planting helped boost conditions, and the stands continue to benefit from the soil moisture. Current conditions put Nebraska winter wheat at 69% good to excellent.

South Dakota. South Dakota Wheat Commission CEO Jon Kleinjan commented that the state’s HRW wheat was seeded with adequate moisture. As good snow cover remains, he is optimistic about the 2024 crop. Likewise, NASS put 53% of winter wheat in good to excellent.

Montana. Approximately 41% of the HRW crop sits in the good category; however, cold and a lack of snow coverage have negatively impacted crop conditions this winter.

USDA/NOAA Map of Winter Wheat in Drought from Jan. 30, 2024.

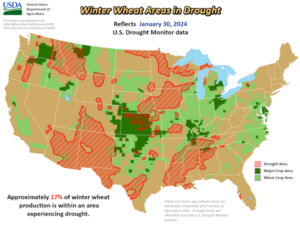
According to the weekly USDA Agriculture in Drought Report, as of Jan. 30, 2024, 17% of U.S. winter wheat resides in areas experiencing drought, down from 22% last week and much improved from 58% last year. Source: U.S. Agriculture in Drought.

More Data to Come

The upcoming USDA Prospective Plantings Report will provide preliminary estimates for spring wheat, durum, and the white spring wheat area and update the winter wheat estimates. It is important to remember that the 2024 harvest is still months away, and conditions can and will change as the crop year progresses. Nonetheless, even after an extended drought, U.S. wheat farmers remain resilient and committed to growing a reliable supply of high-quality wheat for their customers around the world.

By USW Market Analyst Tyllor Ledford

thumbnail

The June USDA reports on Acreage and Stocks, released on June 30, 2023, made a significant splash on grain markets after an already volatile week. With no new fundamentals to trade, wheat prices found little insulation from movements in corn and soybean markets. From June 21 to June 30, Chicago Board of Trade corn futures were down $1.14 on the week and CBOT Soft Red Winter wheat (SRW) futures were down $1.06. Minneapolis Grain Exchange (MGEX) Hard Red Spring (HRS) and Kansas City Board of Trade (KBOT) Hard Red Winter (HRW) futures dropped 63 cents and 75 cents, respectively.

Before Friday’s USDA reports, dryness in the U.S. Midwest, particularly in the Corn Belt, wreaked havoc on wheat and corn markets as corn conditions hovered at their lowest rating since 1988. Meanwhile, instability in wheat markets persists with on-going news from the conflict in the Black Sea.

June Acreage Report

The Acreage Report estimated the total U.S. wheat planted area at 49.6 million acres (ma) or 20.1 million hectares (mh), up 9% from 2022 but 300,000 acres less than the March estimates. The 2023/24 planted area still represents the largest planted area since 2016/17. Little changed from the March estimates with the winter wheat area projected at 37.0 ma (14.9 mh), up 11% from last year. The most significant increase occurred in the SRW wheat area as it registered a 17% increase from the year prior.

As discussed in previous articles, high prices in the fall of 2022 incentivized farmers to plant additional acres, and the USDA reports confirms that shift. New to the June report, the HRS area was forecast at 10.5 ma (4.2 mh), which is up 5% from the March estimates and 5% from 2022. Meanwhile, durum is predicted at 1.48 ma (0.6 mh), down 200,000 acres from the March estimates and 9% below 2022/23.

More Corn Than Expected


Statistics from USDA shows the volume of corn planted and harvested in the United States and the large increase in 2023.

U.S. corn planted area is expected to take an unusually large jump in 2023 according to a new report from USDA’s National Agricultural Statistics Service (NASS).

Corn and soybeans were arguably the largest surprise and the most significant contributor to Friday’s volatility. USDA forecast corn area at 94.1 ma (38.1 mh), which would be the third highest area on record, and is up from 88.6 ma (35.9 mh). The USDA NASS map at the top of this page shows an estimate of how many acres of corn are planted in each state and the percentage change from 2022. Soybean area was down 5% on the year and below trade estimates, coming in at 83.5 ma (33.8 mh).

The USDA estimates for the soybean area were nearly 5.0 MMT below the average trade estimates, sending a shockwave through commodity markets. The market reacts relative to how much the estimates deviate from the trade expectations. Source: Acreage, Grain Stocks, and Rice Stocks – Agricultural Statistics Board Briefing.

The impact of the USDA Acreage report released June 30 was bullish for soybeans, bearish for corn, and varied for wheat. That day, July 2023 CBOT SRW futures closed down 97 cents on the week at $6.36/bu. KCBT HRW futures were down 58 cents, at $8.01/bu. MGEX HRS futures were down 63 cents at $8.02/bu. CBOT corn futures were down 76 cents at $5.55/bu. CBOT soybean futures were up 63 cents, at $15.57/bu.

Quarterly Grains Stocks Report

The June Grain Stocks Report, published on June 30, USDA estimates that old crop wheat stocks are down 17% from 2022 at 15.8 MMT. On-farm stocks are 3.4 MMT, up 34% from 2022 but 22% below the five-year average. The larger on-farm stocks indicate that farmers hold a larger share of the wheat crop than years prior. Meanwhile, off-farm wheat stocks are down 25% at 12.4 MMT.

Key Takeaways

The week’s volatility and the impact of the reports demonstrate persistent risks in the current wheat market and the ever-present influence of the weather. As the crop year progresses, it is crucial to keep a watchful eye on corn and soybean markets, as fundamentals in these markets can have consequences on the wheat market. Likewise, as the harvest pace ramps up and more information about the new crop becomes available, markets will begin to price in the availability of the supply, anticipated demand, and quality of the year’s crop.

Line chart from USDA reports show the relationships between U.S. wheat, corn, and soybeans planted area over time.

USDA forecast corn area at 94.1 ma (38.1 mh), the third highest area on record, while the soybean area was down 5% on the year and below trade estimates, coming in at 83.5 ma (33.8 mh). The soybean area declined for the first time in three years. Corn and soybeans compete directly for space, so the sharp increase in corn plantings cut into the soybean area. Source: USDA Grains Stocks Report.

Stay current on the 2023 wheat harvest via the U.S. Wheat Associates Harvest Reports and market moving factors in the weekly Price Report.

thumbnail

USDA’s National Agricultural Statistics Service (NASS) will publish its first official estimate of U.S. winter wheat planted area for the 2023/24 crop on Jan. 12, 2023. Along with U.S. wheat importing customers, U.S. Wheat Associates (USW) will be watching trade estimates before the report is issued and make some comparisons to NASS estimates in 2022.

USDA’s Economic Research Service has noted that “the general downward trend in U.S. wheat plantings over the last two decades is attributable to lower relative returns for wheat, changes in Government programs that give farmers more planting flexibility, and increased competition in global wheat markets.”

The past three marketing years, however, have seen a slight change in that trend.

At planting time in 2022, the relatively high farm gate prices for hard red winter (HRW), soft red winter (SRW) and white winter wheat (including winter soft white and hard white) provided some incentive to plant more winter wheat. Looking ahead, the pre-report predictions to date for total winter wheat planted area of between 34 million acres (MA) and 36 MA are both higher than the final 2022 crop NASS estimate of 33.27 MA. A survey of traders by Bloomberg posted Jan. 9 estimated total winter wheat planted area at 34.5 MA.

More Planted Acres Expected

Wheat analyst Jeffery McPike with WASEDA Commodities and McWheat Trading Inc., recently pegged that group’s initial 2023 planted area forecast at 35.7 MA that, if realized, would be a 7.3% increase over NASS’s final 2022 estimate. The high end of estimates in Bloomberg’s survey is 36.2 MA.

The group’s forecast of 24.8 MA for HRW planted area is 7% more than the final NASS 2022 estimate based mainly on expected gains in the Central and Southern Plains. The Bloomberg trader survey estimate averaged 23.9 MA.

McPike said the group is bullish on SRW planted area with a forecast of 7.22 MA, which is 11% more than NASS’ final 2022 estimate. For example, an Arkansas Extension official recently reported that “good prices and a relatively dry fall likely encouraged farmers to plant more winter wheat for a 2023 harvest. Early estimates are that winter wheat acres in Arkansas will be up 25% to 30% from last year.” Traders surveyed by Bloomberg estimate the average at 6.9 MA.

The group sees only a slight uptick in white winter wheat planted area to 3.65 MA. The Bloomberg trader estimate average was 3.7 MA. The January 2022 NASS estimate for winter white planted area was 3.56 MA.

Bar chart depicting USDA's estimates of U.S. wheat planted area from 2013 through 2022, by wheat class.

Change in Direction. Compared to the general downward trend in U.S. wheat planted area, higher wheat prices for farmers have provided an incentive to plant more wheat the past three marketing years. Planted area for the three winter wheat classes (HRW, SRW and white winter) are all up since 2019/20. Note that “White” wheat on this chart includes spring-planted soft white wheat.

And Watch Harvested Area and Production Estimates

NASS will adjust its winter wheat planted area forecast throughout 2023. And, as McPike pointed out, the currently unknown harvested area, along with production estimates, will be  major price determinants. For example, compare the final 2022 NASS estimate of HRW planted area of 33.89 MA to final harvested area of 24.05 MA.

“After the NASS figure is published and gets digested, the market will likely quickly move to winterkill issues (again) in the U.S., Europe, and the Black Sea regions,” McPike said, “and harvested area discussions, along with the many macro issues that continue to roil the markets.”

The annual NASS Winter Wheat Seedings report will be published here: https://usda.library.cornell.edu/concern/publications/z890rt24s,

An additional source of information is the USDA Economic Research Service December 2022 Wheat Outlook published at https://downloads.usda.library.cornell.edu/usda-esmis/files/cz30ps64c/hh63v4630/zc77v192n/WHS-22l.pdf.