By Stephanie Bryant-Erdmann, USW Market Analyst
Over the past decade, U.S. wheat planted area peaked in 2008/09 at 63.2 million acres (25.6 million hectares). Since then, U.S. wheat planted area has fallen 27 percent to a projected 46.1 million acres (18.7 million hectares) in 2017/18 according to the March 31 USDA Prospective Plantings report. If realized, it will be 16 percent below the 5-year average of 55.0 million acres (22.3 million hectares) — making it the lowest planted wheat area since 1919 when USDA records began.
This report actually increased winter wheat planted area by 360,000 acres (146,000 hectares) from USDA’s January 2017 estimate to 32.7 million acres (13.23 million hectares). However, the new estimate is still 9 percent down from 2016/17 planted area. The increase came from hard red winter (HRW) area, estimated at 23.8 million acres (9.63 million hectares), up 2 percent from the previous projection. Still, HRW planted area will be down 10 percent from 26.5 million acres (10.7 million hectares) planted for 2016/17.
Soft red winter (SRW) planted area decreased from the previous estimate to 5.53 million acres (2.24 million hectares). The biggest declines occurred in Midwest states where SRW faces strong competition for acres from corn and, particularly this year, from soybeans.
USDA expects white wheat acres — planted in both winter and spring — to reach 4.12 million acres (1.67 million hectares) for 2017/18, down slightly from 2016/17, but in line with the 5-year average. For the first time in three years, the Drought Monitor shows adequate soil moisture in the Pacific Northwest (PNW) following a rather wet winter.
Given the drop in planted area, crop conditions become crucial to any look out at potential production for 2017/18. For HRW, the April 6 Drought Monitor also shows that 45 percent of Kansas and 66 percent of Oklahoma were abnormally dry or experiencing moderate drought, even though the region received 1 to 4 inches (2.5 to 10 cm) of rain last week. Fifteen percent of Oklahoma remains in severe or extreme drought. In 2016, these states grew nearly half of the total U.S. HRW crop.
Last week’s beneficial moisture improved U.S. winter wheat condition in Kansas, Oklahoma and Texas, but the crop is still in worse condition than last year at this time. As of April 3, USDA rated the winter wheat crop at 51 percent good to excellent, compared to 59 percent on the same date in 2016. USDA rated 14 percent of the crop as poor or very poor, up from 7 percent last year.
The U.S. Northern Plains received abundant precipitation this winter, providing good soil moisture for HRS and durum planting. The past two years, farmers in North Dakota, Montana and Minnesota began HRS planting 7 to 14 days ahead of normal due to early springs. This year, planting dates will be closer to normal as farmers are now waiting for fields to dry out.
According to USDA, U.S. total spring-planted area will decline to an estimated 11.3 million acres (4.57 million hectares), 3 percent less than in 2016/17. The estimate includes 10.6 million acres (4.3 million hectares) of hard red spring (HRS), down 7 percent from 2016, if realized.
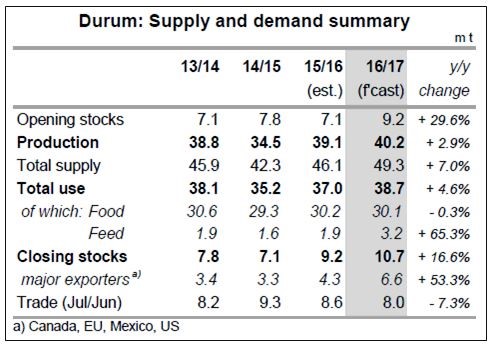
USDA expects U.S. durum planted area to total 2.00 million acres (809,000 hectares), down 17 percent from 2016/17. If realized, this would further constrict the global durum supply discussed in the March 23 Wheat Letter.
Continuing to drive the decline in U.S. wheat planted area is a net farmer return on wheat that dropped 18 percent between 2015/16 and 2016/17, while input costs declined only one percent in the same time period. USDA expects this trend to continue in 2017/18, with returns falling another 6 percent from already unprofitable 2016/17 levels.
There is a long way to go before the final count is in. However, with less planted area and an expected return to trend line yields, the International Grains Council (IGC) pegged 2017/18 U.S. wheat production at 50.2 MMT, down 20 percent from 2016/17.