thumbnail

By Stephanie Bryant-Erdmann, USW Market Analyst


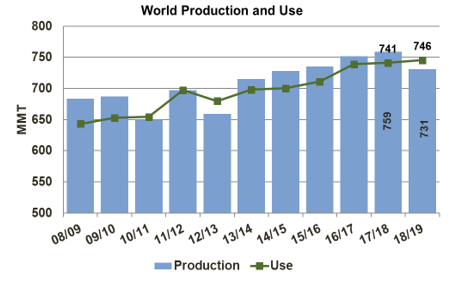
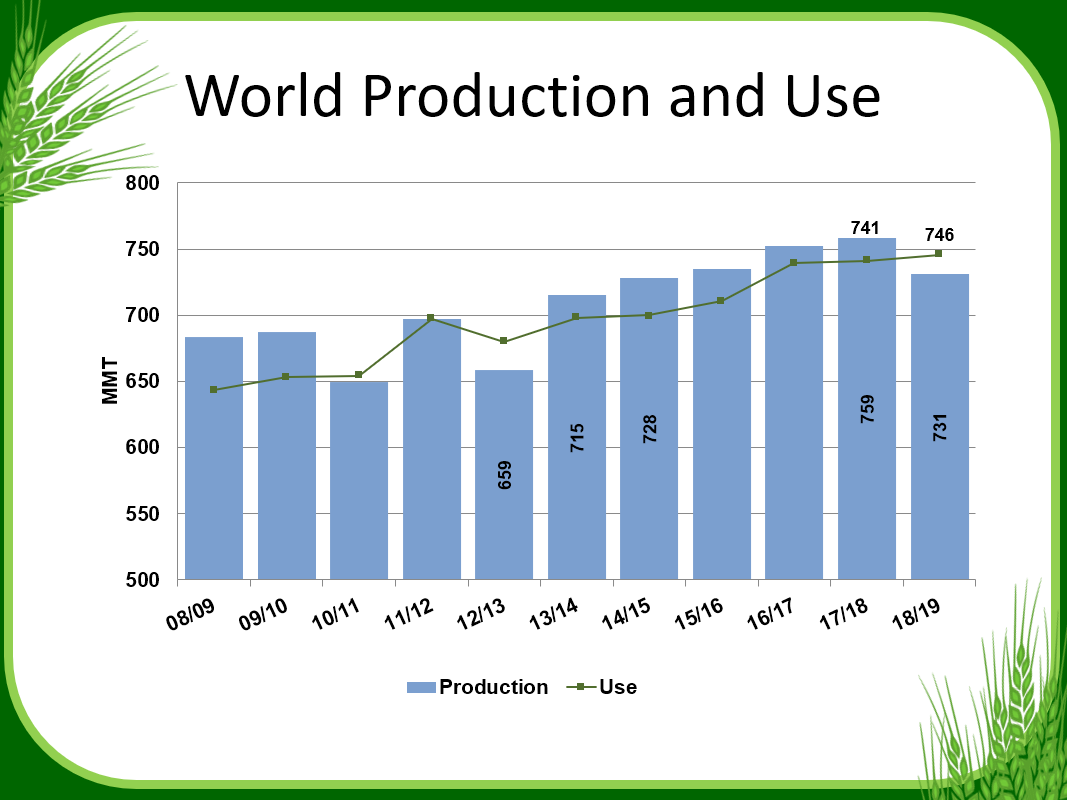
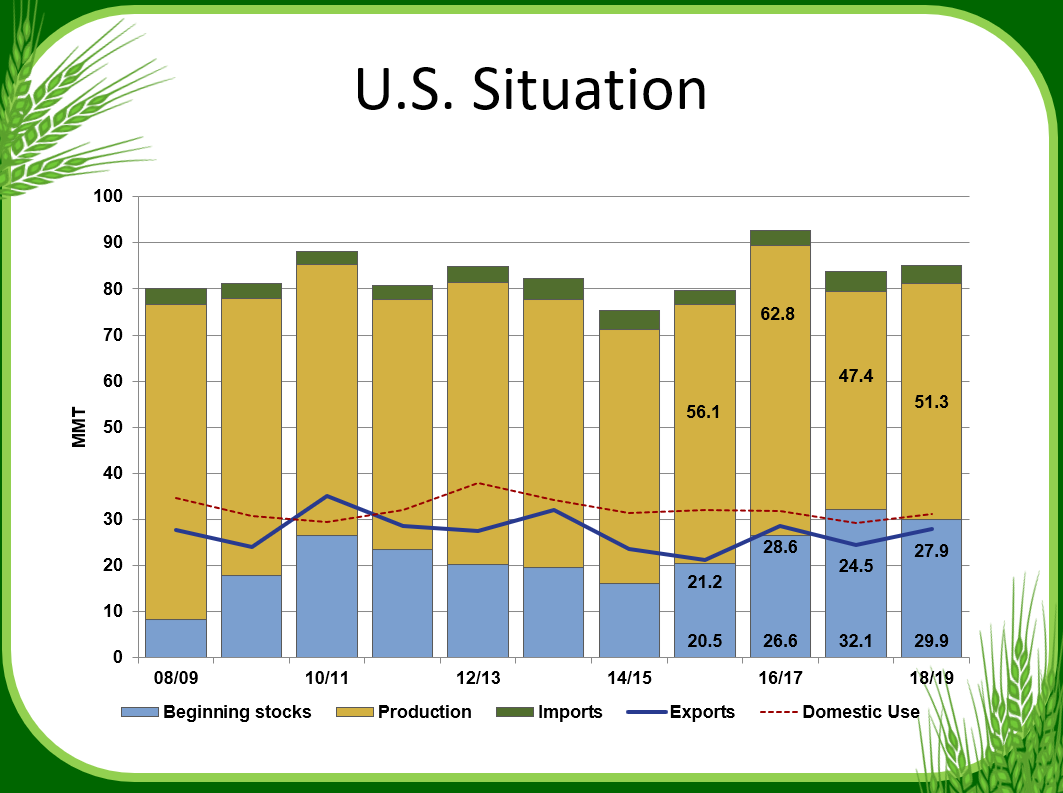
The expected turn to U.S. wheat supplies appears to be underway.


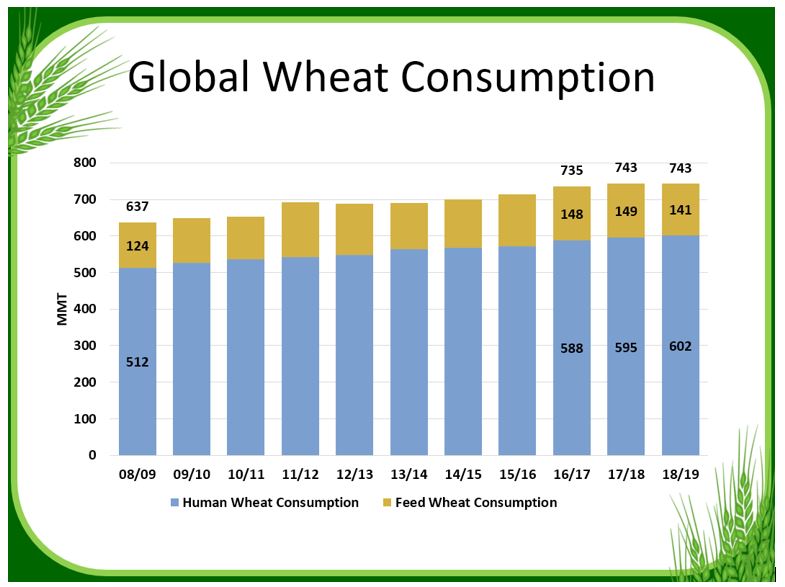
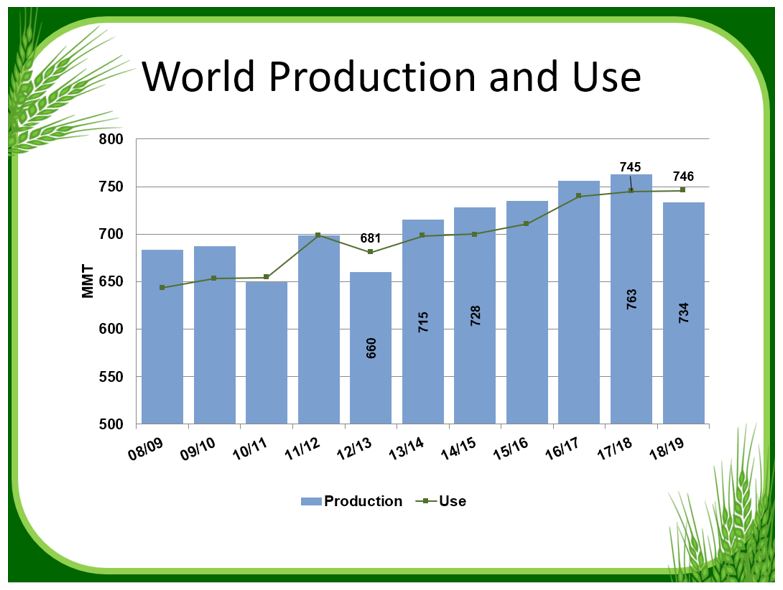
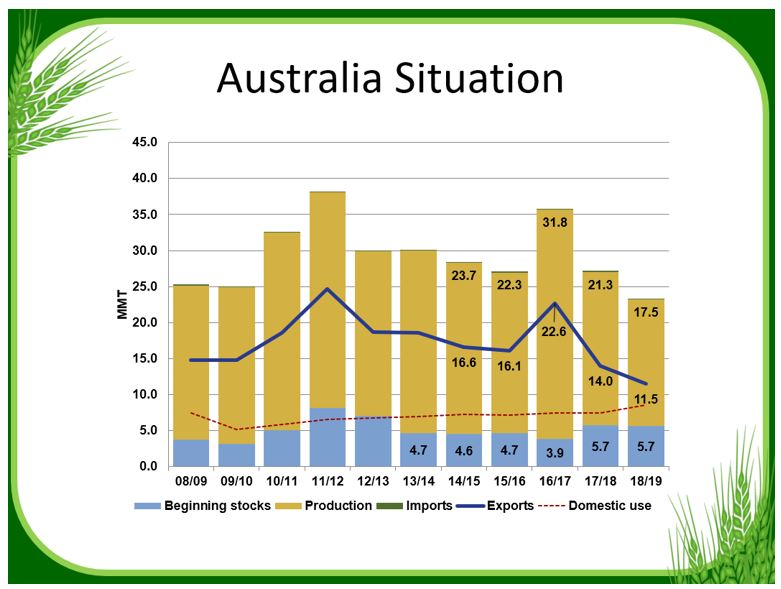
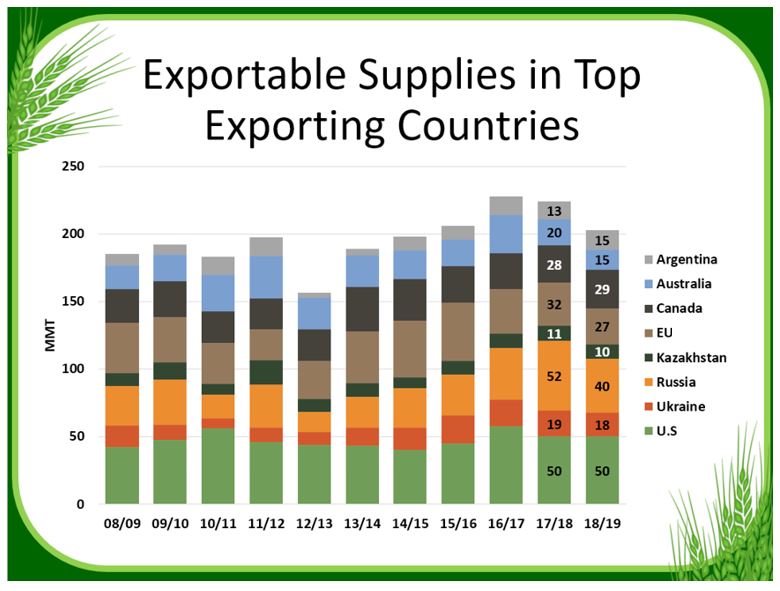
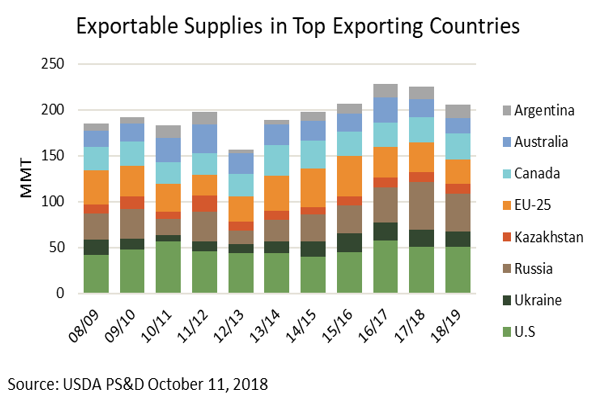
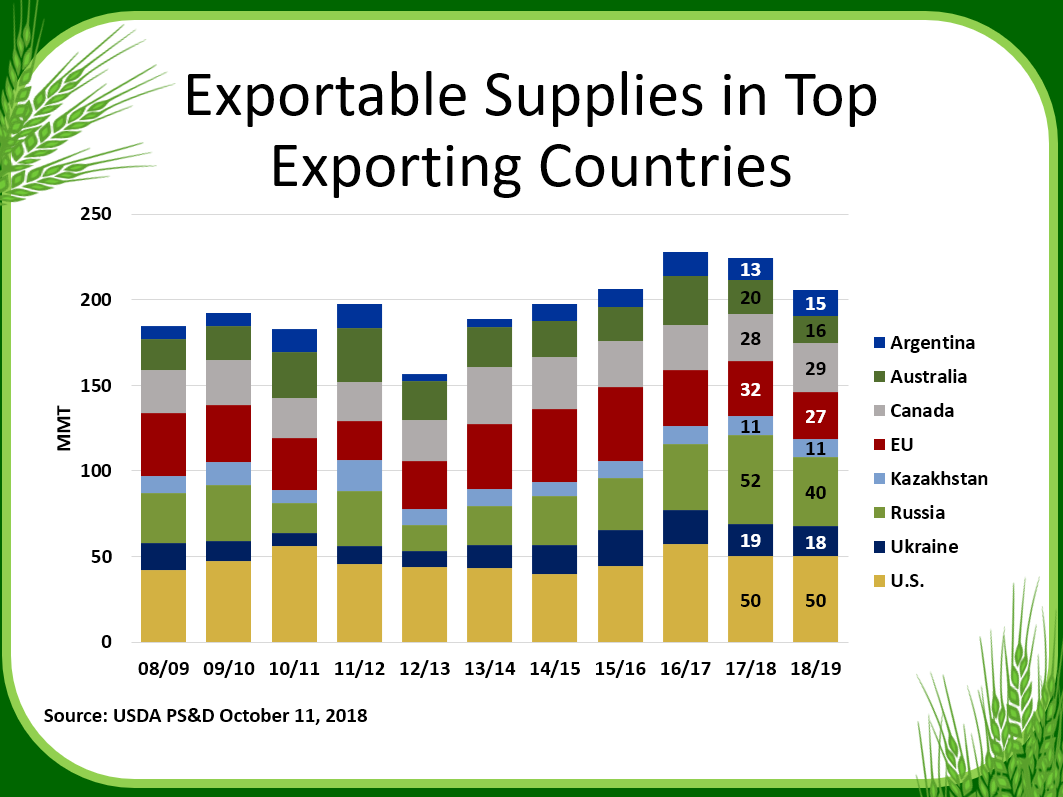
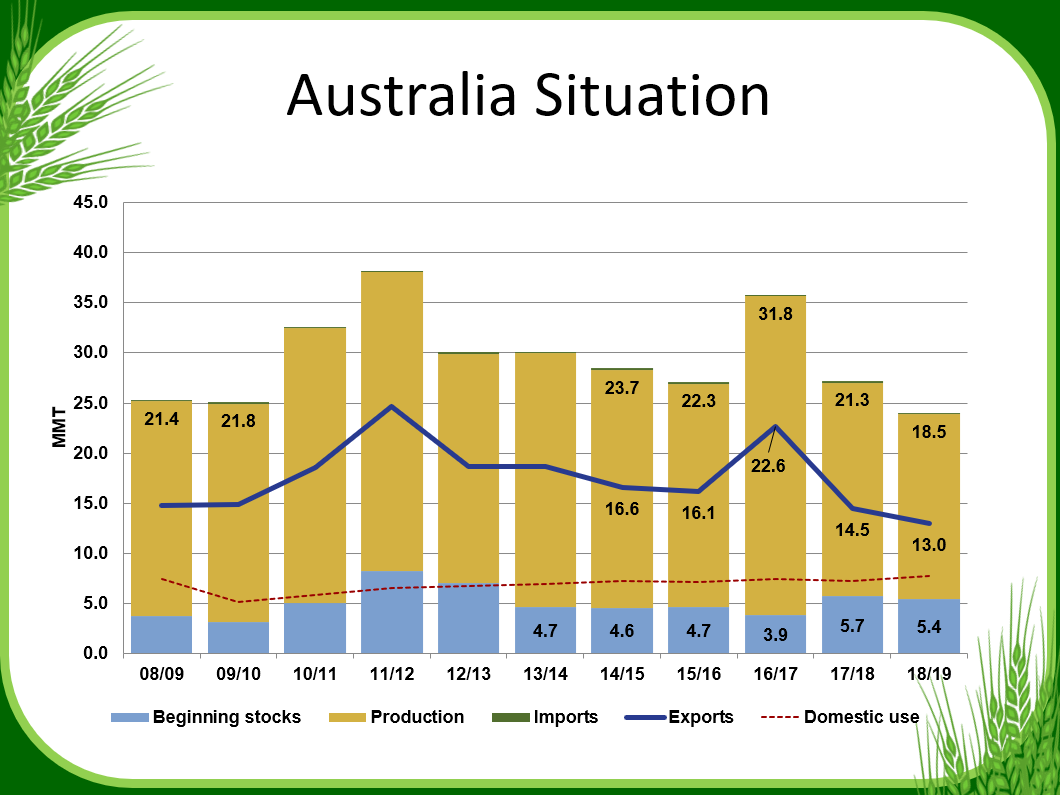
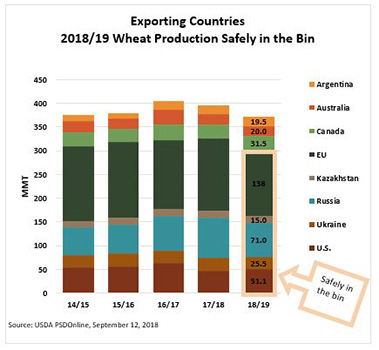
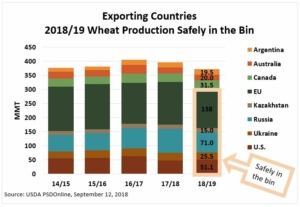
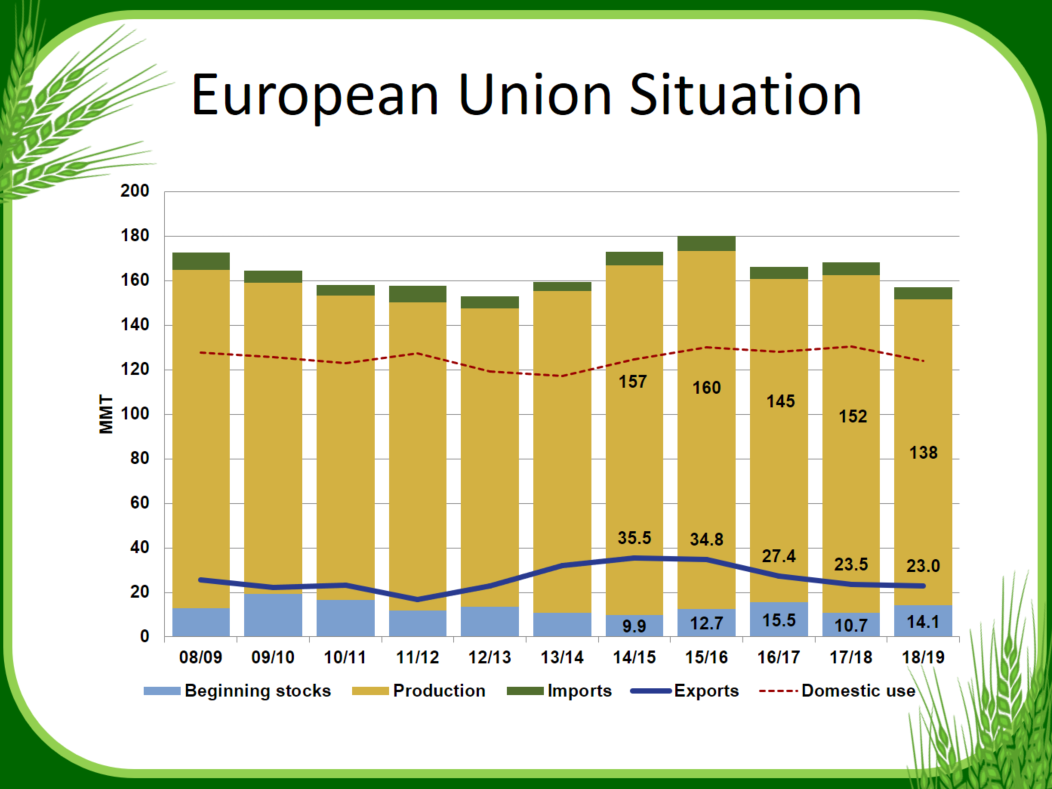
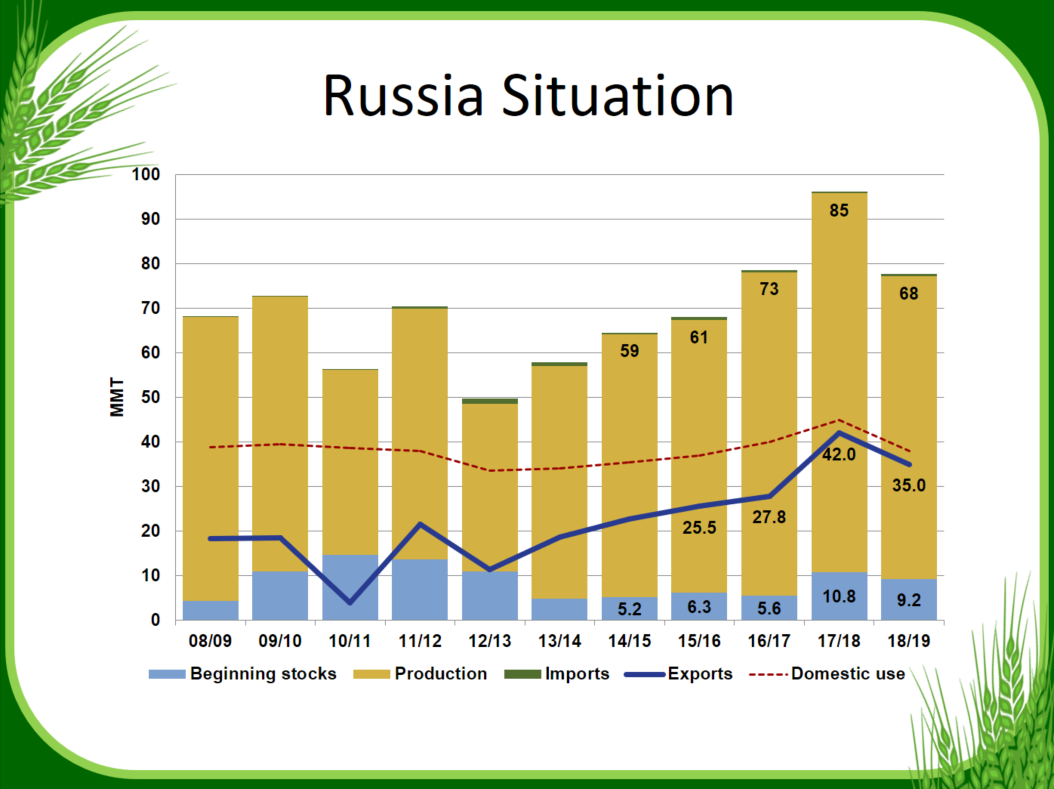
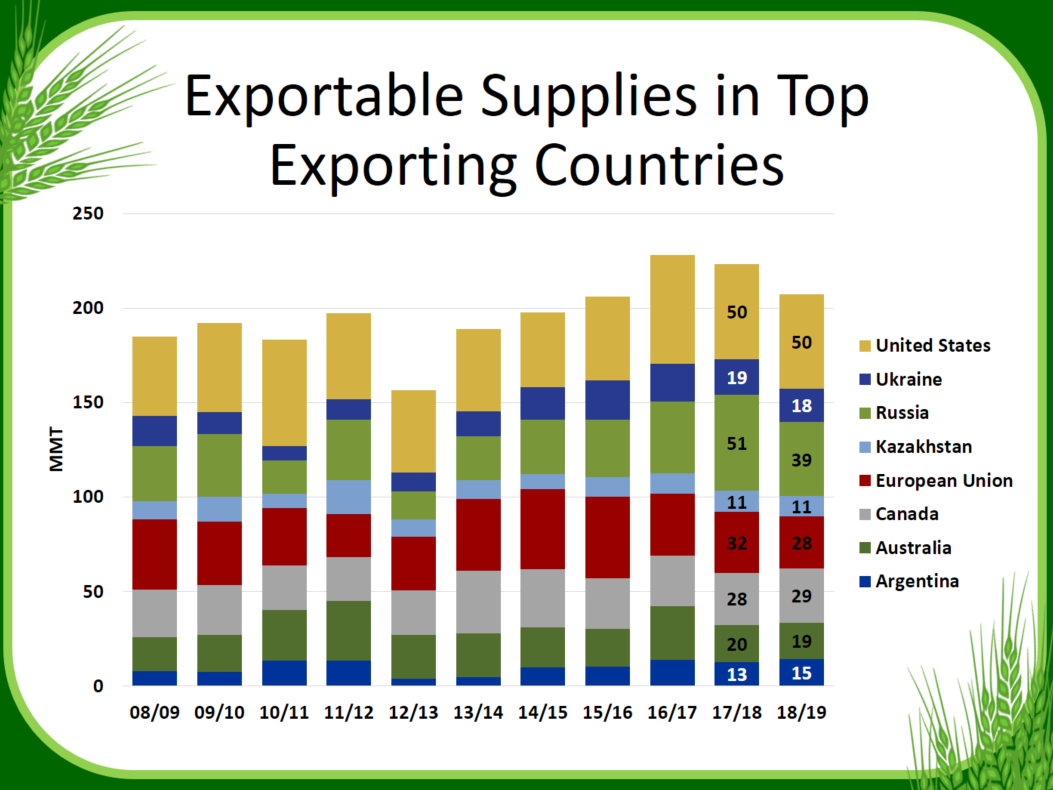
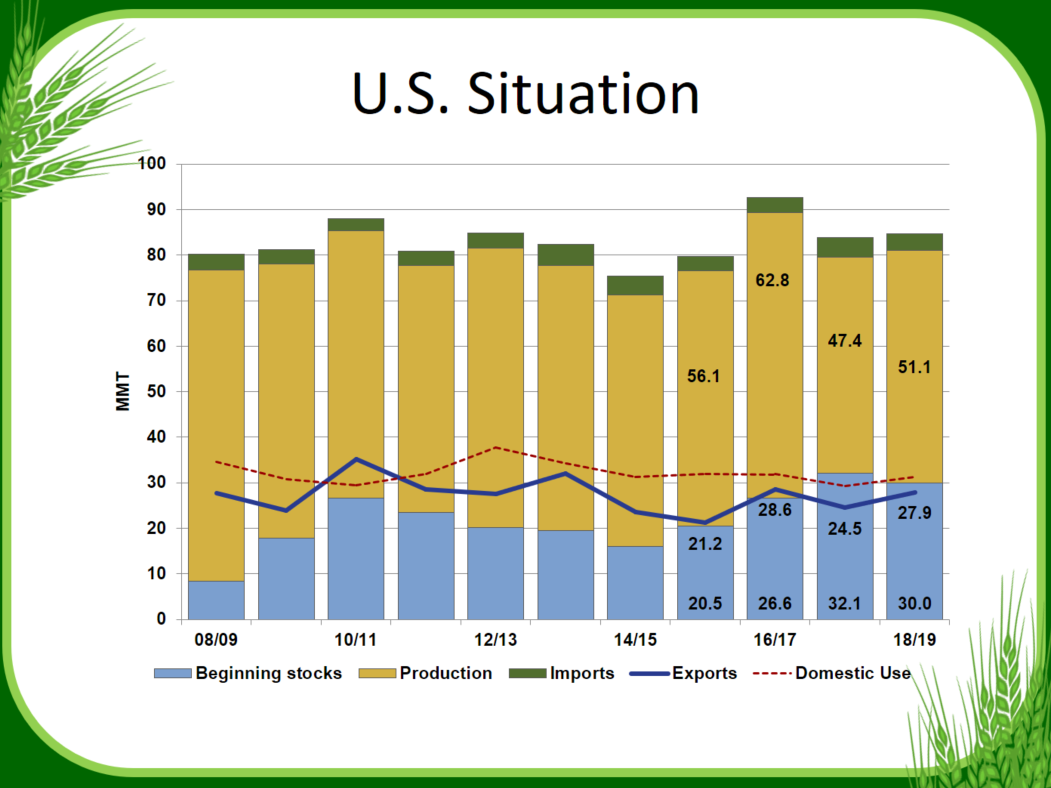
U.S. wheat exports to price sensitive markets and to typically self-sustaining markets are on the rise due to increased price competitiveness. Fueling this demand for U.S. wheat is, in part, shrinking wheat supplies, especially of high-quality milling wheat following decreased production in half of the world’s major wheat exporters — including Australia, the European Union (EU), Russia and Ukraine. The shrinking supplies in these countries have lifted their domestic and export wheat prices significantly over the past few months. At the same time, a large, high-quality crop pressured U.S. wheat prices lower, resulting in a convergence not seen for several years.


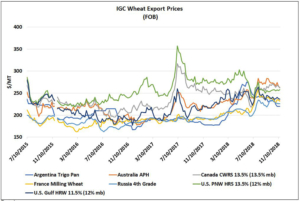
According to International Grains Council (IGC) data, free-on-board (fob) French wheat prices rose 11 percent or $23 per metric ton (MT) from the start of the 2018/19 marketing year (beginning on June 1). Russian 4th Grade fob wheat prices have increased $15 per MT, and Australian fob wheat prices have increased an average $13 per MT. IGC data shows U.S. fob wheat prices slipping an average 8 percent due to the large, high-quality crop.


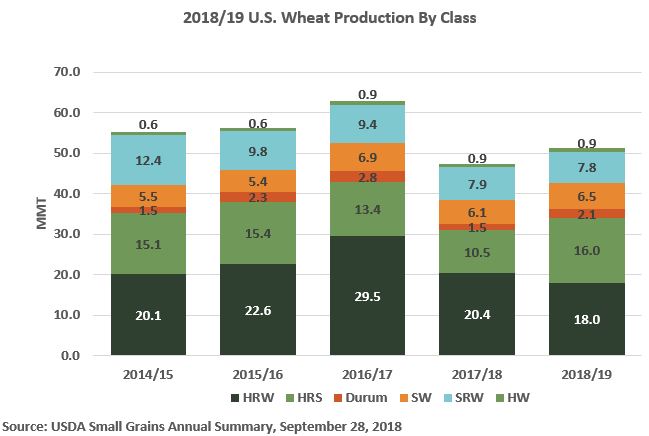
As of Nov. 22, IGC data shows U.S. wheat is now at a better value than all the major competitor pairings. U.S. soft red winter (SRW) is the best value milling wheat in the world at $216 per MT, $10 per MT below Russian 4th Grade wheat. U.S. 11.5 percent protein (12 percent moisture basis) hard red winter (HRW) is valued at an average $3 per MT below French wheat. U.S. 14 percent protein (12 percent moisture basis) hard red spring (HRS) from the Pacific Northwest (PNW) is an average $258 per MT, $4 per MT below Canadian CWRS from Vancouver; and U.S. SW from the PNW is an average $47 per MT less than Australian wheat, which is now the most expensive wheat in the world due to the devastating drought they have suffered.


The convergence in prices has resulted in increased sales of U.S. wheat as customers seek to secure supplies. Notably, on Nov. 26, USDA reported U.S. export sales of 120,000 MT of SRW to Egypt. The announcement followed an earlier General Authority for Supply Commodities (GASC) public tender where U.S. wheat was the lowest offer. Coupled with earlier sales, U.S. wheat export sales to Egypt now total 220,000 MT, almost double last year’s and the highest level since 2013/14. The United States has also shipped 64,000 MT of HRW to Saudi Arabia, with trade experts expecting additional demand from the country’s recent optional origin tender.

U.S. durum sales are also benefiting from increased price competitiveness. IGC data shows French durum and U.S. durum from the Great Lakes are now at parity at $240 per MT after French durum production was hurt by poor growing conditions. U.S. durum export sales are up 54 percent year over year at 400,000 MT with the EU being the largest buyer, followed by Algeria and Nigeria.


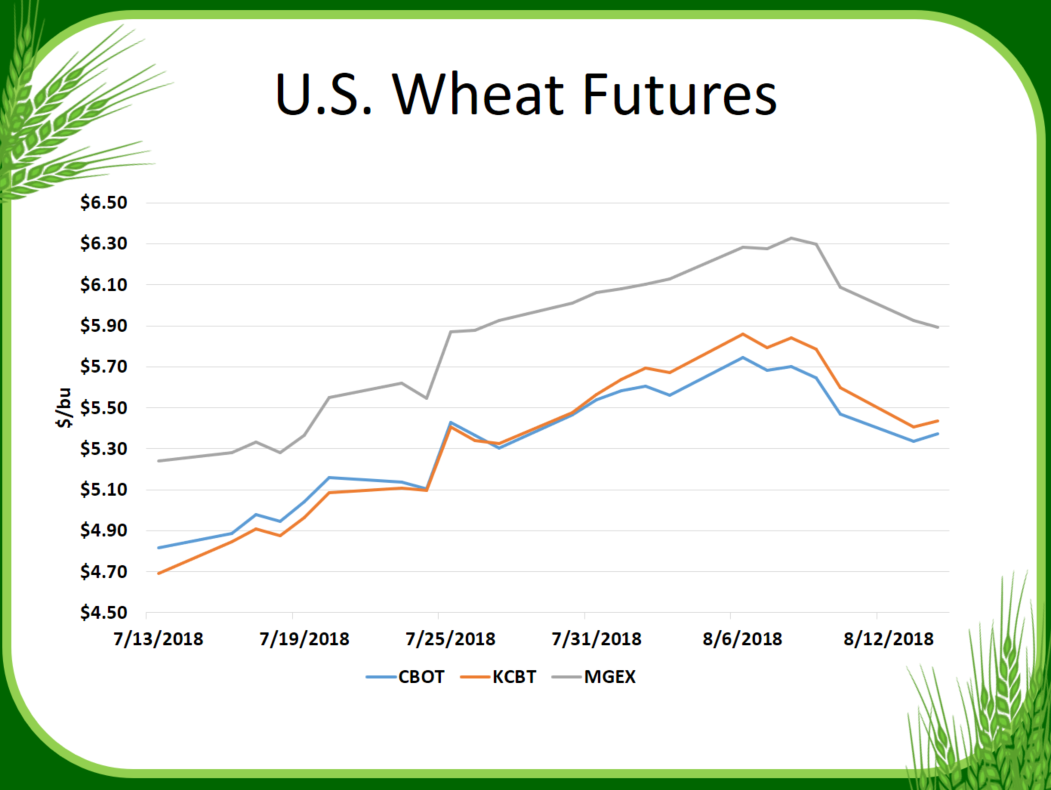
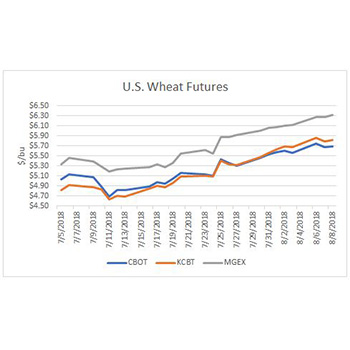
Despite the increased demand for U.S. wheat, U.S. wheat futures remain at or near marketing year lows, pressured by excellent winter wheat crop conditions and good soil moisture in the U.S. Northern Plains.

It is rare for U.S. wheat prices to be in such a competitive position, which represents an excellent opportunity for customers to lock-in their wheat futures price at these excellent levels.


To track U.S. wheat prices, subscribe to the USW Weekly Price Report.


By Stephanie Bryant-Erdmann, USW Market Analyst

USDA expects global wheat consumption to remain at record high levels in 2018/19 due to increased human consumption. Human wheat consumption is expected to reach a record high 602 million metric tons (MMT), 4 percent above the 5-year average. Over the past ten years, global human wheat consumption has increased 90 MMT, while feed wheat usage has increased 16 MMT.

However, the global supply of milling wheat is expected to fall this year due to challenging growing and harvesting conditions that hurt both quality and yields in many of the major wheat exporting countries. USDA expects global wheat production to fall to the lowest level in 5 years at 734 MMT, down 4 percent from the record high of 763 MMT in 2017/18. If realized, it would be 1 percent below the 5-year average and the first-time global wheat consumption has exceed global wheat production since 2012/13.

The decline in global wheat production is due to decreased production in half of the major wheat exporting countries including the European Union (EU), Russia, Australia and Ukraine. If realized, Russian wheat production would still the third highest on record, but Australian wheat production is expected to fall its lowest level since 2007/08.

Australian wheat production is expected to fall 18 percent year over year to 17.5 MMT due to consecutive years of devastating drought in New South Wales and Queensland where Australian Prime Hard (APH) and Australia Hard (AH) production is centralized. Increased wheat production in Western Australia is expected to partially offset the decrease from the rest of the country. Australian wheat harvest typically occurs in December. USDA expects Australian exports to decrease to 11.5 MMT, 35 percent below the 5-year average and also the lowest level since 2007/08.

With exportable wheat supplies (production plus beginning stocks minus domestic consumption) decreasing in half of the world’s major exporters, USDA expects the United States to have the largest exportable supply of wheat in the world in 2018/19 at 49.9 MMT.

As a consequence, USDA expects 2018/19 U.S. wheat exports to reach 27.9 MMT, up 14 percent from 2017/18 and 7 percent above the 5-year average, if realized. Still, U.S. wheat export sales pace will need to increase to meet this goal, as year-to-date U.S. wheat export sales total just 13.8 MMT or 49 percent of USDA’s anticipated total.

To learn more about 2018 U.S. wheat quality, visit the USW Crop Quality page.

thumbnail

By Stephanie Bryant-Erdmann, USW Market Analyst

This week, U.S. Wheat Associates (USW) holds its 2018 Fall Board of Directors meeting. At each board meeting, the USW Market Analyst presents an update on world and U.S. wheat supply and demand factors based on information from the U.S. Department of Agriculture, as of Oct. 11, 2018. Following are some highlights from the current report to the board.

  • 2018/19 global wheat production to fall for first time in 5 years.
  • Global supplies estimate to fall to 1,006 million metric tons (MMT); down 1 percent from the 2017/18 record.
  • Wheat production in Australia to fall to 18.5 MMT, 26 percent below the 5-year average.
  • U.S. wheat production estimated at 51.3 MMT, 8 percent above 2017/18.


  • Consumption forecast at a record 746 MMT, 4 percent above the 5-year average.
  • Chinese domestic consumption expected to reach 122 MMT, 5 percent above the 5-year average.
  • U.S. domestic consumption to grow 6 percent year over year to 31.1 MMT.


  • World wheat trade projected at 180 MMT, 4 percent above the 5-year average.
  • Australian exports to drop to 13.0 MMT, 10 percent below 2017/18, and the lowest level since 2007/08.
  • Exports from Russia to fall 15 percent year over year 35.0 MMT, still 28 percent above the 5-year average.
  • U.S. 2018/19 exports to increase to 27.9 MMT, up 14 percent from 2017/18, if realized.


  • World beginning stocks estimated at record 275 MMT, up 7 percent year over year.
  • Beginning stocks in Argentina forecast at 1.00 MMT, down 42 percent the 5-year average.
  • U.S. beginning stocks will fall to an estimated 29.9 MMT, 7 percent below 2017/18 levels.


  • Global ending stocks projected at 260 MMT, 5 percent below the record 2017/18 level, if realized.
  • Estimated Chinese ending stocks of 136 MMT account for 52 percent of global ending stocks.
  • Exporter ending stocks forecast at 58.8 MMT, down 24 percent year over year.
  • Ending stocks in importing countries to fall to 65.6 MMT, 15 percent below the 5-year average of 76.8 MMT.


  • Total U.S. wheat export sales for 2018/19 predicted to reach 27.9 MMT.
  • As of Oct. 11, 2018/19, U.S. wheat export sales were 18 percent behind last year’s pace.
  • About 27 percent of that difference represents temporary loss of the Chinese market.
  • Sales of soft red winter and durum are ahead of last year’s pace.


thumbnail

By Stephanie Bryant-Erdmann, USW Market Analyst

USDA updated its monthly World Agricultural Supply and Demand Estimates (WASDE) on Oct. 11, showing the United States to have the largest exportable supply of wheat in the world in 2018/19 following devastating losses in the European Union (EU) and Australia, and decreased production in Russia. Due to the decreasing exportable wheat supplies in these three countries (production plus beginning stocks minus domestic consumption), USDA expects the United States to have the largest exportable supply of wheat in the world in 2018/19 at 50.1 million metric tons (MMT).

Decreased production in half of the major exporting countries — Australia, the EU, Russia and Ukraine —   will result in global wheat production decreasing to 731 MMT, down 4 percent year over year and the lowest level since 2014/15, if realized. While global wheat production will fall for the first time in 5 years, USDA noted that global wheat consumption will reach a new record high of 746 MMT, 4 percent above the 5-year average.

Drought devastated wheat areas in the EU earlier this year and has now spread south to Australia.  USDA expects Australian total wheat production to fall to 18.5 MMT, 13 percent below last year and 26 percent below the 5-year average. Smaller Australian wheat production is also expected to result in 2018/19 Australian wheat exports falling to 13.0 MMT. If realized, that would be the lowest level of Australian exports since 2007/08, 26 percent below the 5-year average.

With Australian wheat exports decreasing sharply year-over-year, USDA expects U.S. white wheat exports to increase 11 percent from 2018/19 to 5.85 MMT, the highest level since 2011/12.

USDA expects 2018/19 U.S. wheat exports to reach 27.9 MMT, up 14 percent from 2017/18 and 7 percent above the 5-year average, if realized. Exports of five of the six U.S. wheat classes are expected to increase year-over-year, and hard red winter (HRW) exports are expected to remain above the 5-year average. Still, U.S. wheat export sales pace will need to increase to meet this goal, as year-to-date U.S. wheat export sales total just 11.6 MMT or 42 percent of USDA’s anticipated total.

thumbnail

By Stephanie Bryant-Erdmann, USW Market Analyst

On Sept. 28, USDA released its Small Grains Summary noting that 2018/19 U.S. wheat production increased to 51.3 MMT, up 8 percent from last year due to improvements in both average yield and harvested area. While this is still 8 percent below the 5-year average of 55.8 MMT, the 2018/19 production coupled with significant carry-in stocks ensure that the U.S. wheat store will remain open and well-stocked throughout 2018/19. Here is a look at 2018/19 U.S. wheat production by class.

Hard red winter (HRW). Last fall, U.S. farmers increased HRW planting in the U.S. Southern Plains due to favorable moisture conditions. That slight increase was not enough to offset decreased planted area in the U.S. Northern Plains where a long-term drought delayed, and in some cases, prevented winter wheat planting. Planted area in Montana fell 6 percent year over year. USDA reported HRW planted area at 23.2 million acres (9.39 million hectares), down 2 percent from 2017. Unfortunately, most of the Southern Plains received little to no moisture until spring, with some areas going from October to April without measurable precipitation. The poor weather caused Oklahoma wheat farmers to abandon 43 percent of their winter wheat area, up from both the 5-year average and the 2017/18 abandonment rate of 36 percent. The average HRW yield in Kansas and Oklahoma, the top two HRW-producing states, decreased 21 percent and 18 percent from 2017/18, respectively. With the drought causing both harvested area and average yields to fall, USDA estimates total 2018/19 HRW production dropped 12 percent to 662 million bushels (18.0 MMT). Though smaller in volume, 2018 HRW quality i is excellent. Read more here.

Hard red spring (HRS). Wet conditions slowed HRS planting but replenished depleted soil moisture across the drought stressed Northern Plains. USDA says U.S. farmers planted 12.1 million acres (4.90 million hectares) to HRS, up 17 percent from the year prior. The beneficial moisture boosting average HRS yields and harvested area. In North Dakota, the top HRS producing state, the average yield climbed 20 percent year over year to a record high 49.0 bu/acre (3.29 MT per hectare), up 41 percent from 2017/18. Idaho farmers also produced record high HRS yields. USDA now reports HRS production at 587 million bushels (16.0 MMT), up 53 percent from 2017/18.

Soft red winter (SRW). Last fall, U.S. farmers planted 5.85 million acres (2.37 million hectares) of SRW, up 4 percent from the year prior, but still 23 percent below the 5-year average. While planting conditions were generally favorable, depressed prices kept planted area low. In early 2018, several U.S. SRW growing areas received excessive moisture that decreased yield potential and the wet weather continued through harvest. USDA reported SRW production totaled 286 million bushels (7.78 MMT), down 2 percent from 2017/18 and 33 percent below the 5-year average of 429 million bushels (11.7 MMT). Read more here.

White wheat (including soft white, club and hard white). U.S. white wheat planted acres stayed close to the 5-year average at 4.15 million acres (1.68 million hectares) in 2018/19. A wet winter boosted yield potential for both the winter and spring crops. The average spring white wheat yield in Washington increased 20 percent to 54.0 bu/acre (3.63 MT per hectare). The slight increase in harvested area and significant improvement in average yields pushed 2018/19 total white wheat production to 272 million bushels (7.41 MMT), a 5 percent increase year over year, and 8 percent above the 5-year average of 252 million bushels (6.86 MMT).

Durum. Farmers planted less durum area this year in response to lower prices and large carry-out stocks during spring planting. USDA estimates 2.00 million acres (810,000 hectares) were planted to durum, down 13 percent from 2017/18 but still 9 percent above the 5-year average of 1.84 million acres (745,000 hectares). USDA estimated total 2018/19 U.S. durum production at 77.3 million bushels (2.10 MMT), up 41 percent from last year. Generally favorable weather boosted yields in the U.S. Northern Plains, with average durum yields increasing to 39.3 bu/acre (2.64 MT per hectare), up 13.3 bu/acre from last year when drought severely impacted the crop. Desert Durum® production fell 8 percent year over year to 10.5 million bushels (385,000 MT) due to sharply lower planted area in both Arizona and California.

thumbnail

By Stephanie Bryant-Erdmann, USW Market Analyst


USDA expects global wheat production to fall to the lowest level in 5 years at 733 million metric tons (MMT), down 3 percent from the record high of 758 MMT in 2017/18. If realized, it would be slightly below the 5-year average. This downturn is, unfortunately, led by decreasing supplies in historic wheat exporters. At the same time, USDA raised its forecast for global wheat consumption to a record high 746 MMT, up 1 percent from 2017/18. To help buyers stay up to date on this fundamental information, U.S. Wheat Associates (USW) is providing this round-up of current conditions and forecasts for Canada, Argentina and Australia.


The estimated wheat production in countries still harvesting adds only a small portion of the 2018/19 supplies in exporting countries, and the total is expected to be down for the second year in a row 


Canada. Winter is here, if you farm in Alberta and Saskatchewan that account for roughly 70 percent of Canadian wheat production. Provincial weekly crop reports on Sept. 11 noted harvest delays from early frosts, wet field conditions and, in some areas, snow. We do not yet know the extent of any damage to wheat quality from these conditions, but it raises concern because more than half of the spring wheat in the two provinces was still in the field. Harvest was an estimated at 23 and 46 percent complete in Alberta and Saskatchewan, respectively.


Agriculture and Agri-Food Canada (AAFC) had already pegged 2018/19 Canadian wheat production (excluding durum) down 4 percent from 2017/18 at 24.0 MMT. A 10 percent decrease in average wheat yields is partially offset by a 7 percent increase in expected harvested area. AAFC reported average wheat yields of 48.3 bu/acre (3.25 MT/ha) compared to 54.0 bu/acre (3.63 MT/ha) in 2017/18. Canadian durum production is expected up 1 percent from 2017/18 to 5.03 MMT; an expected 17 percent increase in harvested area more than offsets a14 percent reduction in average yields year over year. AAFC expects 2018/19 Canadian total wheat exports (including durum) to total 22.2 MMT, up 3 percent from 2017/18.


Argentina. According to the Bolsa de Cereales, the Buenos Aires Grain Exchange, Argentine farmers saw prices staying at profitable levels and planted 7 percent more wheat area for 2018/19. Since planting, the Argentine government announced an export duty of 4 pesos per dollar on wheat exports with its effects to be determined. Bolsa estimated total wheat planted area at 15.1 million acres (6.1 million hectares), up from 14.1 million acres (5.7 million hectares) in 2017/18.


On September 13, Bolsa reported beneficial moisture fell on the La Pampa region and areas around Buenos Aires. However, rainfall has been low in northwestern Argentina, which accounts for roughly one-third of wheat planted area. USDA’s September estimate for 2018/19 Argentinian wheat production was 19.5 MMT (716 million bushels), up 8 percent from 2017/18 and 35 percent greater than the 5-year average. Argentina harvest typically occurs in late November through early January.


Australia. The Australian Bureau of Agricultural and Resource Economics and Sciences (ABARES) forecasts 2018/19 wheat production at 19.1 MMT. That is down 10 percent from 2017/18 due to severe drought in New South Wales and Queensland, where Australian Prime Hard (APH) and Australia Hard (AH) production is centralized. Increased wheat production in Western Australia may partially offset the lower production elsewhere. Still, if realized, production volume would be the lowest since 2007/08. Australian wheat harvest typically occurs in December. USDA expects Australian exports to decrease to 14.0 MMT, 21 percent below the 5-year average.


With global wheat supplies tightening and global demand on the rise, customers should pay close attention to crop conditions in these countries. Even if early snows or drought cut supplies there, or a government intervenes in the market somewhere else, U.S. farmers remain the most reliable suppliers of high quality wheat in the world.

thumbnail

By Stephanie Bryant-Erdmann, USW Market Analyst

It is no secret that global wheat production will fall this year due to unfavorable weather across the European Union (EU), Black Sea — Kazakhstan, Russia and Ukraine — and Australia. However, government policies are further constraining the global wheat supply, increasing costs and uncertainty for global wheat buyers.

Currently, there are two countries that have changed their export policies — Argentina and Ukraine — and a third, Russia, is thinking about it. These three countries account for an average 26 percent of global wheat exporter supplies and an average 50.7 MMT of global wheat exports. In Russia and Ukraine, the respective agricultural ministries are actively monitoring domestic wheat prices and wheat export quantities following a decline in 2018/19 production and rising domestic bread prices.

On Aug. 10, the Ukrainian Agricultural Ministry, in consultation with Ukrainian wheat traders, set the 2018/19 wheat export limit at 16.0 million metric tons (MMT), including 8.0 MMT of milling wheat. The export limit will cause Ukraine’s total wheat exports to fall by 7 percent year over year, but the milling wheat portion will fall by 20 percent compared to last year’s milling wheat export volume of 10.0 MMT. The export limit memorandum could be reviewed as early as the end of September, causing additional uncertainty about the availability of Ukrainian wheat.

On Sept. 3, the Russian Agricultural Ministry stated that it did not have plans to implement a grain export duty or “curb grain exports in any other way.” The Ministry released this statement following its second meeting with Russian grain exporters about export volumes in just 17 days. While the statement eased immediate concern from the markets (and resulted in 11 to 16 cent per bushel decreases for nearby wheat futures contracts on Sept. 4), the frequency of the meetings and letters obtained by Reuters have grain markets on edge.

As noted in the Aug. 23 Wheat Letter article A Risky Proposition, Russia implemented export taxes twice and completely banned wheat exports twice over the past decade. Each time, those policy changes resulted in significant, rapid price movement. Russia currently has an export tax on wheat that is set at zero percent, though it can adjust that tax at any time.

While Russia and Ukraine policies are adjusting to decreased domestic production and resulting increases in domestic prices, in Argentina, an export tax has been implemented in an attempt to shore up the domestic currency, which has fallen more than 50 percent compared to the U.S. dollar year over year. On Sept. 3, Argentina President Macri announced a 4 peso per dollar export tax on wheat and corn shipments.

According to International Grains Council (IGC) data, Argentine wheat has averaged $252 per metric ton (MT) since the beginning of the 2018/19 marketing year on June 1. This export tax will raise Argentine wheat prices by roughly 10 percent at today’s exchange rate of 39 Argentine pesos to 1 U.S. dollar, or about $25 per MT, on average. Argentine wheat production is expected to total 19.5 MMT, up 8 percent from 2017/18 and 35 percent above the 5-year average.

These policy changes and uncertainty from three of the world’s top wheat exporters come at a time when global wheat consumption is increasing and with it, the need for additional global exportable supply. USDA expects 2018/19 world wheat trade to rise 1 percent to a new record high of 184 MMT; if realized, it would be 6 percent greater than the 5-year average of 174 MMT.

With all of the uncertainty in the global wheat futures today, the U.S. wheat industry commitment to being the world’s most reliable supplier remains constant. Your local U.S. Wheat Associates representative stands ready to help with any questions about the U.S. marketing system, U.S. wheat supply and demand situation and U.S. wheat pricing.

To track U.S. wheat prices, subscribe to the USW Weekly Price Report.

By law, the only way to block U.S. grain exports is through a presidential declaration of national emergency. Importantly, a national emergency does NOT include short-term, fundamental rises in wheat prices or weakness in the U.S dollar. Further, the U.S. Constitution expressly forbids export taxes.

By Stephanie Bryant-Erdmann, USW Market Analyst

On Aug. 10, USDA increased its U.S. wheat export forecast to 27.9 million metric tons (MMT), up 14 percent from 2017/18, if realized. With 2018/19 global wheat production falling to 730 MMT, down 4 percent year over year, and supply in exporting countries shrinking to the lowest level in four years, USDA seems to anticipate global demand turning to U.S. wheat supply. That raises two questions:

  • Is there that much demand for U.S. wheat out there?
  • Can the U.S. grain transportation system handle the increase in wheat exports?

Is there that much demand for U.S. wheat out there?

Based on USDA estimates, global wheat trade will need to increase to a new record high of 184 MMT in 2018/19 to meet global wheat consumption. With Russia and the European Union (EU) wheat exports expected to decline by a combined 7.5 MMT in 2018/19, and the extreme drought in Australia threatening its exportable supply, it is logical that U.S. wheat supplies will fill a crucial role in global wheat consumption.

Still, the United States will need to record an additional 19.6 MMT of export sales in the remaining 42 weeks of the 2018/19 marketing year, which began on June 1, or an increase in weekly sales from an average of 409,300 MT to 466,000 MT. Put another way, the United States needs to sell about two more vessels of wheat per week to reach the USDA estimate.

However, nearly two-thirds of that increase could come from just the top 20 U.S. customers, excluding China, based on historic buying patterns. For example, the top five U.S. wheat customers — Japan, Mexico, the Philippines, Nigeria and Korea — imported an average of 11.4 MMT of U.S. wheat exports the past five years. U.S. export sales to many top customers are behind last year’s pace, traders report continued interest in U.S. wheat and note that many customers are engaging in “just-in-time” buying patterns that result in large, last minute shipments that are challenging logistically. And that leads to the question:

Can the U.S. grain transportation system handle the increase in wheat exports?

The short answer is, “it depends.” The slightly longer answer is, “it depends on weather and trade policies.” Both of which are relative unknowns at this point. One thing is certain. Winter is coming and will bring, as it always does to some extent, cold weather and snow across the U.S. Northern Plains and Pacific Northwest (PNW) and ice and fog on the Mississippi River system, along with associated commodity movement delays.

During the winter months of December, January and February, U.S. Gulf all grain exports — including corn, sorghum, soybeans and wheat — average 6.67 MMT per month, down 24 percent from the peak month of October when 8.81 MMT of grain typically moves through the ports. For comparison, PNW all grain winter month exports average 3.13 MMT per month. This is an average 19 percent below the PNW peak export month of October when all grain PNW exports average 3.86 MMT.

Trade policies will determine how much competition U.S. wheat exports face for freight and export elevation. U.S. Gulf grain exports center around four main commodities — corn, sorghum, soybeans and wheat, while U.S. PNW grain exports typically include barley, canola, corn, flaxseed, sorghum, soybeans and wheat. In the Gulf, soybeans account for roughly two-thirds of total grain shipments during the peak fall months of October and November. In the PNW, it is closer to 75 percent.

USDA’s August estimate is based on the current, enacted trade policies. As such, USDA expects U.S. feed grain and soybean exports to decrease by a combined 3.53 MMT year over year due primarily to decreased demand from China. In theory, reduced U.S. feed grains and soybean exports should increase freight and export elevation availability for wheat. However, through Aug. 16, there are already 8.86 MMT of U.S. corn export sales booked for the 2018/19 marketing year (beginning Sept. 1).  That is up 54 percent from last year and 12 percent above the 5-year average. U.S. soybean export sales for the new marketing year (beginning Sept. 1) are also up 45 percent year over year at 11.5 MMT. That increased drain on export capacity and the tightening global feed grain supply situation, as discussed in Ahead of USDA Report, Wheat Futures on a Powder Keg, indicate there may be upside potential for USDA’s estimates even with the existing uncertainty around U.S. trade policies. Customers should carefully watch the corn, soybean and feed grain supply and demand situation as it will impact freight and export elevation demand. While the expectation is that U.S. soybean and corn exports will be down, right now the data suggests otherwise.

With increased global demand for U.S. wheat likely and an uncertain outlook for U.S. transportation logistics, customers should take a serious look at the benefits of securing U.S. wheat supplies now. As always, the U.S. wheat store is open and ready to supply high-quality wheat — there just may be longer lines at checkout this year.

thumbnail

By Stephanie Bryant-Erdmann, USW Market Analyst

USDA updated its monthly World Agricultural Supply and Demand Estimates (WASDE) on August 10 and expects the global wheat supply and demand situation to be more favorable for U.S. farmers this year due to shrinking global wheat production. USDA lowered its global wheat production estimate by 6.63 million metric tons (MMT) to 730 MMT, down 4 percent year over year and the lowest level since 2014/15, if realized.

Widespread drought across Germany and northern Europe is one reason why USDA dropped its production forecast. USDA expects European Union total wheat production to fall to 138 MMT, 9 percent below both the 5-year average and 2017/18 production. With smaller EU wheat production, USDA lowered marketing year 2018/19 (June 1 to May 31) EU wheat exports to 23.0 MMT. If realized, that would be 2 percent below the year prior, and 25 percent below the 5-year average.

At the same time, USDA also expects Russian wheat production to fall 20 percent year over year to 68.0 MMT due to unfavorable winter wheat planting and growing conditions. With Russian wheat supplies shrinking, the 2018/19 Russian wheat export forecast is down 7.00 MMT from 2017/18 to 35.0 MMT.

With lower exportable wheat supplies (production plus beginning stocks minus domestic consumption) in Russia and the EU, USDA expects the United States to have the largest exportable supply of wheat in the world in 2018/19 at 49.7 MMT.

Consequently, USDA expects 2018/19 U.S. wheat exports to reach 27.9 MMT, up 14 percent from 2017/18 and 7 percent above the 5-year average, if realized. Still, U.S. wheat export sales pace will need to increase to meet this goal, as year-to-date U.S. wheat export sales total just 7.53 MMT or 27 percent of USDA’s anticipated total.

The shrinking global wheat supply, increasing global wheat consumption and large U.S. wheat supply have all lead to U.S. wheat futures rallies over the past month. Since the last WASDE update on July 12, U.S. HRW futures are up 72 cents per bushel ($26 per MT), SRW futures grew 54 cents per bushel ($20 per MT) and HRS climbed 67 cents per bushel ($25 per MT).

Each month, U.S. Wheat Associates (USW) updates a graphic summary of USDA’s WASDE (World Agricultural Supply and Demand Estimates) report. View the August summary here.

thumbnail

By Stephanie Bryant-Erdmann, USW Market Analyst

Wheat prices are in for a wild ride. Just last week, all it took to trigger a limit up move in futures prices was a rumor that Ukraine might restrict milling wheat exports. Although the market took back most of those gains after the rumor was retracted, Chicago soft red winter (SRW) futures ended the week up 5 percent while Kansas City hard red winter (HRW) climbed 6 percent and Minneapolis hard red spring (HRS) increased 3 percent.

That short-term volatility is indicative of how tightly wound global wheat markets are, and the next big price move could be triggered on Aug. 10 when USDA updates its monthly World Agricultural Supply and Demand Estimate (WASDE). We will look for factors that could trigger additional price moves including changes to production, export demand and world feed grain supply estimates.

Shrinking Global Wheat Production. A saying among wheat people suggests that at harvest, “big crops get bigger and small crops get smaller.” This seems to be a “small crop” year with analysts and traders alike expecting USDA to reduce world production estimates based on new harvest numbers from France, Germany, Poland and Russia. Current estimates from Stratégie Grains put EU common wheat production (excluding durum) below 130 MMT, down 8 percent year over year if realized.

The Russian Ministry of Agriculture expects 2018/19 Russian wheat production to total 64.4 MMT, down 25 percent from the year prior. According to analysts at IKAR, sprouting and disease pressure from late season rains further decreased Russian exportable supply. Australian wheat production may also be reduced as the region that produces Australian Prime Hard and Australian Hard wheat is experiencing “the worst drought in living memory.”

Bullish supply news has pushed both U.S. and global wheat prices higher in recent weeks. Since July 13, U.S. HRW futures are up 75 cents per bushel ($28 per metric ton [MT]), SRW futures grew 59 cents per bushel ($22 per MT) and HRS climbed 81 cents per bushel ($30 per MT). At the same time, free-on-board (FOB) prices paid by Algeria and Egypt for wheat in public tenders have increased an average 90 cents per bushel ($33 per MT).

Changes to Wheat Exports. United States. Despite global FOB wheat prices climbing at a faster rate than U.S. wheat futures, U.S. wheat exports remain slow. Through July 27, U.S. wheat export sales totaled 7.20 MMT, down 28 percent from 2017/18. That pace must quicken soon to meet USDA’s current U.S. wheat export forecast of 26.5 MMT.

Ukraine. Each year, the Ukraine Agricultural Ministry signs a memorandum with grain exporters outlining an agreed volume of milling wheat trade not subject to government restriction. This year, the proposed volume is 8.0 MMT, down from 10.0 MMT exported in 2017/18. Milling wheat exports generally make up a little more than half of the country’s wheat exports. In July, USDA forecast Ukraine total wheat exports (milling and feed wheat) at 16.5 MMT, down 1.0 MT from 2017/18.

Decreases to the Global Feed Grain Supply. While higher wheat prices would normally ration feed wheat demand, tightening global feed grain supply and demand is creating a price floor for global wheat prices. USDA expects global feed grain consumption — barley, corn, mixed grains, oats, rye and sorghum — to outpace global feed grain production by 34.1 MMT in 2018/19. With global consumption outpacing global production for the second year in a row, USDA anticipates global feed grain ending stocks falling to 179 MMT, the lowest level since 2012/13.

As we have suggested (Lower U.S. Wheat Prices Are an Anomaly and An Excellent Opportunity), U.S. and global wheat prices are sitting on a powder keg with an anticipated global stocks-to-use ratio (excluding China) of 19 percent, a level that has not been seen since 2007/08. Both U.S. and global wheat prices have rallied in recent weeks. Continued reports of quality damage and lower yields in the EU and Russia and drought conditions in Australia indicate the 2018/19 crop is shrinking. If last week’s limit up movement is any indication, wheat prices could go much higher very quickly if additional bullish news comes out.

To track U.S. wheat export basis levels and prices, subscribe to the USW Weekly Price Report.