thumbnail

By Stephanie Bryant-Erdmann, USW Market Analyst

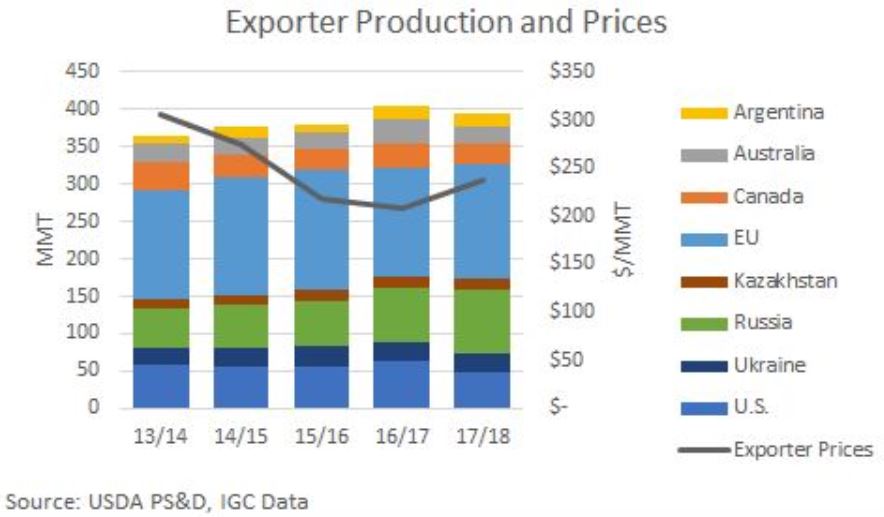
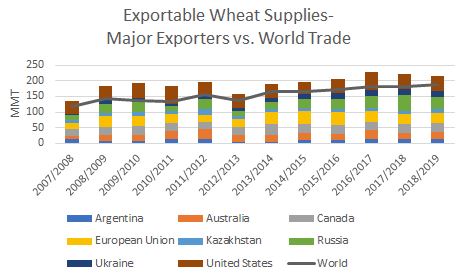
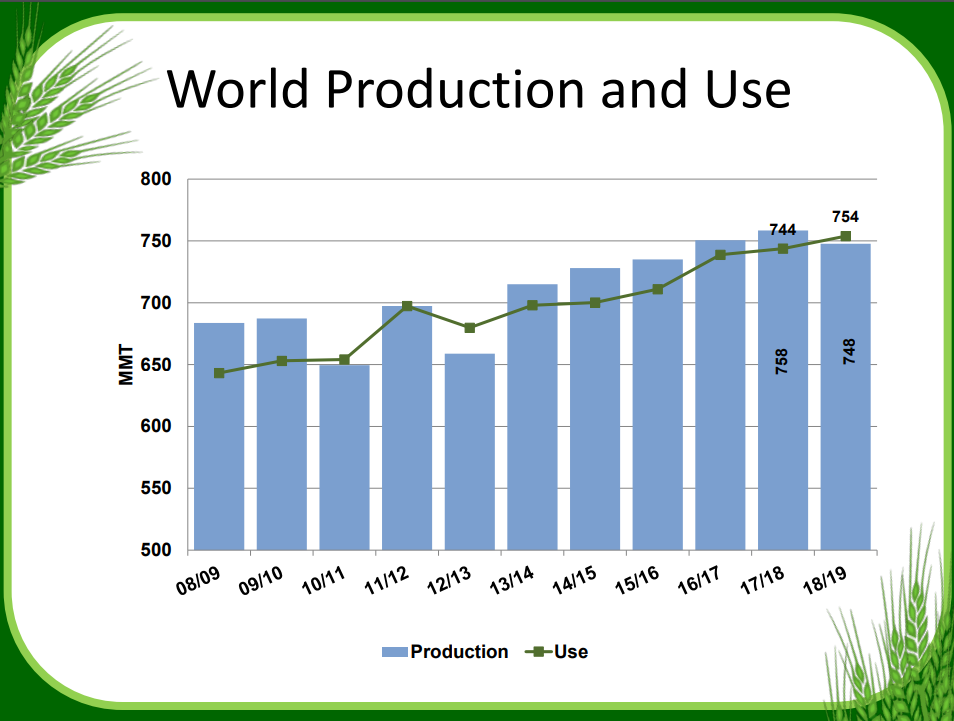
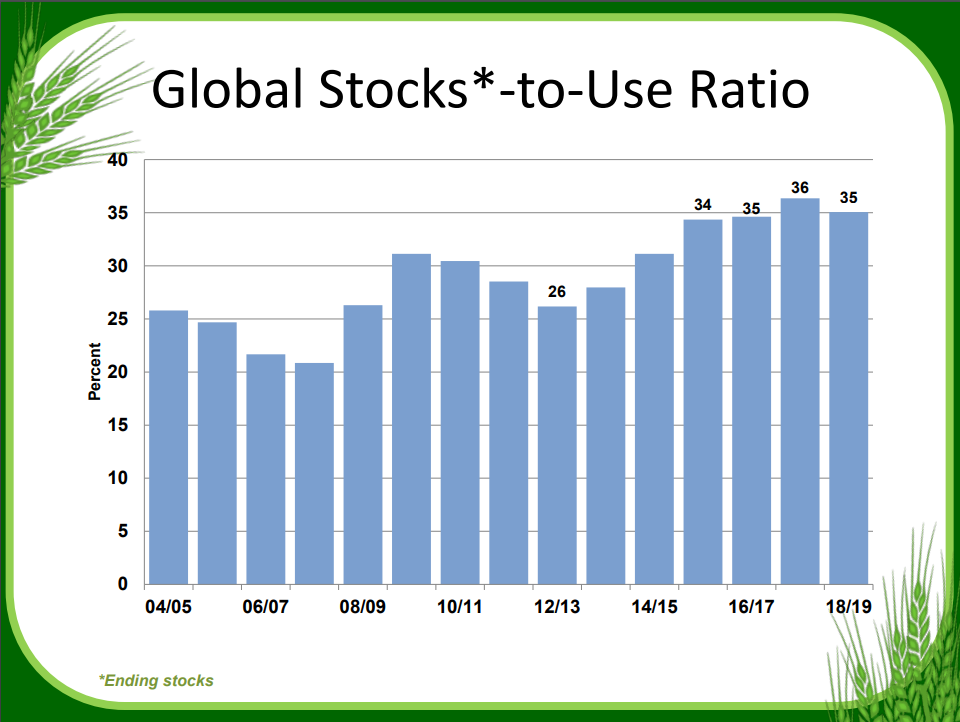
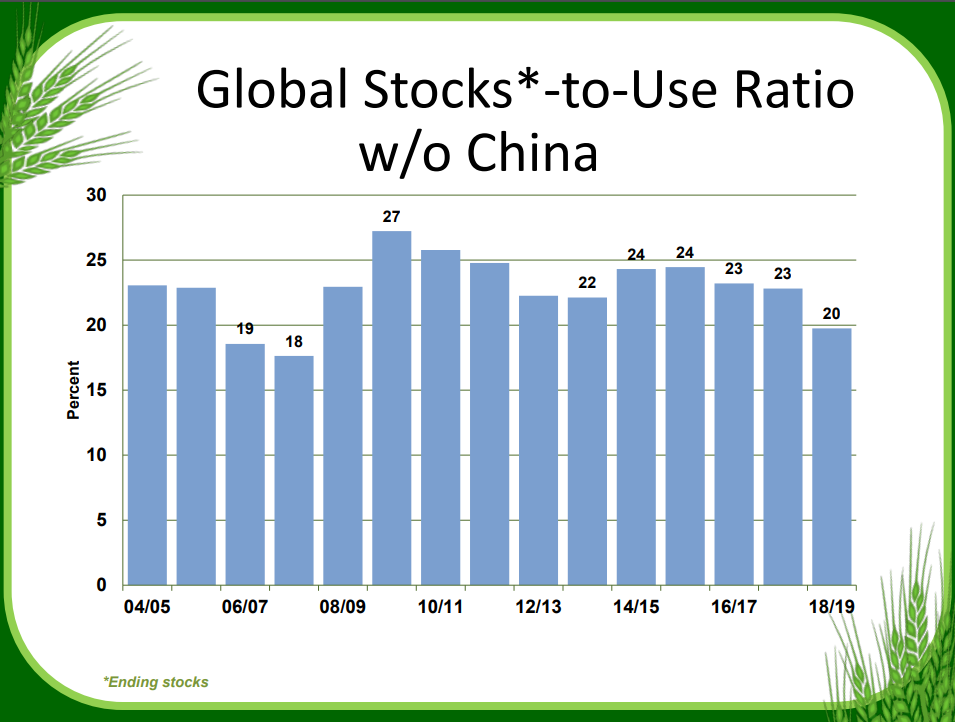
With the world consuming more wheat than it produces for the first year since 2012/13, prices are also on the rise. According to Global Trade Atlas data, the average global wheat price increased 4 percent year over year to $203 per metric ton (MT) in 2017/18 (June 1 to May 31). Most of that price increase occurred in the last five months of the marketing year as the market digested lower Northern Hemisphere wheat production estimates and strong demand for 2018/19.

Here is a by-country look at current production estimates and the average wheat prices (noting that prices vary by class and quality) from major exporting countries and regions.

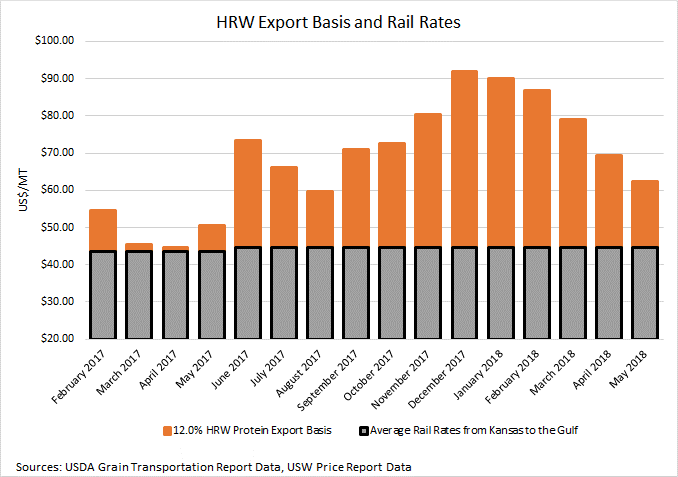
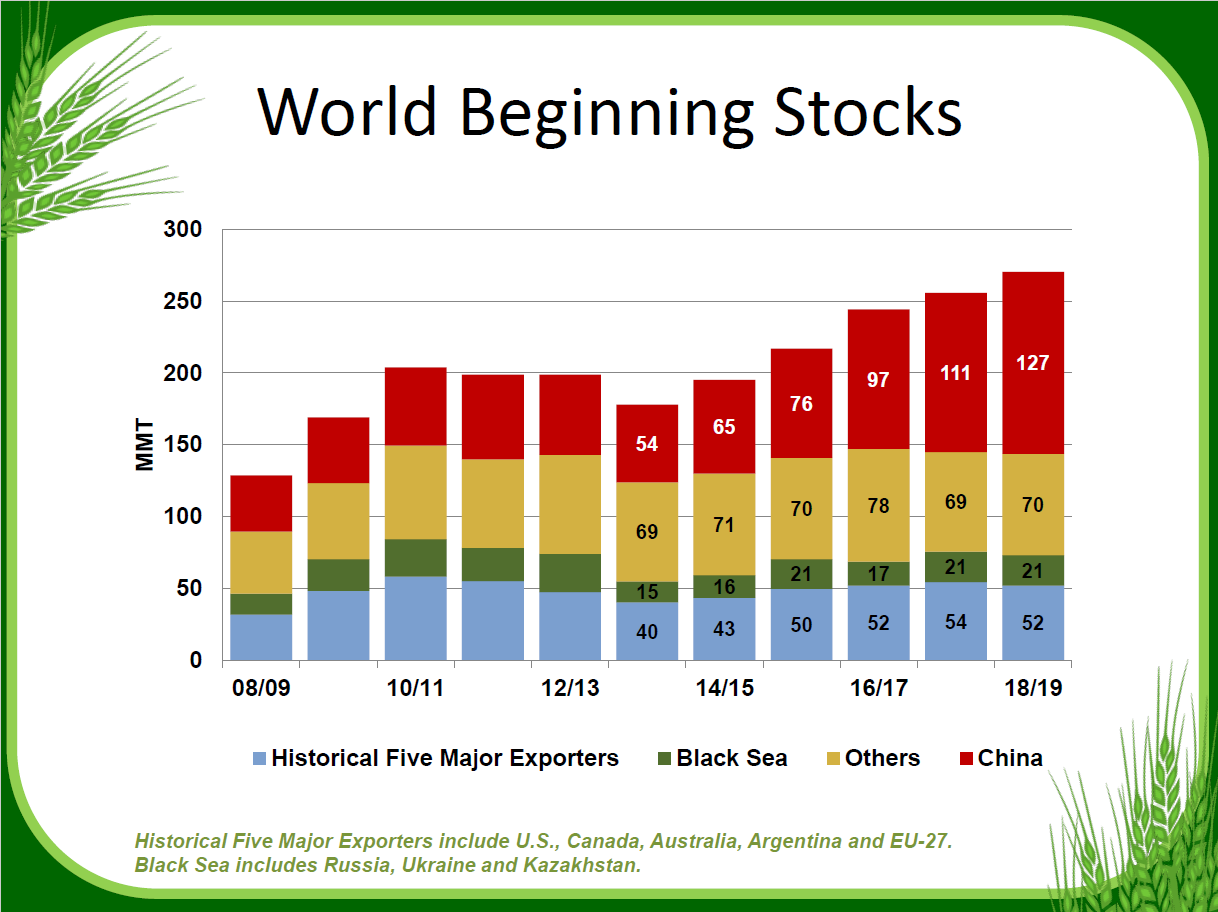
United States. According to the U.S. Wheat Associates Price Report, the average price for U.S. wheat rose an average $47 per MT from one year ago. Hot, dry conditions in the U.S. hard red winter (HRW) growing region decreased yield potential and pushed prices up for this largest U.S. wheat class. USDA forecasts U.S. 2018/19 wheat production at 49.7 million metric tons (MMT), up 5 percent year-over-year, but still 11 percent below the 5-year average. U.S. beginning stocks are estimated at 29.4 MMT, down 8 percent from 2017/18, but still 28 percent above the 5-year average. Increased U.S. wheat production is expected to offset the lower U.S. beginning stocks and total U.S. supply is expected to remain stable year over year at 79.1 MMT.

Canada. The International Grains Council (IGC) reported the average price for Canada Western Red Spring (CWRS) at 13.5 percent protein (13.5 percent moisture basis) from Vancouver rose to $255 per MT in May. This is up $24 per MT from May 2017 and reflects the tighter global supply and demand picture. On June 21, Agriculture and Agri-Food Canada (AAFC) forecasted 2018/19 common wheat production (excluding durum) at 25.4 MMT, up slightly from 2017/18. A 15 percent bump in spring wheat planted area contrasts with an 11 percent drop in winter wheat planted area. Predicted 2018/19 durum production will increase 15 percent to 5.7 MMT due to an 11 percent year over year increase in planted area. The global supply and demand situation for durum wheat is also supporting prices. Canadian durum prices at $282 per MT are an average $7 per MT above 2017 levels.

European Union (EU). IGC reported the average French wheat price reached $205 per MT in May, up from $187 per MT the year prior. French production is expected to increase to 37.8 MMT, up 4 percent due to higher expected yield and larger planted area. 2018/19 EU wheat production is expected to fall 1.80 MMT from 2017/18 to 140 MMT according to Stratégie Grains, which is providing continued price support for exportable French supplies.

Australia. The current average price for Australian wheat of $239 per MT is up 22 percent year over year according to IGC data, which point to lower carry-in stocks and hot, dry conditions. In June, the Australian Bureau of Agricultural and Resource Economics and Science (ABARES) forecasted 2018/19 Australian wheat production to rise 3 percent from 2017/18 to 21.9 MMT, despite a 3 percent decrease in planted area to 29.5 million acres (12.0 million hectares).

Argentina. In May, the average price for Argentine wheat reached $261 per MT according to IGC data. That is up 38 percent year over year. This month, the Buenos Aires Grain Exchange reported Argentine farmers see higher revenue potential and expects them to plant 7 percent more area to wheat in 2018/19, reaching 15.1 million acres (6.1 million hectares). USDA’s June estimate for 2018/19 Argentina’s wheat production was 19.5 MMT (716 million bushels), up 8 percent from 2017/18 and 35 percent greater than the 5-year average.

Black Sea (Russia, Ukraine and Kazakhstan). The average price for Russian 4th grade milling wheat (8.8 to 10.5 percent protein on a 12 percent moisture basis) reached $213 per MT in May, up 14 percent from the year prior according to IGC. Expectations for lower 2018/19 production in the Black Sea region are supporting export prices. USDA projects combined 2018/19 output from Russia, Ukraine and Kazakhstan will drop 14 percent to 109 MMT (4.00 billion bushels) based on an expected return to trendline yields. If realized, the combined harvest would still be greater than the 5-year average.

At the end of May, the Russian Meteorological Service noted hot, dry conditions threatened winter wheat in Russia’s southern regions, which have not received rain since April. Conversely, cold wet weather is delaying spring wheat planting in other regions. To date, 23.3 million acres (9.43 million hectares) of spring wheat has been planted, compared to the 2017/18 total spring wheat area of 30.9 million acres (12.5 million hectares). Russian consultancy SovEcon forecasted Russian wheat production to decline to 77.0 MMT (2.83 billion bushels), down 10 percent from 2017/18.

UkrAgroConsult reported Ukrainian wheat planted area increased 2 percent year over year to 15.5 million acres (6.28 million hectares). The Ukrainian meteorological service expects wheat yields to fall 8 percent year over year to 56.5 bu/acre (3.80 MT/ha). 2018/19 Ukrainian wheat production is forecast at 23.9 MMT (878 million bushels), compared to 25.4 MMT (933 million bushels) in 2017/18.

IGC expects yield declines and smaller planted area will lower Kazakhstan wheat production to 13.7 MMT (503 million bushels), down 7 percent from 2017/18, if realized.

thumbnail

By Stephanie Bryant-Erdmann, USW Market Analyst

In its June World Agriculture Supply and Demand Estimates (WASDE), the U.S. Department of Agriculture (USDA) noted that global wheat consumption is expected to exceed global wheat production for the first time since 2012/13 (June 1 to May 31). USDA estimated 2018/19 global wheat consumption at a record 751 MMT, up 7.7 MMT from 2017/18. Human consumption is driving this growth and is expected to increase 2 percent or 10.5 MMT, which is good news for everyone involved in the milling wheat supply chain, including U.S. farmers who are uniquely positioned to meet the demand.


In 2018/19, the United States will hold the largest exportable supply of wheat in the world (production plus beginning stocks minus domestic consumption). USDA’s forecast for U.S. exportable supply of wheat is 49.7 MMT, accounting for 22 percent of world wheat exporter stocks. If realized, that is 8.2 MMT more than Russia and 13.9 MMT more than the European Union (EU).

This large exportable supply of high-quality milling wheat highlights the importance of trade to everyone’s bottom line. USDA projects world wheat trade to increase 2 percent from 2017/18 to a record high 187 MMT (6.88 billion bushels), and the United States is expected to have 14 percent market share by volume.

USDA predicts that total 2018/19 imports by most top U.S. wheat customers will remain stable year-over-year or increase slightly. Mexico, the top U.S. wheat importer the past two marketing years, is expected to increase total wheat imports by 8 percent year-over-year to 5.5 MMT. If realized that would be 14 percent above the 5-year average.

USDA expects Japan, the top U.S. customer over a 5-year period, will import an estimated total of 5.8 MMT, down 3 percent from 2017/18. Total wheat imports by both the Philippines and China will remain stable year-over-year at 5.8 MMT and 4.00 MMT, respectively. Nigerian imports are expected to grow year-over-year to 5.5 MMT, 17 percent from the 5-year average. Korean total wheat imports will increase 5 percent year-over-year to 4.6 MMT. USDA also expects Indonesia to import a record 12.5 MMT of wheat in 2018/19, up 4 percent from the year prior and 33 percent greater than the 5-year average.

The growth in total wheat imports in these countries is driven by increasing demand for high-quality wheat products. In the top 20 U.S. wheat markets, human wheat consumption is expected to increase about 3.6 MMT year-over-year with the largest increases noted in China and Indonesia.

Additionally, in those markets where the United States has a majority market share (greater than 50 percent), but that fall outside the top 20, such as Honduras, Costa Rica and Jamaica, human consumption is expected to grow an average 2 percent in 2018/19.

With wheat consumption driven by “sticky” food demand, the long-term outlook for global wheat demand is strong. The short-term outlook for demand is also pointing to higher prices for wheat with USDA expecting 2018/19 global wheat production to fall for the first time in 5 years due to forecast production declines in half of the major exporting countries. All of which is good news for U.S. farmers who are ready to meet the global demand for high-quality milling wheat.

To track U.S. wheat harvest, subscribe to the USW Weekly Harvest Report.

To track U.S. wheat export prices and stay updated on global wheat forecasts, subscribe to the USW Weekly Price Report.

thumbnail

By Stephanie Bryant-Erdmann, USW Market Analyst

Since the beginning of the calendar year, export cash prices for hard red winter (HRW) wheat prices have rallied an average 73 cents at the Gulf across all protein levels. However, export cash prices are made up of two components — wheat futures and export basis. Most of the export price rally matches the futures market, which climbed from $4.37 per bushel in January to $5.64 per bushel on May 25. However, U.S. Wheat Associates (USW) and the farmers it represents also face historically high rail rates that support the export basis.

The futures rally is based on two fundamental factors — drought in the U.S. HRW-growing area, which is shrinking the U.S. HRW supply, and concern about poor crop conditions around the world, which the market believes is increasing potential demand for U.S. HRW.

On May 10, USDA forecast global world wheat consumption to outpace global wheat production in 2018/19 for the first time since 2012/13 due to reduced production in Russia, Ukraine and Kazakhstan. The growing demand for wheat around the world and the expectation of smaller Black Sea supplies are pushing up U.S. export prices.

As of May 31, the U.S. Drought Monitor reported that the Oklahoma and Texas panhandles and 75 percent of Kansas are still in a moderate to exceptional drought. The corresponding wheat condition ratings reflect the effects: USDA rated 48 percent, 63 percent, and 54 percent of HRW in poor or very poor condition, respectively, in the region.

The market also expects the drought to help increase new crop HRW protein levels (although the data to support that expectation is not yet available). This has caused protein premiums and discounts to erode. In the Gulf, the protein premium for 12.0 percent protein (12 percent moisture basis) HRW over 11.5 percent protein (12 percent moisture basis) fell from an average $23 per MT ($0.64 per bushel) in January to $8 per MT ($0.21 cents per bushel) year to date in May (See “HRW Export Basis and Rail Rates”). Similarly, the average protein premium for 11.5 percent protein over 11.0 percent protein (12 percent moisture basis) fell an average ($0.35 per bushel) during the same time frame.

The declining protein premiums for HRW partially offset the futures rally, and export cash prices for 12.0 percent protein and 11.5 percent protein (12 percent moisture basis) HRW in the Gulf remain below the respective 5-year averages.

However, while the weather fundamentals are dominating the news, there is also a third factor that is quietly playing a role in U.S. export prices — increased U.S. rail rates. According to USDA/Agricultural Marketing Service Grain Transportation Report data, year-to-date in 2018, the average cost of railcar transportation for wheat from Kansas to the Gulf is $45 per MT ($1.21 per bushel). That is the highest level since USDA began tracking rail rates in 2010. Rail rates for wheat will increase to a new record high this summer according to notices that went out to customers in March and April.

Rail rates are a key component of export basis, which also includes elevation, barge freight and labor costs. Yet the cost of transporting wheat is shared by the farmer and the overseas customer through country elevator basis levels and export basis levels. Consequently, higher rail rates act as both a ceiling for farm gate prices and simultaneously as a floor for export prices.

On the export basis side, this can most easily be seen in the export basis levels for ordinary or unspecified protein wheat. Year-to-date in 2018, ordinary protein HRW export basis has averaged $42 per MT ($1.15 per bushel), compared to $27 per MT ($0.74 per bushel) in 2017, when the average rail rate from Kansas to the Gulf (See “HRW Export Basis and Rail Rates”) was $43 per MT ($1.18 per bushel).

As customers ride out the market volatility that always occurs this time of year, they should keep in mind that U.S. export basis levels are supported by increased transportation costs, and the 2018/19 global stocks to use ratio without China is forecast at a tight 20 percent as noted in the USW May 17 Wheat Letter article “Chinese Wheat Stocks Mask Tight Stocks to Use Ratio.”

thumbnail

By Stephanie Bryant-Erdmann, USW Market Analyst

On May 10, USDA forecast the 2018/19 global wheat supply to hit a record 1,018 million metric tons (MMT) despite the expectation that global wheat production will fall for the first time in 5 years to 748 MMT.

At the same time that global wheat production is expected to decrease, global wheat consumption is expected to reach a new record of 754 MMT, 5 percent above the 5-year average.

The reason global wheat supplies continue to grow is because of an anticipated 6 percent year over year increase in beginning stocks — 47 percent of which are in China. This large percentage of global wheat stocks residing in China’s wheat stocks are masking an otherwise declining global wheat supply.

By the end of 2018/19, USDA expects Chinese ending stocks to total 139 MMT, 52 percent of global wheat ending stocks.

Because China’s endings stocks are masking the declining global wheat supply, the traditional stocks-to-use ratio is 35 percent.

However, when Chinese stocks and use are removed from the ratio, the 2018/19 global stocks-to-use ratio falls sharply to 20 percent, the tightest stocks-to-use ratio since 2007/08.

Buyers should continue to monitor conditions around the world and recognize that global wheat supplies are much tighter than traditional global supply and demand estimates show.

View the U.S. Wheat Associates full 2018 May World Wheat Supply and Demand Situation Graphic Summary.

thumbnail

By Stephanie Bryant-Erdmann, USW Market Analyst

At first glance, the USDA April 10 World Agricultural Supply and Demand Estimates (WASDE) held very few surprises for wheat. Most reviewers would consider this a bearish report with another increase in predicted U.S. and global wheat ending stocks. However, a somewhat unnoticed factor was increased global wheat feed use, now forecast at 146 million metric tons (MMT), 7 percent above the 5-year average. This was due largely to shrinking supplies of traditional feed grains. With an average 19 percent of global wheat production being used as feed each year, the current feed grain supply and demand situation has implications for wheat.

A deeper look at the feed grain situation shows the most striking decrease was in global corn production, which fell 4 percent year over year to 1.04 billion metric tons due to sharply lower production in drought-stricken Argentina and lower second-crop corn production in Brazil. At the same time, 2017/18 corn feed demand grew 18.0 MMT. These facts set up a total stocks-to-use ratio of 19 percent. However, it is important to note that China holds 40 percent of the world’s corn stocks, which will not leave the country.  Removing China from the equation brings the stocks-to-use ratio down to 14 percent.

The constrained corn supply caused USDA to reduce global corn feed demand by 4 MMT from the prior month’s estimate of 654 MMT. In addition to reduced corn feed use in Argentina, USDA noted decreased corn feed demand in the European Union (EU) with a corresponding increase in wheat feed demand. EU 2017/18 wheat feed use is expected to reach 58.5 MMT, 9 percent above the 5-year average, if realized.

While corn had the most precipitous drop in supply and increase in demand, global production of barley, millet, oats and sorghum also fell in 2017/18, while rye remained stable year over year. Including corn, global feed grain production fell 4 percent or 49.9 MMT year over year in 2017/18, while global feed grain consumption increased 15.1 MMT. The increased consumption and decreased supply of traditional feed grains will cut 2017/18 ending stocks for those grains by 38.8 MMT.

With the global feed grain supply tightening, prices for those commodities continue to rise. Since the beginning of 2018, world feed barley prices increased an average $19 per metric ton (MT), global sorghum prices averaged a $15/MT increase, and the average world corn price increased $26 per MT, according to International Grain Council (IGC) data. Supported by increased feed wheat demand, global wheat prices also increased an average $9 per MT.

With feed grain prices increasing, farmers around the world have taken notice and are expected to plant more corn, barley and sorghum in 2018/19 — at the expense of wheat.

IGC expects 2018/19 global wheat harvested area to fall to a six-year low of 538 million acres (218 million hectares), down 1 percent from 2017/18 levels. The analyst group expects generally favorable Northern Hemisphere weather to increase global yields and partially offset the reduced planted area. Still, IGC currently forecasts 2018/19 global wheat production to fall 17 MMT year over year to 741 MMT.

Weather news is dominating the futures markets right now, but customers should be mindful of the feed grain situation, which is slowly siphoning some of the world’s excess wheat stocks in 2017/18 and switching wheat planted area to feed grains.

To track U.S. wheat prices, please subscribe to the U.S. Wheat Associates (USW) Weekly Price Report.

thumbnail

By Vince Peterson, USW President

U.S. Wheat Associates (USW) President Vince Peterson traveled to Australia last month to speak to an Australian farmer organization about what the future might hold for wheat farmers around the world. His message was far more upbeat than might be expected at a time when U.S. wheat planted area is historically low and Russian wheat production and export demand in on the rise.

Peterson shared this summary of his presentations for Wheat Letter.

There is no doubt that Russian wheat has benefited from record yield after record yield for the last five years leading to an 85 million metric ton (MMT) year in 2017. That yield was about two-thirds of a metric ton per hectare greater than its trend line projection. Digging deeper, though, it is interesting to note that Russia has not increased its wheat planted area all that much. It is about 3 million hectares on the trend line. Its farmers have increased land area planted to “other crops” at more than double the rate they increased wheat. Russian farmers and investors, like their counterparts around the world, will be looking for the best possible return on that land. As the cropping trend continues, it implies a shift in future growth away from a wheat concentration to broader diversification of crops.

Buyers and other industry analysts also need to remember that Russia has, on average over the past five years, sold more than 80 percent of its wheat exports to buyers in Africa and the Middle East. Those regions are wheat production deficient — and per capita wheat consumption in many of those countries is very high. Population in those regions will grow by 1.3 billion people who will collectively eat at least another 60 MMT of wheat every year and about 50 MMT of that increased demand will likely need to be imported.

In addition, the final cost of imported wheat, rather than end-product quality, weighs most heavily in these same markets. The signals from these buyers back to Russian wheat farmers will continue to be a need for low to moderate protein wheat at very low, delivered prices.

Rightly so, markets in Russia’s “backyard” will represent its most profitable export opportunity. In turn, these market factors offer limited incentives for Russian farmers to produce high performing wheats for far off markets.

Freight costs matter, too. The cost of moving wheat has shifted wildly over the past 15 years. The commodity spikes in 2007 to 2012 in both prices and trade volume, fueled by the price of petroleum reaching $140 per barrel, pushed ocean freights to outlandish numbers about 10 years ago. That provided an incentive for ship building and expansion that more than doubled the dry bulk carrier fleet.

The growing cargo fleet capacity peaked in 2015. In 2016, for the first time in a dozen years, the fleet capacity began to decline. Ocean freight rates quickly hit bottom so Russia could afford to move wheat almost everywhere. That pendulum is now starting to swing back. Oil prices have moved back up; the ship supply will continue to shrink with fewer new commissions and increased demolition/scrapping. It is likely the next cycle will “normalize” with freight rates back at least at moderately higher levels that are profitable for ship owners. The next cycle is going to make it far more expensive, and far less economical, for Russia (and any origin, for that matter) to be shipping their wheat half way around the globe into a competitor’s backyard. Particularly if those supplies are just of moderate to fair quality parameters.

So, my crystal ball conclusion is that the influence of Russian wheat is not done growing, but the outlook for other global suppliers is much more positive. While Russia’s wheat industry is here to stay as a main player in the world market, it will behave more responsibly to these changing market signals in the next 20 years, making this next cycle far different for the United States, Canada, Australia and other suppliers than it has been in the past 20 years.

thumbnail

By Stephanie Bryant-Erdmann, USW Market Analyst

According to the March 29 USDA Prospective Plantings report, U.S. total spring-planted area will jump to an estimated 14.1 million acres (5.71 million hectares), 12 percent above 2017/18, if realized. The estimate includes 12.1 million acres (4.90 million hectares) of hard red spring (HRS), up 17 percent from 2017, if realized. It is important to note that this is an estimate, as farmers in the top four HRS producing states of Minnesota, Montana, North Dakota and South Dakota have not started planting due to extremely cold, snowy weather across the region.

USDA expects a 1.05 million acre (425,000 hectare) increase in North Dakota spring wheat area, which is forecast at 6.40 million acres (2.59 million hectares). If realized, that would be up 20 percent year over year. Spring wheat acres in Minnesota are also expected to increase 38 percent from 2017/18 levels to 1.6 million acres (648,000 hectares). South Dakota 2018/19 HRS planted area is forecast at 1.05 million acres (425,000 hectares), up 80,000 acres (32,000 hectares). However, the planting window for spring wheat in North Dakota and Minnesota is no more than three weeks; after that the yield potential starts to decrease and farmers choose to plant alternative crops.

“This cold, wet spring could work against spring wheat planting in eastern North Dakota and western Minnesota,” said Mike Krueger, an independent market analyst based in North Dakota. “Farmers in these areas are reluctant to plant spring wheat after late April and right now the forecast is calling for another two weeks of cold weather and snow. If planting is delayed until May, we will probably see a switch to soybeans or other crops.”

USDA forecast Montana HRS planted area at 2.50 million acres (1.00 million hectares), in line with 2017/18 planted area. But, in contrast to eastern North Dakota and western Minnesota, the late spring may increase HRS planted acres in parts of Montana according to Cassidy Marn, marketing program manager with the Montana Wheat & Barley Committee.

“Farmers in Montana have fewer alternatives and, since we can only grow limited quantities of corn and soybeans here, wheat tends to be the last alternative,” said Marn. “Planting peas and lentils is possible, but given the amount of snow we still have on frozen ground, some farmers could miss the window for those crops. Planting spring wheat in June is not ideal, but it is preferable to planting nothing.”

USDA expects U.S. durum planted area to total 2.00 million acres (809,000 hectares), down 13 percent from 2017/18, if realized. The predicted decline is driven in large part by USDA’s expectation that North Dakota farmers will switch from durum to HRS or oilseed crops due to lower returns on durum in recent years. In addition, growers near the border are frustrated by a large volume of durum freely crossing the border from Canada that increases pressure on durum prices. Weather conditions will also affect durum planting decisions.

USDA also updated the winter wheat planted area from its January 2018 estimate, increasing winter wheat planted area by 50,000 acres (20,000 hectares) to 32.7 million acres (13.2 million hectares). The new estimate is still 2 percent below the 2017/18 planted area. The increase came from hard red winter (HRW) area, estimated at 23.2 million acres (9.39 million hectares), up slightly from the previous projection, but still 2 percent below the year prior and 17 percent below the 5-year average.

The decreased HRW planted area makes crop conditions even more crucial. The April 2 USDA Crop Progress report rated 10 percent of Kansas HRW, 9 percent of Oklahoma HRW and 17 percent of South Dakota winter wheat as good, with virtually none of the crop rated as excellent in those states.

Soft red winter (SRW) planted area decreased from the previous estimate to 5.85 million acres (2.37 million hectares), but is still 4 percent above 2017/18 planted area. Overall, conditions for SRW are similar to what growers faced at the same time last year with a majority of the crop rated in good to excellent condition.

USDA expects white wheat acres — planted in both winter and spring — to reach 4.15 million acres (1.68 million hectares) for 2018/19, up 3 percent from 2017/18, but in line with the 5-year average. The U.S. Drought Monitor shows adequate moisture for Washington, but southern Idaho and Oregon are experiencing abnormally dry to moderate drought conditions. Still, USDA reported that the majority of the white wheat crop in those states are in good to excellent condition.

The expected increase in spring wheat area would increase total U.S. wheat planted area to 47.3 million acres (19.1 million hectares) in 2018/19, up 3 percent year over year. The increase was unexpected, but if realized it would still be the second lowest planted wheat area since 1919 when USDA records began.

As always, spring brings the waiting game — all we can do is watch how the crops respond to conditions going forward.

thumbnail

By Stephanie Bryant-Erdmann, USW Market Analyst

Farmers will tell you that winter wheat is a hardy plant; but for the current U.S. winter wheat crop, one of its most important inputs, water, is increasingly in short supply. The Feb. 1 U.S. Drought Monitor showed that drought ranging from abnormally dry to extreme, affects most of the winter wheat production area across the country. Specifically, 81 percent of Oklahoma is in a severe to extreme drought, while 65 percent of Kansas is in a moderate to extreme drought. In South Dakota and Colorado, 64 percent and 59 percent of the topsoil moisture was rated as short to very short, respectively.

USDA noted the drought’s impact on winter wheat crop conditions in its monthly winter wheat crop condition report* on Jan. 29, which showed 29 percent of the area assessed by the survey is in good to excellent condition, down from 41 percent good to excellent at the end of December. USDA rated 35 percent in fair condition and 37 percent in poor or very poor condition, up from 22 percent last month. The assessment covered 69 percent of the estimated 32.6 million acres (13.2 million hectares) planted for 2018/19.

Deteriorating crop conditions could multiply the effect of low planted area to decrease 2018/19 U.S. winter wheat production. USDA noted the 2018/19 winter wheat planted area is 15 percent below the 5-year average in its Jan. 12 Winter Wheat and Canola Seedings report, which is the second lowest number of planted winter wheat acres on record.

Of the winter wheat classes, hard red winter (HRW) is the most severely affected by drought. USDA reported 23 percent of HRW assessed acres are in good to excellent condition, compared to 35 percent in December. Forty-two percent of HRW acres were rated in poor or very poor condition, up from 25 percent one month prior. The only major HRW state not assessed last week was Texas, where 5 million acres (2.02 million hectares) of winter wheat were planted for 2018/19. However, precipitation maps show it has not rained in 110 days in Northern Texas (accounting for about 60 percent of Texas wheat production). In response to these reports, the Kansas City Board of Trade (KCBT) March wheat contract rallied 20 cents last week to $4.63/bu ($170/MT), the highest point since July 2017.

Soft red winter conditions are variable. USDA rated 58 percent of soft red winter (SRW) wheat assessed acres in good to excellent condition compared to 68 percent four weeks prior, and just 7 percent were rated in poor or very poor condition. However, SRW crop conditions were not uniformly positive. Better crop conditions in Ohio and Tennessee mask worsening moisture conditions in the Southeast and Mid-Atlantic regions. Ninety-five percent of Virginia, 61 percent of North Carolina and most of Maryland are abnormally dry or in moderate drought. Ratings were not available for several southern SRW states where drought conditions are more severe. Deteriorating crop conditions also helped push Chicago Board of Trade (CBOT) March wheat futures price to its highest point in five months at $4.47/bu ($164/MT).

Winter wheat crop conditions were not reported this month for Idaho, Oregon or Washington where exportable soft white wheat supplies are concentrated. However, the Feb. 1 Drought Monitor shows southern Idaho and nearly all of Oregon are abnormally dry. However, precipitation is expected in the next 5 to 10 days that should be beneficial for most of the estimated 3.56 million acres (1.44 million hectares) of white wheat.

Some rain this week pressured wheat prices, showing that the futures markets will likely be volatile until the spring green up tells the final story. It is a long way until harvest, but customers should closely watch weather conditions across the United States and be ready to take advantage of price moves in their favor.

If you have any questions about the current crop conditions or the U.S. marketing system, please contact your local USW representative.

To track U.S. wheat prices, drought conditions and more, subscribe to the USW Weekly Price Report, here.

*From December through March, USDA assesses winter wheat crop conditions in select states on a monthly basis. Weekly crop progress reporting will resume in April.

thumbnail

By Stephanie Bryant-Erdmann, USW Market Analyst

In the Nov. 2, 2017, issue of “Wheat Letter,” we analyzed the tight supply of high protein U.S. wheat (minimum of 13.0 percent protein at 12 percent moisture basis (mb)) and its effects on pricing. The latest production and quality analysis suggests that global high protein wheat production in marketing year 2017/18 is down as much as 39 percent from average. That strengthens the conclusion that price premiums will continue at least into the first quarter of marketing year 2018/19 (June to May).

Based on available data, U.S. Wheat Associates (USW) has estimated that the world’s wheat suppliers produce about 50 million metric tons (MMT) of high protein wheat in an “average” year. Of that total, USW estimated that about 27 MMT on average are available to export markets, including:

  • 0 MMT of hard red spring (HRS) from the United States;
  • 0 MMT of Canadian Western Red Spring (CWRS);
  • 0 MMT from Kazakhstan, Russia and Ukraine; and
  • 0 MMT of Australian Prime Hard (APH) and Australian Hard (AH).

Looking at 2017/18, high protein wheat production was well below average.

USDA data showed that total U.S. HRS production was down 26 percent year over year at 10.5 MMT, with about 9.0 MMT having at least 13.0 percent protein (12 percent mb). Roughly half of U.S. HRS is exported annually, putting U.S. high protein HRS exports at 4.5 MMT. Carry-in stocks from 2016/17 totaling 6.4 MMT push total HRS supply higher, and potentially also enlarge the supply of high protein HRS. In 2016/17, the average protein was 14.6 percent (12 percent mb), but the protein content of the remaining stocks carried into 2017/18 is unknown. Year to date, the Federal Grain Inspection Service has inspected 3.94 MMT of HRS, 98 percent of which had at least 13.0 percent protein (12 percent mb), and USDA reported an additional 1.26 MMT of HRS sales that have not yet shipped as of Jan. 25. To meet that demand, high protein HRS stocks will need to be pulled out of storage, indicating premiums for HRS are unlikely to shrink in 2017/18.

Of the 19.2 MMT of CWRS produced in 2017/18, about 78 percent, or 15.0 MMT, graded #1 CWRS according to Canadian International Grains Institute (CIGI) data. The average protein for #1 CWRS is 13 percent (12 percent mb), with roughly 75 percent of #1 CWRS samples averaging above 13.0 percent (12 percent mb). If production values match sampling ratios, then Canada produced roughly 11.0 MMT of high protein wheat in 2017/18. On average, Canada exports roughly 70 percent of total wheat production putting total high protein wheat exports at an estimated 8.0 MMT. Weber Commodities, a Canadian-based analyst firm, believes Canada carried in just 1.0 MMT of high protein stocks, putting the estimated total Canadian high protein wheat exportable supply at 9.0 MMT.

Black Sea high protein exports are expected to fall to 3.0 MMT — all from Kazakhstan — due to above average rainfall that significantly lowered protein levels in Russian and Ukrainian wheat.

Australian Prime Hard is only produced in Queensland and New South Wales where La Niña-related drought conditions have sharply cut yields. Generally dry conditions are also expected to hurt Australian Hard wheat yields. USW estimates that Aussie high protein exportable supplies will only reach about 1.5 MMT.

The shrinking supply of high protein wheat can be seen in the prices of the top suppliers. According to the International Grains Council (IGC), the average price for 13.5 percent protein (12 percent mb) HRS exported from the Pacific Northwest (PNW) is up 16 percent year over year. IGC uses the Canadian designation of CWRS as 13.5 percent protein (13.5 percent mb). It reports CWRS prices from both Vancouver and St. Lawrence show an increase of 24 percent year over year. Meanwhile, lower protein wheat producers, such as Argentina, have seen prices fall 4 percent year over year due to the large supply of lower protein wheat.

Here is a table summarizing USW’s estimate of the big cut in global high protein wheat supplies in 2017/18 compared to an average, or “typical” year.

                                    Average Export Supply            2017/18 Estimated Supply

U.S. HRS                        6.0 MMT                                   4.5 MMT

CWRS                          11.0 MMT                                    8.0 MMT

Black Sea                       7.0 MMT                                   3.0 MMT

APH/AH                          3.0 MMT                                   1.5 MMT

Total                            27.0 MMT                                  17.0 MMT

thumbnail

By Stephanie Bryant-Erdmann, USW Market Analyst

Six months into marketing year 2017/18 (June to May), total U.S. export sales of 19.5 million metric tons (MMT) are 8 percent behind last year’s pace according to USDA Export Sales data through Jan. 4. However, the estimated total value of U.S. wheat export sales is 4 percent greater than last year on the same date at $4.72 billion, due to slightly higher export prices according to USDA Export Sales data and USW Price Report data.

A deeper analysis of USDA data shows total sales to six of the top 10 U.S. export markets in 2016/17 are ahead of last year’s pace, demonstrating strong demand for U.S. wheat. Sales of soft red winter (SRW) and soft white (SW) are both ahead of last year’s pace. USDA projects total 2017/18 exports will fall slightly to 26.5 MMT, which, if realized, would be 8 percent below 2016/17 but 1 percent above the 5-year average pace.

USDA reported hard red winter (HRW) year-to-date exports at 7.79 MMT, down 10 percent from the prior year. Still, 2017/18 export sales are 10 percent ahead of the 5-year average due to competitive prices for medium protein HRW and the good, overall quality of this year’s crop. The estimated value of year-to-date HRW export sales is 6 percent above 2016/17 due to a 14 percent increase in the average U.S. HRW free-on-board (FOB) price that is supported by the increased premiums for HRW with higher protein. Mexico is currently the number one HRW purchaser. As of Jan. 4, HRW sales to Mexico totaled 1.58 MMT, up 28 percent from last year’s pace. Sales to Indonesia are also up 28 percent year over year at 430,000 metric tons (MT). HRW purchases by Algeria total 456,000 MT, more than double last year’s sales on this date. To date, HRW sales to Venezuela totaling 120,000 MT are nearly four times great than the 2016/17 pace.

Both export sales volume and value of SRW for 2017/18 are up due to the excellent quality of this year’s crop and relatively competitive pricing. Export sales are up 7 percent year over year at 2.02 MMT, boosting estimated export sales value to $400 million, or 12 percent more so far this year. As of Jan. 4, total sales to 11 of the top 20 U.S. SRW export markets from 2016/17 are higher than last year. Sales to Colombia are 12 percent ahead of 2016/17 at 198,000 MT. Nigerian SRW purchases total 234,000 MT, up 12 percent from last year. Sales to other Central and South American countries, including Brazil, Peru, Panama, Venezuela and El Salvador, are also ahead of the 2016/17 pace.

Hard red spring (HRS) sales of 5.15 MMT are down 25 percent year over year and 7 percent below the 5-year average. Higher prices due to smaller 2017/18 production have slowed HRS exports thus far in 2017/18, but global demand for HRS is strong. Year-to-date in 2017/18, the average FOB price of HRS is $293 per metric ton ($7.97 per bushel), compared to $241 per metric ton ($6.55/bu) in 2016/17, according to USW Price Report data. As of Jan. 4, buyers in Japan purchased 878,000 MT, up 20 percent from 2016/17. Sales to Taiwan of 518,000 MT are up 17 percent from last year’s sales on the same date. The Philippines continues to import the largest volume of HRS, though at a 6 percent slower pace so far.

As of Jan. 4, exports of soft white (SW) wheat are up 22 percent year over year at 4.30 MMT. That is 28 percent greater than the 5-year average. Sales to the top 10 SW customers are ahead of last year’s pace, supporting an estimated export value of $896 million, up 25 percent from the prior year. Philippine millers purchased 946,000 MT, up 16 percent compared to last year’s sales on the same date. South Korean sales are up 43 percent at 674,000 MT. U.S. SW sales to China, Thailand and Indonesia are also up. Year-to-date, Indonesia has purchased 515,000 MT, compared to total 2016/17 purchases of 270,000 MT. Thailand sales are up 18 percent year over year at 217,000 MT. Chinese purchases of 306,000 MT are already greater than 2016/17 total SW sales.

Year to date durum exports total 272,000 MT, down 32 percent from the same time last year, and below the 5-year average, with tighter supplies and resulting higher prices. The average export price for U.S. durum is up 5 percent over last year at this time according to USW Price Report data. To date, Nigeria, the European Union (EU), Algeria and Guatemala are the top durum buyers. A significant portion of the first quarter 2017/18 sales is designated as “sales to unknown designations.