thumbnail

By Claire Hutchins, USW Market Analyst

According to USDA’s June WASDE (World Agricultural Supply and Demand Estimates) report, U.S. feed wheat consumption will increase 64% in marketing year (MY) 2019/20 to 3.81 million metric tons (MMT), compared to 1.36 MMT in MY 2018/19. U.S. Wheat Associates (USW) believes the current price relationship between domestic wheat and corn and the nutritional value of U.S. hard red winter (HRW) wheat and soft red winter (SRW) wheat support USDA’s estimates.

When the cash price gap between U.S. wheat and corn shrinks, wheat becomes an attractive feed ingredient for the cattle, swine and poultry industries. Per bushel, wheat is typically more expensive than corn, making it economically less practical as a staple ingredient in U.S. feedlots. However, recent market conditions are changing wheat and corn feeding ratios across the United States. The spot price gaps between U.S. winter wheat and corn have diminished, and even inverted, over the past several months as the potential for a bountiful wheat harvest offsets the potential for lower corn production due to late spring planting in the Midwest.

HRW can be substituted for corn as cattle feed in the High and Southern Plains where much of the country’s HRW wheat is grown. The cattle industry, predominant in Kansas and Texas, favors wheat as a feed ingredient when HRW is less than $1.00/bu more expensive than corn. Between early May and late June, the average cash price for wheat and corn increased steadily in both states, but the price gap narrowed and eventually inverted by early July.

In early May, the cash price for HRW in Kansas, the third largest cattle-producing state in the country, was $0.49/bu higher than corn. By early June, the price gap dropped to $0.29/bu. On July 1, the average cash price for both commodities settled around $4.06/bu and by July 5, HRW was $.06/bu cheaper than corn at $4.20/bu. According to Aaron Harries, Kansas Wheat Commission Vice President of Research and Operations, Kansas feedlots are already feeding more wheat than usual as managers respond to market incentives. Importantly, the decision to feed more wheat is made based on months of efficient market conditions as the ideal cattle diet consists of at least six months of a consistent ingredient blend.

Source: Reuters Eikon

In Texas, the largest cattle-producing state in the country, the recent spot price relationship between HRW and corn has been much tighter. In the first half of May, the cash prices for HRW and corn were nearly tied around an average of $3.92/bu. By early June, the average cash price for HRW dropped $0.24 below corn’s $4.50/bu. The cash-price relationship between wheat and corn is still inverted as of early July and HRW is, on average, $0.37/bu cheaper than corn.

“We are seeing a trend of feedlots purchasing more wheat directly from producers and elevators,” says Darby Campsey, Texas Wheat Producers Board, Director of Communications and Producer Relations. “Market conditions and wheat quality are increasing the value of wheat compared to corn in some cases.”

Campsey explains that in addition to market conditions, Texas livestock producers make grain purchasing decisions based on nutritional needs and local supplies. When wheat protein is lower than average, producers may be more likely to sell to feedlots, where quality requirements are slightly easier to meet than milling standards.

In the Midwest and South, where much of the country’s SRW is grown, swine producers are willing to pay more for wheat than corn because of wheat’s high nutritional value, according to Joel DeRouchey, Kansas State University professor in swine nutrition and management. Corn is used as a feed ingredient for swine because it is cheaper and a higher source of energy than wheat, but wheat brings a higher concentration of amino acids and phosphorous to the animal’s diet. The same market conditions affecting Kansas and Texas can be seen in Illinois and North Carolina, making wheat an even more attractive feed ingredient for swine producers.

In Illinois, the fourth largest swine-producing state in the country, the average spot price gap between SRW and corn decreased significantly between early May and early July. In early May, SRW was, on average, $.90 more expensive than corn. By July 8, the difference collapsed to $.50 as SRW prices continued their decline to $4.92/bu and corn prices continued their incline to $4.42/bu.

Source: Reuters Eikon

At an elevator in North Carolina, the second largest swine-producing state in the country, the spot price for corn surpassed the spot price for SRW between early June and early July. Between June 24 and July 5, the spot price for SRW sank from $4.82/bu to $4.38/bu while the price of corn hovered around an average $4.81/bu.

Wheat is also used as a corn feed substitute in the poultry industry due to its high protein content. Wheat becomes attractive to broiler producers when the price gap between SRW and corn narrows to $.50/bu. The average cash price for SRW in Kentucky, the seventh largest broiler producer in the country, decreased significantly between June 26 at $5.39/bu and July 5 at $4.91/bu, while the average price of corn increased from $4.36/bu to $4.60/bu. In early June, the average spread between SRW and corn was $.81/bu. As of July 5, the spread narrowed to just $.31/bu.

Source: Reuters Eikon

“I wouldn’t be surprised if more chicken producers are feeding wheat. Corn is preferred for chickens, because of its high energy levels, until corn prices rise too high, and right now cash prices for wheat and corn in Maryland are pretty close,” says Jason Scott, Maryland wheat farmer and USW past chairman. As of July 8, the average SRW spot price in Maryland, a top ten broiler producing state, was only $.10/bu higher than corn.

If the narrow or inverted price gaps between wheat and corn persist across the country, producers could continue to increase the amount of wheat used in feed blends for cattle, swine and poultry, potentially surpassing USDA’s estimate of 3.81 MMT.

Every month, USW publishes a graphic summary of the latest data from USDA’s WASDE report, including global wheat market factors, major country and regional export history and U.S. wheat supply and demand summaries by class. View the monthly summary here.

thumbnail

By Tanner Ehmke, Manager, Knowledge Exchange, CoBank; Reprinted with permission;
View the original report here.

Key Points:

  • Blockchain innovations in agriculture are numerous but have been slow to gain industry-wide acceptance, particularly in global agriculture commodity trading.
  • Previous attempts to digitize trade finance with tools like bank payment obligation (BPO) have been slow to take hold, raising doubts among market participants of new digitalization efforts like blockchain.
  • Commodity agricultural trade faces unique challenges, including the blending of grain along the supply route, and the lack of digital documentation within sections of the supply chain.
  • Digital solutions are quickly evolving, creating an environment where blockchain technologies may be more viable in ag commodity trading in the near future.
  • Investment in storage, transportation, and sensors to segregate and track commodities through the supply chain is necessary to give buyers visibility, with high-value or value-added commodities like non-GMO and organic grain where provenance and tracking are desired.

Introduction

Blockchain, the distributed ledger technology behind cryptocurrencies like Bitcoin where identical records of transactions are stored on multiple computers, is still in its infancy but has seen a flood of pilot programs and proof-of-concepts from companies around the world as they race to harness its power of transparency. The agriculture and finance industries in particular have captured the spotlight as ripe for disruption by blockchain technologies. Adoption of most blockchain technologies across agriculture, however, has been limited to date. Banks and agribusinesses nonetheless remain keen on finding distributed ledger solutions to deploy industry-wide and potentially achieve efficiencies from faster transaction speeds, less cumbersome documentation, and simpler and faster payments between buyers and sellers around the world.

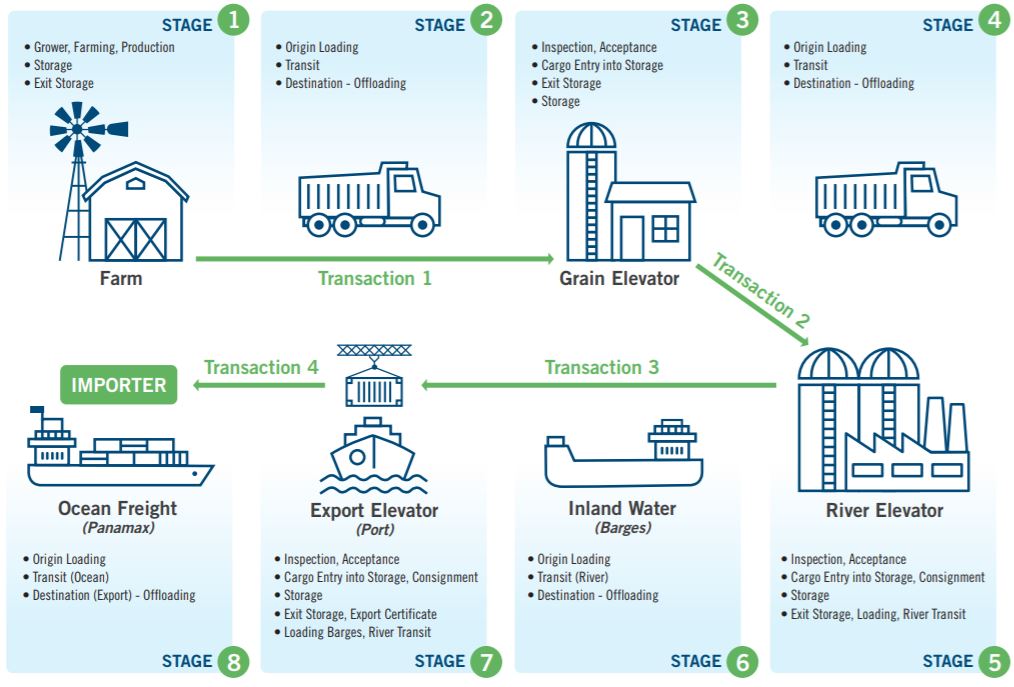
EXHIBIT 1: Process of Domestic Supply Chain for U.S. Soybean Export via Barge; Graphic Source: CoBank

Other digital solutions that promised to transform the commodity trading sector, such as bank payment obligation (BPO), are recent reminders that change can be hard work without industry-wide acceptance. Until numerous roadblocks to blockchain solutions are resolved, such as a lack of a digital ecosystem for paperwork like bills of lading and letters of credit for parts of the supply chain; improvement in global industry protocols in quality; standards in language; investment in storage and transportation for segregation; and technological advancements in sensors to monitor movement of commodities along complex trade routes, industry-wide adoption of blockchain in agricultural commodity trading will struggle to grow beyond proof of-concept. But, if successful, blockchain could be transformative across the sector, bringing value across the supply chain from producers to consumers.

Complex Supply Chains

Blockchain applications for agriculture abound. Ripe.io, GrainChain, AgriDigital, OriginTrail, and IBM Food Trust are just a few of the blockchain-based technologies created for commerce in agriculture. Yet in the complex global agricultural commodity space where crops like corn, soybeans, and wheat are blended from numerous farms and pass through multiple hands before reaching the final destination, a blockchain solution that links the supply chain and creates transparency of transactions from beginning to end remains in idea phase. The biggest challenge for the widespread adoption of blockchain technologies in agricultural commodity trading is the complexity within the chain of custody (Exhibit 1). Grain leaving the farm is often comingled at a country elevator, then blended again at a rail or barge loading facility, then comingled again at the export facility where it is loaded on an ocean vessel for export. At the receiving port overseas, grain will likely be blended even more after off-loading the vessel.

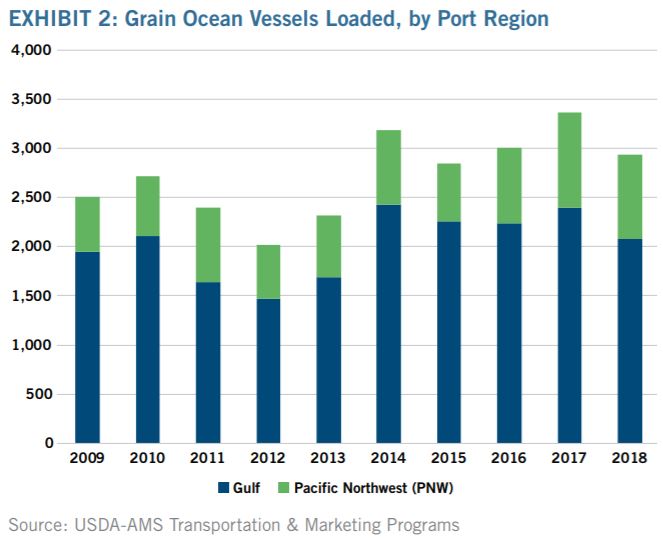
EXHIBIT 2: Grain Ocean Vessels Loaded, by Port Region; Graphic Source: CoBank

Digitizing even portions of the supply chain could create huge cost savings for grain handlers. The physical delivery of documents like bills of lading, letters of credit, contracts, letters of intent, and invoices is cumbersome. While costs of shipping documents are negligible and could be eliminated with a blockchain platform, the cost and risk of important documentation arriving late could be far greater. If documents to the receiver of the grain do not arrive on time, the shipper must pay the cost of demurrage for every day the barge, rail car, or vessel sits idle. Cost of demurrage per barge, for instance, can run about $300/day. Demurrage is a charge for failure to load or unload barges, rail cars, or ocean vessels within the time allowed.

A non-blockchain based digital solution currently is being evaluated by a consortium of agribusinesses for barge freight on the Mississippi River for the purpose of reducing paperwork and creating seamlessness in transactions between companies. Paperwork such as bills of lading and letters of credit have digital forms for ocean vessels, but are in paper form for barge traffic on the Mississippi River, which is an important logistical leg of the global agricultural commodity supply chain. Digitizing paperwork on the Mississippi River export route offers the greatest potential for blockchain solutions in global agricultural commodity trading. The majority of U.S. ocean-going vessels loaded with grain depart from the New Orleans region (Exhibit 2).Barge traffic for grain on the Mississippi River regularly exceeds 15,000 barges/year (Exhibit 3). The plethora of documents in the grain trade that must be digitized for seamlessness across the supply chain includes but is not limited to:

  • Letters of credit
  • Bills of lading
  • Trading slips
  • Certificates on weights, grades, phytosanitary
    specifications, fumigation, and origin.

Additionally, the industry would need agreement on where in the supply chain the data would be committed to the blockchain, such as at the barge or rail car loading facility, or at the farmer’s field. The data on a blockchain for grain traded on the inland river system would then also have to be integrated with systems for ocean-going vessels heading to international markets, thereby requiring international standards for data and governance.

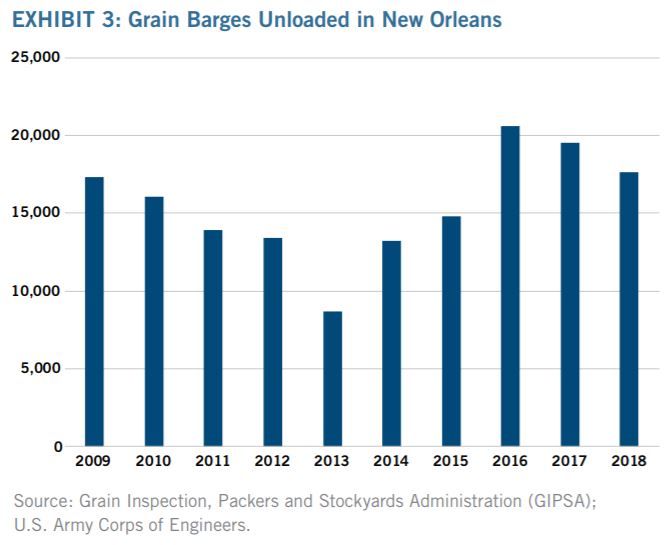
EXHIBIT 3: Grain Barges Unloaded in New Orleans; Graphic Source: CoBank

Disillusionment

Previous attempts to digitalize trade finance were heralded as transformative but have yet to change the status quo in global trade. In recent years, the bank payment obligation (BPO) was created with significant investment and promised faster handling of goods, payment at due date, and faster receipt of trade documents. The lack of wide-spread adoption of BPO has raised doubts among market participants of new digitalization efforts like blockchain. A blockchain platform may not be adopted industry-wide despite significant investment and coordination, particularly in emerging markets where there is frequently a lack of consistency in technology. Or, if successfully adopted, a blockchain platform could itself be disrupted by yet another new technology. Questions about ownership of data on a distributed ledger have also raised concerns. Trading firms want information to be private. If chain of custody information is visible for anyone on the supply chain to see on a distributed ledger where each market participant or node would have access to all documentation, merchandisers will be reluctant to use
a blockchain platform. Who will gain access as a node in the blockchain will require governance and rules, thereby requiring a governing body trusted by all parties of the supply chain to host nodes and validate transactions. Blockchain would not reduce or eliminate the need for regulators. Maintaining the quality of information that is inputted into the blockchain would require a licensed inspector who might need access to the blockchain to see documents and integrate their certification information on grading. A regulator or third party would also still be needed to define responsibilities, rules, and regulations of supply chain participants despite blockchain widely thought of as a technology that would replace trusted intermediaries. With the huge volume of shipments moving outside of the U.S., cooperation from international buyers is required to create the protocols necessary for blockchain in agricultural commodity trading to flourish. However, the current geo-political climate – especially with the U.S. and important trading partners like China – raises doubts about achieving a globalized trading system on a blockchain.

Blockchain’s application in the ag commodity trade may also be limited to only portions of the supply chain. If farmers and country elevators are not incentivized either through cost savings or gain in value, adoption of blockchain will be limited to segments further down the supply chain.

Evolution

Despite major challenges impeding blockchain’s use in the global grain trade, the potential opportunities achieved through a distributed ledger system could be significant. Blockchain could potentially expedite borderless clearing, help facilitate digitally validated chains of custody through choke points like barge and train loading facilities, allow buyers and sellers to follow a shipment through various chains of custody, lower the cost for clearance of goods, eliminate duplicated inspections at ports, lower risk of demurrage, assist with payment, mitigate counter-party risk, and greatly reduce the risk of errors and fraud. Corn, which has the simplest trade specifications under the Federal Grain Inspections Service (FGIS) would be the easiest commodity to adopt into a distributed ledger platform, followed by soybeans and wheat. If provenance is important, sharing knowledge of the entire chain of custody will be necessary for commodities like non-GMO and certified organic. Through investment in grain storage and transportation for segregation, greater transparency in the supply chain to segregate other attributes, including but not limited to:

a. High-oleic oil content for soybeans
b. Protein content
c. Foreign matter
d. Moisture levels

Further investment in electronic sensors to trace, validate, and verify quality attributes, though, would be required to make transparency possible along the complex commodity trading route. With sensors in place, a blockchain platform could evolve to include payment systems within “smart contracts” that automatically execute transactions without human intervention as the product moves through the supply chain. However, a distributed ledger system that shares this information would also need to protect proprietary information held only between buyers and sellers.

Conclusion

The challenges of industry-wide adoption of blockchain technologies for agricultural commodity trading are ample, but so are the potential benefits. Greater visibility in the supply chain will create value for many, but standards will change. The winners in a hypertransparent environment will be those who have the ability to segregate and capture higher value in the commodity chain. Those who struggle to adapt will be those with limited ability to segregate. Experiences with prior efforts to digitize trade have raised the level of caution for blockchain. High investment into blockchain may not result in industry-wide adoption. If successfully adopted, a blockchain platform could crowd out small players. It could also be disrupted by yet another new technology.

To be successful, a blockchain platform bringing transparency to an entire supply chain would need to be private and secure from outside parties. Only invited parties or nodes would be allowed to view the data on transactions for traders to be confident that proprietary information is not made public. This would require a governing body to determine who is allowed to participate on the blockchain.

Global standards and protocols will also need to be established. Given the current geo-political and global trade environments, such an evolution in international cooperation will likely be years in the making.

By Claire Hutchins, USW Market Analyst

On May 10, USDA issued its first set of forecasts for 2019/20 in its World Agricultural Supply and Demand Estimates report. USDA expects global wheat production at a new record of 777 million metric tons (MMT) and exceeding expected use again as major global suppliers rebound from last year’s unfavorable growing conditions.

Droughts in the European Union (EU) and Australia last year cut production in both regions to 5-year and 10-year lows, respectively. Growing conditions in both regions are more favorable now and USDA expects total EU wheat production to rebound 12% from last year to 154 MMT.

Australian wheat production is expected to reach 22.5 MMT, up 23% year-over-year but still 3% below the 5-year average of 23.3 MMT.

USDA’s initial forecast for Russian production shows a 6% increase over last year’s 72.0 MMT to 77.0 MMT in 2019/20 and a small decline in export volume. Notably, SovEcon, a Russian consultancy pegs 2019/20 Russian wheat production closer to 83.0 MMT, 7% higher than USDA’s official estimate and 15% higher than last year’s total production, if realized.

World beginning stocks of 275 MMT paired with the forecast for increased production bring total supply in the new marketing year to a record 1,052 MMT. USDA says large supplies in 2019/20 will be met by increased global demand for feed wheat and food consumption. USDA forecasts total global domestic consumption will reach a record 759 MMT in 2019/20, compared to 738 MMT the year prior. Global trade, at 285 MMT, is 4% higher than last year and 5% higher than the 5-year average of 176 MMT.

USDA predicts U.S. wheat production in 2019/20 will total 51.6 MMT. Though down somewhat from last year, that volume and increased beginning stocks push U.S. exportable supplies up to 52.0 MMT, the largest in the world. As global trade and consumption continue to rise, the abundance and end-use versatility of U.S. wheat classes reaffirm the United States remains the world’s most reliable supplier of wheat.

Each month, U.S. Wheat Associates (USW) updates a graphic summary of USDA’s WASDE (World Agricultural Supply and Demand Estimates) report. View the May summary here.

thumbnail

By Claire Hutchins, USW Market Analyst

As marketing year (MY) 2018/19 draws to a close, customers of U.S. winter wheat are taking advantage of excellent buying opportunities on competitive pricing and high-quality, consistent supplies. Since the first week in January, the 2018/19 export sales pace for hard red winter (HRW) and soft red winter (SRW) surpassed last year’s pace for deliveries in the current marketing year (CMY) and the new marketing year (NMY).

According to USDA commercial sales data as of April 4, 2019, HRW sales for 2018/19 delivery total 8.70 million metric tons (MMT). That is down 4% from this time last year but up 4% from the 5-year average of 8.33 MMT. Between February 14 and April 4, weekly sales of HRW for CMY delivery were significantly higher than the same six weeks in 2017/18 on low prices and high crop quality attributes. In the April 12 U.S. Wheat Associates (USW) Price Report, estimated FOB export price for 12% protein HRW (12% moisture basis) out of the Gulf at $222/MT for May 2019 delivery compared to $258/MT for delivery in May 2018. HRW export basis for the same delivery month, at $1.70/bu, is significantly lower than last year’s $1.95/bu. In addition to lower FOB export prices, the 2018/19 HRW crop features excellent milling and baking qualities.

These market factors also support a significant uptick in HRW commercial sales into the NMY compared to NMY sales booked by the same time in 2017/18. HRW export sales for the 2019/20 marketing year total 396,000 metric tons (MT), up 64% from this time last year and 17% from the 5-year average. This represents the highest volume of HRW NMY sales to date since 2014/15. The most recent USW Price Report estimates 12% HRW FOB price for June 2019 delivery at $224/MT, compared to last year’s estimate of $259/MT for delivery in June 2018.

Members of the grain trade expect HRW FOB prices and export basis out of the Gulf to decrease steadily into the new marketing year on somewhat larger ending stocks, reduced inland logistical challenges, and favorable new crop conditions.

Turning to SRW, commercial sales to date for 2018/19 delivery total 3.30 MMT, up 36% year-over-year and 10% more than the 5-year average. This represents the highest volume of SRW commercial sales for CMY delivery since 2014/15. Competitive prices, higher than average protein levels and lower than average DON levels continue to elevate SRW export business through the second half of MY 2018/19. More information about the 2018/19 SRW crop is available at https://bit.ly/2ZdnMwi.

The latest USW Price Report valued the SRW export FOB price out of the Gulf at $204/MT for May 2019 delivery compared to $208/MT last year. SRW export basis for May 2019 delivery out of the Gulf at $0.90/bu is 5 cents less than last year’s estimate for May 2018 delivery.

Grain traders expect SRW FOB export prices and export basis to decline steadily into the first few months of MY 2019/20 despite tightening 2018/19 U.S. SRW ending stocks, which are forecast to fall to 4.57 MMT, 18% below 2017/18 and 7% below the 5-year average.

As with HRW sales, total SRW commercial sales for 2019/20 delivery are significantly higher than NMY sales booked this time last year. SRW commercial sales for NMY delivery total 302,000 MT, up 23% year-over-year and 15% from the 5-year average. This represents the highest volume SRW NMY sales to date since 2014/15 as customers look to lock in high quality supplies at globally competitive prices. The April 12 Price Report estimates SRW FOB price out of the Gulf for June 2019 delivery at $202/MT compared to last year’s estimate of $213/MT for the same delivery month in 2018.


thumbnail

By Steve Mercer, USW Vice President of Communications

Grown in the eastern United States, soft red winter (SRW) wheat is a profitable choice for producing confectionary products like cookies (biscuits), crackers and cakes, and to blend its flour for baguettes and other bread products. U.S. Wheat Associates (USW) wants to share some key points about SRW exportable supply in marketing year 2018/19 and look ahead to its potential for 2019/20.

1. Good Quality. While excessive rain on the 2018/19 SRW crop did slightly lower average test weight and falling number, protein (9.9% on 12% moisture basis, composite) is above average and DON level (0.7 ppm composite) is slightly below average. Processors should find good qualities for crackers and segments of the crop with good cookie and cake qualities. The higher protein and good extensibility in the crop should add value in blending for baking applications. See more information at https://www.uswheat.org/market-and-crop-information/crop-quality/.

2. Least Cost. SRW is the lowest cost milling wheat in the world today, offered at an average FOB export price of US$202 per metric ton* for June delivery from U.S. Gulf ports. The International Grains Commission in its March Grain Market Report estimated SRW FOB price at $211, which is $6 less than French soft wheat. SRW exportable supplies are also available from Lakes ports (Toledo, Ohio), and Atlantic ports (Norfolk, Virginia, and Wilmington, North Carolina). See more information at https://www.uswheat.org/market-and-crop-information/price-reports/.

3. Supply is Down. Ending stocks of SRW have declined from 5.9 MMT in 2016/17 to USDA’s latest estimate of 4.6 MMT for 2018/19 (by comparison, SRW ending stocks in 2013/14 were 3.1 MMT after China imported 3.6 MMT that marketing year). Reduced supply relates to a near 50% decline in total production from 15.4 MMT in 2013/14 to USDA’s current estimate of 7.8 MMT in 2018/19, as well as an upturn in exports (see below). See more information at https://www.uswheat.org/market-and-crop-information/supply-and-demand/.

SRW ending stocks have declined steadily since 2016/17 on less production and more exports. Source: USDA

4. Demand is Up. As of April 4, SRW exports of 3.3 million metric tons (MMT) are 36% more than at the same time in marketing year 2017/18. This represents the most volume SRW sales year to date since 2014/15. Commercial SRW sales to Mexico, Colombia, Peru, Ecuador and Brazil are up significantly, as are imports by Central American and Caribbean countries and Nigeria. See more information at https://www.uswheat.org/market-and-crop-information/commercial-sales/.

U.S. SRW wheat supplies are down; export demand takes an upturn. Source: USDA

5. Planted Area is Down. In February 2018, USDA reported that SRW seeded area for 2019/20 is 5.7 million acres (2.4 million hectares), or down 7% from last marketing year. Most of the states that typically produce the most exportable SRW supplies planted less. This decline is not more significant only because some farmers can harvest SRW and then quickly plant soybeans to get a double crop from the same acre. In general, U.S. crop farmers, who are driven by economic circumstances to minimize their net losses at best this year, are turning away from winter wheat to other crops that offer better returns. Total U.S. winter wheat seeded area for 2019/20 is at its second lowest level on record. See more information at https://www.nass.usda.gov/Publications/Todays_Reports/reports/wtrc0219.pdf.

*Source: USW Price Report, April 12, 2019

thumbnail

By Claire Hutchins, USW Market Analyst

USDA updated its monthly World Agricultural Supply and Demand Estimates (WASDE) on Mar. 8, showing decreased global production and domestic consumption but steady global trade. USDA pegged 2018/19 global production at 733 million metric tons (MMT), 3 percent below last year’s volume of 763 MMT. The United States holds the most exportable supplies at 51 MMT, while Russia’s fall in at 43 MMT, Canada’s at 28 MMT, and the European Union’s (EU) at 27 MMT.

Global consumption estimates dropped by 5 MMT between February and March to 742 MMT, driven primarily by a 3 percent decrease in expected Indian domestic consumption for 2018/19. Indian wheat consumption will account for nearly 13 percent of total global consumption in 2018/19, while its final import levels will make up less than 1 percent of expected global wheat imports. Though 2018/19 global consumption is expected to fall below last year’s record of 744 MMT, total global trade holds nearly as high as 2017/18 levels at 179 MMT, 3 percent above the 5-year average of 173 MMT.

The EU and Argentina are expected to export 23.0 MMT and 14.2 MMT respectively, both upward revisions from February’s WASDE report. USDA lowered its 2018/19 U.S. wheat export estimate to 26.3 MMT, down 3 percent from the February estimate of 27.2 MMT. USDA dropped expected hard red spring exports by 680,000 metric tons (MT) to 7.48 MMT and white (soft white and hard white) exports by 272,000 MT to 5.72 MMT. Year-to-date commercial sales of 22.6 MMT comprise 86 percent of the USDA’s new 2018/19 export figure. This time last year, USDA expected U.S. wheat exports to total 25.2 MMT. Commercial sales a year ago totaled 22.1 MMT, or 88 percent of USDA’s 2017/18 total expected export volume as of March 2018. With 12 weeks left to go of marketing year 2018/19, the United States must sell 3.7 MMT of wheat to hit the USDA’s current export projection.

Each month, U.S. Wheat Associates (USW) updates a graphic summary of USDA’s WASDE (World Agricultural Supply and Demand Estimates) report. View the March summary here.

thumbnail

By Vince Peterson, USW President

Recently, I was searching online for some wheat market information to share at an upcoming meeting. I saw a headline that asked: “What country exports the most wheat?” Great, I thought, here we go again with more propaganda about Russia beating the United States in the global wheat export market contest.

Instead, I was quite pleased to scroll down to find that the United States was still the world’s largest wheat exporter in 2017 in terms of “value” according to the “World’s Top Exporters.” Russia produced almost twice the volume of wheat than the United States and more than matched U.S. export volume that year; but at an estimated $6.1 billion, U.S. wheat exports generated $300 million more value than Russian wheat exports.

The reason is clear: there are many private and public wheat buyers, millers and processors around the world that prefer the quality, variety and value of U.S. wheat; and that remains a primary asset to our farmers.

U.S. Wheat Associates (USW) has adjusted its allocation of wheat farmer dollars and program funds from USDA’s Foreign Agricultural Service to activities in markets that have a growing need for a variety of flour products with high quality functional characteristics. There our differential advantages shine through and where the investment offers the most return. On the other hand, USW continues to provide the trade servicing needed in the more cost-sensitive markets that are buying Russian wheat. There is value there, too, with a market environment like today’s in which the price spread between U.S. wheat classes and Black Sea supplies has narrowed. We continue to provide technical support to those buyers to demonstrate and build more knowledge about the true functional value of U.S. wheat. In addition, we are strong advocates for continuous improvement in wheat quality.

Looking ahead, I believe this is the right position for U.S. wheat in a global market with growing income levels, increasing urbanization and record setting consumption every year. It also reflects our mission: to enhance wheat’s profitability for U.S. producers and its value for their customers.


USW President Vince Peterson

thumbnail

By Claire Hutchins, USW Market Analyst

In its February 2019 World Agricultural Supply and Demand Estimates (WASDE) report, USDA predicted global wheat production to fall 3 percent below last year’s volume to 735 million metric tons (MMT) due to significant weather challenges in the European Union (EU), Russia, and Australia. EU production of 136 MMT falls 11 percent under last year’s harvest, Russian production of 72.0 MMT falls 15 percent below last year and Australian production of 17.0 MMT is the country’s lowest output since 2007/08. Meanwhile, USDA predicts increased production for Canada at 32.0 MMT and the United States at 51.0 MMT.

While USDA decreased its global production estimates for 2018/19, it bumped its estimates of total global use to 747 MMT, a sixth consecutive annual record, driven primarily by a 3 percent increase in Chinese feed and residual use.

Though production is down year over year in several key export regions, world wheat trade estimates are nearly in line with last year’s volume at 179 MMT, 7 percent higher than the 5-year average of 167 MMT. Argentina, Canada and the United States are all expected to increase exports year over year to 14.0 MMT, 24.0 MMT, and 27.2 MMT, respectively. Based on weekly USDA Foreign Agriculture Service (FAS) commercial sales data, U.S. wheat export sales (as of Jan. 3, 2019) total 17.9 MMT, or 66 percent of market year 2018/19’s expected export volume.

U.S. Gulf free on board (FOB) prices have been relatively stable for the past few months. Hard red winter (HRW) and hard red spring (HRS) export prices remain relatively unchanged from mid-October while soft red winter (SRW) export prices are on the rise. Though SRW prices are higher now than in recent months, they are still highly competitive on the world stage. As of Feb. 8, 2019, U.S. SRW prices were competitive enough with the French and the Black Sea offers for an Egyptian purchase of 120,000 metric tons (MT). As competitor exportable supplies continue to decrease into the second half of marketing year 2018/19, U.S. wheat is expected to remain more competitive in this and other price-sensitive markets.

Each month, U.S. Wheat Associates (USW) updates a graphic summary of USDA’s WASDE (World Agricultural Supply and Demand Estimates) report. View the February summary here.

thumbnail

By Claire Hutchins, USW Market Analyst

In its December World Agricultural Supply and Demand Estimates (WASDE) report, USDA predicted a 4 percent year over year decline in world wheat production for marketing year 2018/19, driven by severe drought in Australia and current cold, wet conditions in Russia. Australian production is expected to fall 32 percent below the 5-year average, the lowest level since 2007/08. Russian production is expected to fall 18 percent year over year, which would exceed the 5-year average by 6 percent.

While USDA predicts a decline in global wheat production, it expects total wheat consumption to rise. This year, consumption estimates total 744 MMT, 4 percent above the 5-year average. Feed wheat consumption estimate is down 4 percent year over year, but human consumption is up 1 percent year over year and continues to drive overall consumption levels.

Australian drought is driving more than just production numbers. Exports are expected to decrease significantly year over year from 14 million metric tons (MMT) to 10.5 MMT. While production and exports decrease, Australian feed wheat consumption is expected to reach 5.5 MMT, 44 percent above the 5-year average. Total Australian consumption includes 61 percent feed wheat in 2018/19, up 8 percent from last year, as Australian producers struggle to support their livestock through the dry weather.

Pacific Northwest (PNW) free on board (FOB) prices have been relatively stable for the past few months. Soft white (SW) export price remains virtually unchanged from mid-October, while export prices for hard red winter (HRW) and hard red spring (HRS) are on the rise. With Australian exports shrinking, the United States increased exports to the Philippines, Thailand, and Bangladesh. Total exports to South Asia are up 18 percent year over year. The decline in global production and incline in global consumption will continue to support U.S. export prices in the coming months.

The United States holds the largest supply of exportable wheat in the world at 50 MMT. U.S. exportable supplies, as a percentage of top exporting countries, is up 25 percent year over year. While global production is shrinking, as always, U.S. wheat remains the world’s most reliable supply.


thumbnail

By Stephanie Bryant-Erdmann, USW Market Analyst

This week, U.S. Wheat Associates (USW) holds its 2018 Fall Board of Directors meeting. At each board meeting, the USW Market Analyst presents an update on world and U.S. wheat supply and demand factors based on information from the U.S. Department of Agriculture, as of Oct. 11, 2018. Following are some highlights from the current report to the board.

  • 2018/19 global wheat production to fall for first time in 5 years.
  • Global supplies estimate to fall to 1,006 million metric tons (MMT); down 1 percent from the 2017/18 record.
  • Wheat production in Australia to fall to 18.5 MMT, 26 percent below the 5-year average.
  • U.S. wheat production estimated at 51.3 MMT, 8 percent above 2017/18.


  • Consumption forecast at a record 746 MMT, 4 percent above the 5-year average.
  • Chinese domestic consumption expected to reach 122 MMT, 5 percent above the 5-year average.
  • U.S. domestic consumption to grow 6 percent year over year to 31.1 MMT.


  • World wheat trade projected at 180 MMT, 4 percent above the 5-year average.
  • Australian exports to drop to 13.0 MMT, 10 percent below 2017/18, and the lowest level since 2007/08.
  • Exports from Russia to fall 15 percent year over year 35.0 MMT, still 28 percent above the 5-year average.
  • U.S. 2018/19 exports to increase to 27.9 MMT, up 14 percent from 2017/18, if realized.


  • World beginning stocks estimated at record 275 MMT, up 7 percent year over year.
  • Beginning stocks in Argentina forecast at 1.00 MMT, down 42 percent the 5-year average.
  • U.S. beginning stocks will fall to an estimated 29.9 MMT, 7 percent below 2017/18 levels.


  • Global ending stocks projected at 260 MMT, 5 percent below the record 2017/18 level, if realized.
  • Estimated Chinese ending stocks of 136 MMT account for 52 percent of global ending stocks.
  • Exporter ending stocks forecast at 58.8 MMT, down 24 percent year over year.
  • Ending stocks in importing countries to fall to 65.6 MMT, 15 percent below the 5-year average of 76.8 MMT.


  • Total U.S. wheat export sales for 2018/19 predicted to reach 27.9 MMT.
  • As of Oct. 11, 2018/19, U.S. wheat export sales were 18 percent behind last year’s pace.
  • About 27 percent of that difference represents temporary loss of the Chinese market.
  • Sales of soft red winter and durum are ahead of last year’s pace.