Farmers who spent the past year staring at charts and graphs that gauge costs and returns would certainly by now be quite familiar with the sensation of vertigo.
Up and down, down and up.
The proper term is “volatility,” and for those who make a living growing wheat and other crops, it can affect decisions made in spring – a time when farmers typically spend a lot of money on the front end of one crop while also waiting for the rear end on another.
As they arrive at that sensitive juncture in 2023, growers are finding a “mixed bag” compared to 2022. Analysis have revealed that most farmers are projecting their 2023 production costs to increase 6% to 15% compared to 2022. USDA’s most recent Farm Sector Forecast is slightly more optimistic, but still points to the expectation of higher input costs:
- Production expenses are forecast to increase for a sixth consecutive year, growing in 2023 by 4.1%.
- Fertilizers, lime and soil conditioners are expected to decrease 3%, from $43.42 billion to $42.17 billion. Typically, fertilizers represent about 15% of a crop farmer’s costs.
- Fuels and oils are expected to experience the largest percent decline – 17% – from 2022.
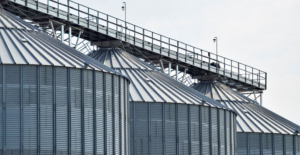
- These drops, however, are easily outpaced by increases in other expense categories including marketing, storage and transportation, which are forecast to increase 11%.
“Input costs are still quite elevated, but nitrogen fertilizer has decreased since its peak last year,” confirmed Jason Scott, a U.S. Wheat Associates (USW) Board of Directors member who grows soft red winter (SRW) wheat on the eastern shore of Maryland. “One of the larger issues we have been dealing with so far this year is availability of some specific inputs, as well as some parts for equipment.”
Indeed, national agriculture groups say input costs are once again the top concern among farmers in 2023, though there has been some “wiggling toward the positive” in recent months.
“Higher input costs remain the number one concern, chosen by 34% of producers in March, but concern about input costs has been falling since last summer’s peak when it was chosen by 53% of producers,” James Mintert, the Purdue University/CME Group Ag Economy Barometer principal investigator, noted in the most recent Barometer, which was released April 4. “Although producers still cite high input costs as their top concern in the upcoming year, they are becoming more worried about rising interest rates and the impact those higher rates will have on their operations.”

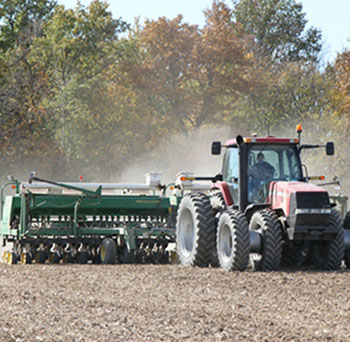
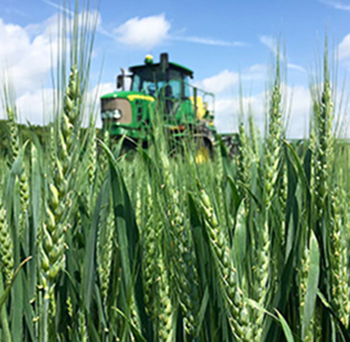
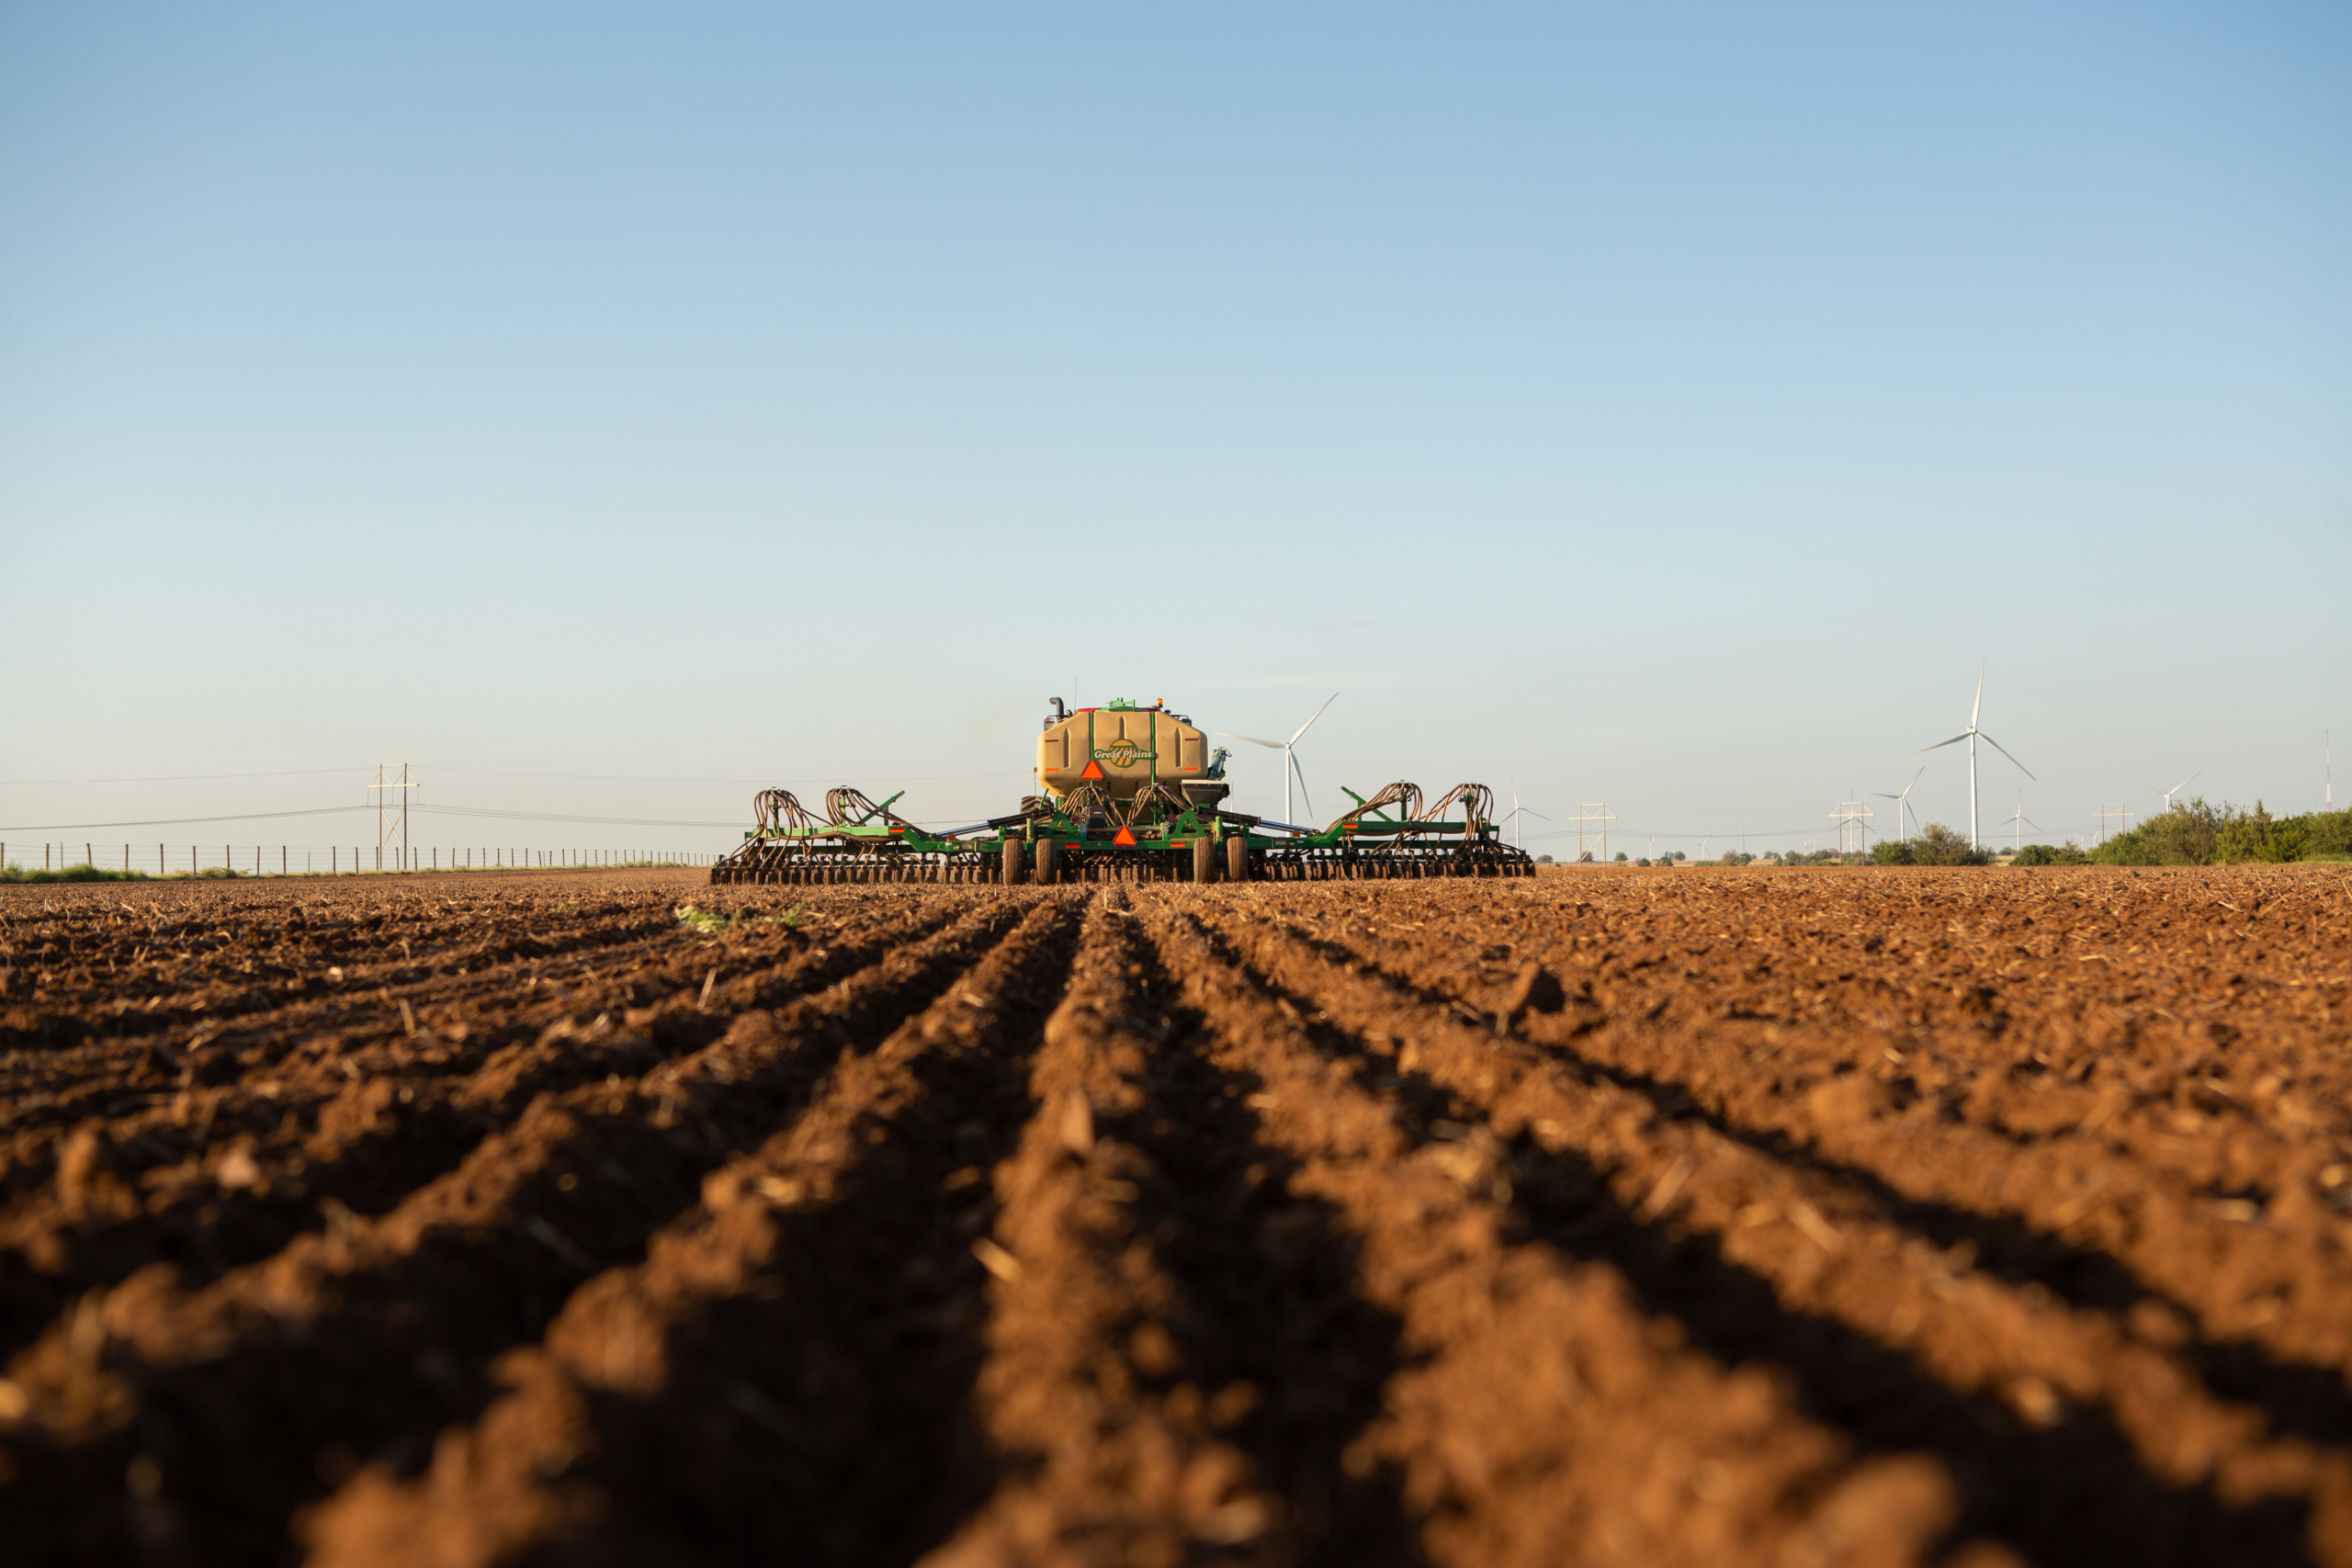
USW Vice Chairman Michael Peters, who farms in central Oklahoma, inspects an emerging hard red winter wheat crop a few years ago. As was the case back then, production input costs continue to be a major concern for wheat farmers all across the country. Weather and lack of rain, of course, is another point of worry.
But First, Here’s the Weather . . .
USW Vice Chairman Michael Peters, who grows hard red winter (HRW) wheat in Oklahoma, is the farmer who put the “mixed bag” label on his current inputs situation.
He has bigger problems with moisture, or lack thereof.
His farm being located on the Southern Plains, Peters has an added challenge he and other Oklahomans share with fellow producers in northern Texas, most of western Kansas and portions of Nebraska and Colorado.
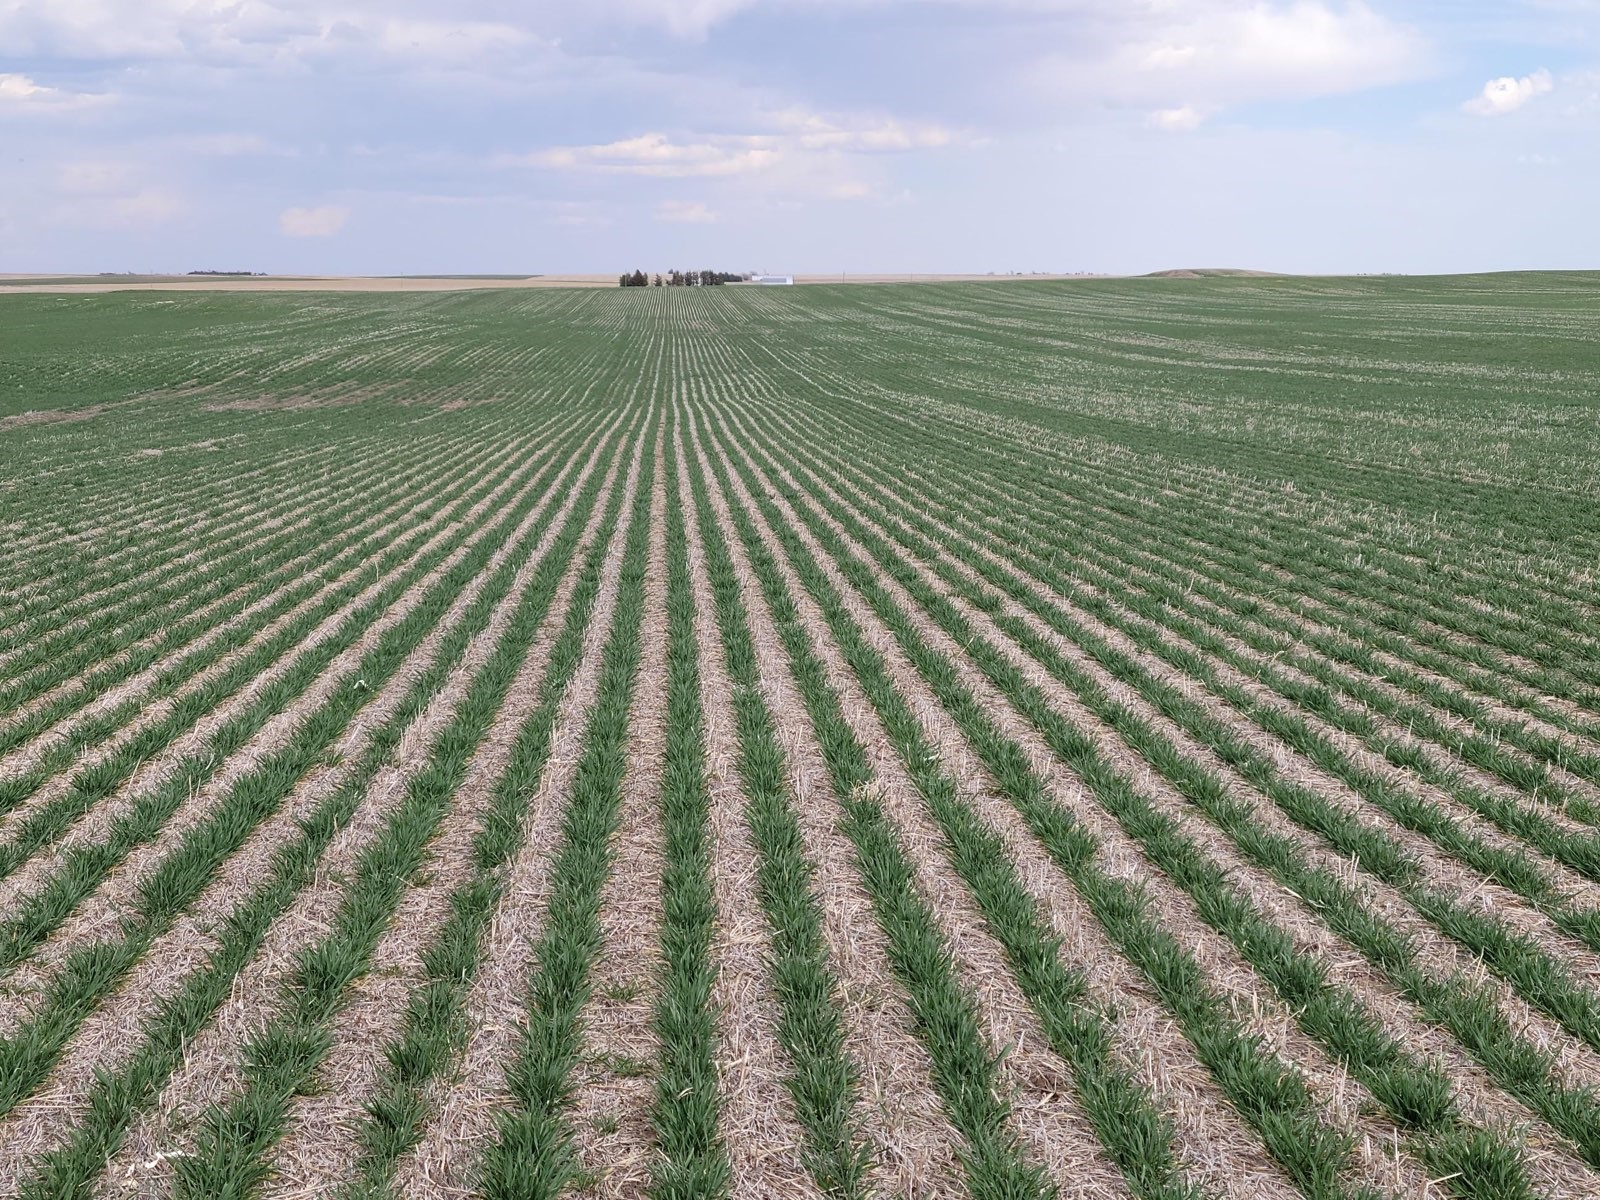
“The problem for my area is the lack of rainfall,” he said. “Our winter wheat crop is looking a little tough at this point.”
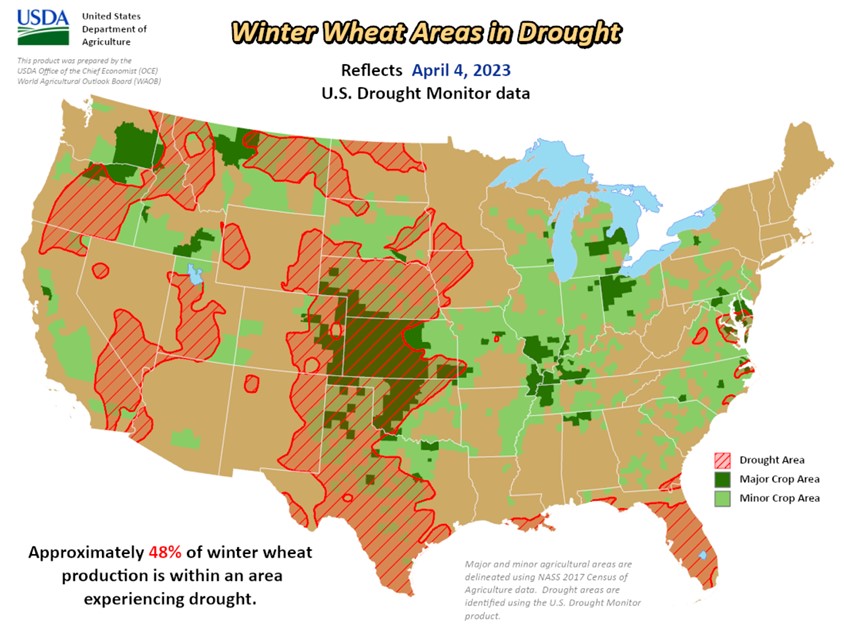
According to USDA, approximately 51% of U.S. winter wheat is produced in an area currently experiencing drought, down from 69% as the year began.
For Oklahoma, in mid-March the USDA rated 34% of the winter wheat crop in “good-to-excellent” condition. For Texas, 18% of the crop was “good-to-excellent.” Roughly 22% of Nebraska’s winter wheat crop was “good-to-excellent.”
Equipment Inputs Rise
While fertilizer and chemical prices have mostly decreased heading into the 2023 spring planting season, sticker shock on parts and machinery have stepped in to replace them as causes for consternation.
“The prices for parts to fix our equipment have really spiked, as have prices for equipment that we would need to purchase new,” said Scott. “The supply chain has still not caught up on some key things.”
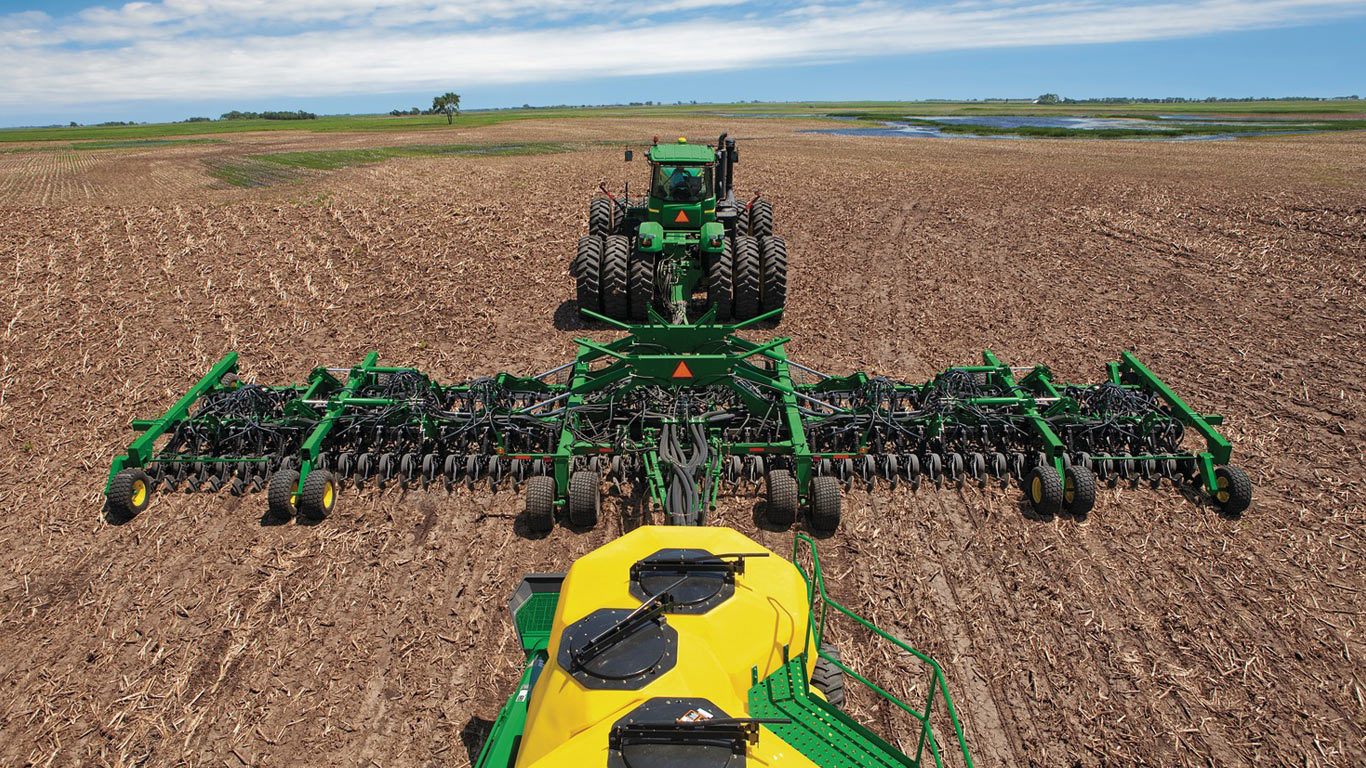
Part of the problem being recognized this spring is that there is a transition of sorts in the farming equipment arena. Fixing a broken-down combine or tractor used to take wrenches and a steady hand. Now repairs might require a mobile-device interface, online diagnostic tools and secure software updates. Those “parts” aren’t just hanging on someone’s wall.
As a result, breakdowns that might have been repaired in hours can now take days or weeks. During busy times such as spring planting and harvest, that can mean losing time and money.
“You really think about what you need to get you through the season and what you can do without,” said Peters. “There’s a lot of deferred maintenance on farms right now. When you see elevator prices seep down, you erase projects off your list. If prices start to spike, you add things to the list.”
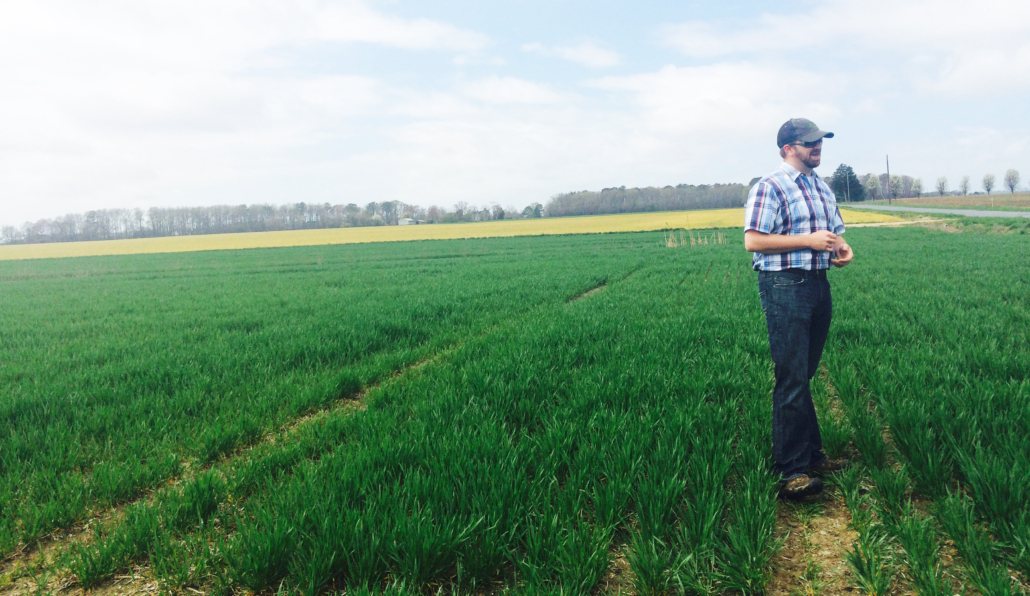
Jason Scott, a member of the USW Board of Directors who grows soft red winter wheat in Maryland, stands in one of his wheat fields during a spring tour of his farm.
Chemicals Leveling Off
“It’s this and that, up and down,” said Peters. “Some fertilizer prices have fallen. Chemicals are mixed, with prices on products like Roundup falling substantially. Other chemicals seem steady.”
Farmers Business Network (FBN) recently released its 2023 Ag Chemical Price Transparency Report, which highlights the extreme price variation facing farmers from coast to coast.
“The last two years have seen extreme fluctuations in chemical pricing for farmers,” said Kevin McNew, chief economist for FBN. “We know, this season in particular, a lot of farmers have postponed or waited a little longer than normal to make purchases because prices have been declining. We’re close to the point of needing those pre-emergents and I don’t think prices are going to slide much more.”
McNew also acknowledges higher interest rates make some farmers hesitant to borrow against an operating loan for chemical purchases.
“The takeaway is a lot of the inputs we’ve come to rely on like fertilizer, ag chem, and energy are going to remain high priced for the foreseeable future,” he said. “For years to come, in some sense. It is really important for farmers to think strategically about investing in new technologies that improve or reduce those inputs.”
The Bottom Line
Enduring volatility is what farmers do, so those preparing to harvest winter wheat and those getting ready to plant spring wheat will adjust to conditions.
It won’t be long until fall arrives and the process repeats itself.
As far as profits, every farm is different. USDA expects inflation-adjusted net farm income to drop 18%. But it notes last year’s net farm income was well above the 20-year average.
The decline will be felt a little differently in each sector of agriculture, said Seth Meyer, the USDA’s chief economist, who spoke at the 2023 Agricultural Outlook Forum in Arlington, Virginia.
Wheat acreage is expected to be its largest since the 2016-17 season, thanks to high prices and tight supply.
“After a period of trending lower (U.S.) wheat acres, this represents a sharp rebound, but is not likely to be a trend reversal for the long term,” Meyer said.
As always the biggest question about 2023 is grain prices, especially wheat prices, which are expected to remain strong, though lower than in 2022.
From a wheat farmer’s perspective, Peters summed it up in a simple manner.
“No matter who you listen to, everything is up and down, up and down,” he said.
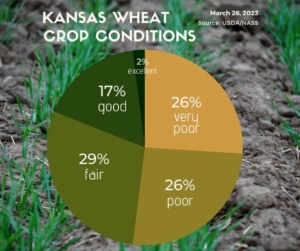

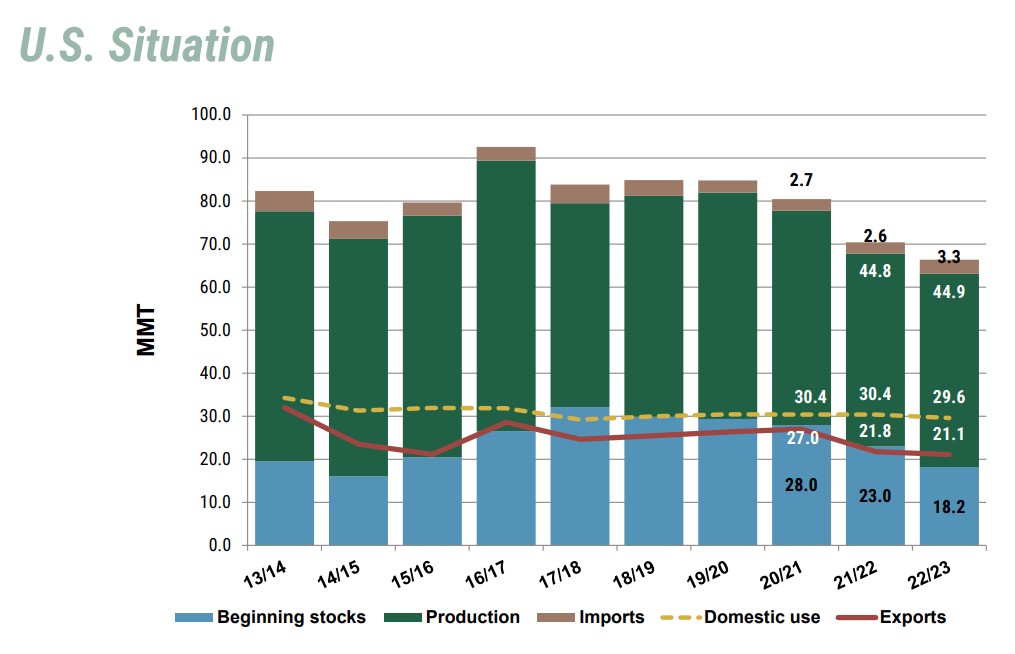
 According to USDA, the total HRW planted area fell slightly to 23.08 million acres. The area harvested fell more steeply at 15.24 million acres, 1.95 million acres less than in 2021/22. Overall U.S. HRW production is 14.5 MMT, 29 percent less than last year. Kansas, the largest HRW producing state, saw production drop 119,000 bushels compared to 2021/22. Oklahoma’s production dropped 40%, at 68,600 bushels, according to the Small Grains Report. Exports of HRW are forecast at 6 MMT, 30% less than in 2021/22. Year-to-date HRW sales of 3.1 MMT are 30% less than the pace last year. The top markets for HRW are Mexico, Japan, Nigeria, Brazil, and Colombia.
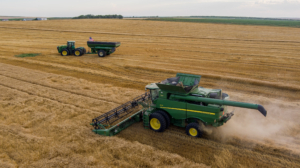 USDA estimates total HRS planted area in 2022 was 10.20 million acres, 390,000 fewer acres than 2021. The area harvest was up 5%, at 9.82 million acres. Heavy rain and cool temperatures early in the planting season slowed down spring wheat planting in parts of North Dakota and Minnesota. North Dakota HRS yield rebounded 49% from last year to 50 bushels per acre. USDA estimates total HRS production will rebound from last season and reach 12.1 MMT, 49% higher than in 2021. HRS exports are expected to reach 6.1 MMT, 400,000 MT higher than last season. Total HRS sales in 2022/23 were 2% higher than last year at 3.3 MMT. The top markets for HRS are the Philippines, Mexico, Japan, Taiwan, and South Korea.
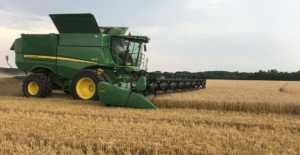
 White wheat planted area, which includes more than 99% soft white (SW), totaled 4.24 million acres in 2022. The area harvested is 4.02 million acres, nearly identical to 2021/22. Improved growing conditions in Washington and Oregon increased yields significantly. Washington yields are 61% higher than last year, while Oregon’s yields are 51% higher, according to the Small Grains Report. White wheat production is estimated at 7.4 MMT, 1.9 MMT more than in 2021/22. Exports are expected to reach 4.6 MMT. Total white wheat (soft and hard) sales in 2022/23 are 17% higher than last year at 2.5 MMT. The top markets for white wheat were the Philippines, Japan, China, and South Korea.