• Facebook
  • Twitter
  • Vimeo
  • LinkedIn
  • SUBSCRIBE
  • MEMBER LOGIN
U.S. Wheat Associates
  • Our Story
    • About USW
    • Dependable People. Reliable Wheat.
    • Board of Directors
    • Staff Directory
    • Office Locations
  • Market Information
    • Market Information
    • Price Reports
    • Price Charting Tools
    • Supply and Demand
    • Commercial Sales
  • Crop Quality
    • Crop Quality
    • Harvest Reports
    • Hard Red Winter
    • Hard Red Spring
    • Hard White
    • Soft White
    • Soft Red Winter
    • Durum
  • Working With Buyers
    • Working With Buyers
    • Customer Conferences
    • Wheat Classes
    • Wheat Glossary
    • Wheat Grade Factors
    • How to Buy
    • Ask the Expert
    • Resources
  • Who We Represent
    • Who We Represent
    • Board Meetings
    • State Wheat Commissions
    • Partners
    • Trade Activities
  • Policy
    • Policy
    • Trade Negotiations
    • Trade Barriers
    • Innovation and Sustainability
    • Food Security and Assistance
    • Public–Private Partnership
  • News
    • Newsroom
    • Wheat Letter Blog
    • News Releases
    • Videos
  • Search
  • Menu Menu
You are here: Wheat Letter Blog 1
Market and Crop Analysis, Michael Anderson

Global Wheat Stocks-to-Use Ratio Supports Bullish Prices Outlook

Wheat field to illustrate wheat stocks-to-use ratio story.

USDA’s August 2021 World Supply & Demand Estimates (WASDE) report trimmed expected global wheat production, reduced the global wheat stocks-to-use ratio and created a supply shock market rally. USDA dropped total production to 777 million metric tons (MMT), 15.4 MMT less than its July forecast, citing major weather problems in Russia, Canada and the United States. Global wheat use forecast for 2021/22 is 787 MMT.

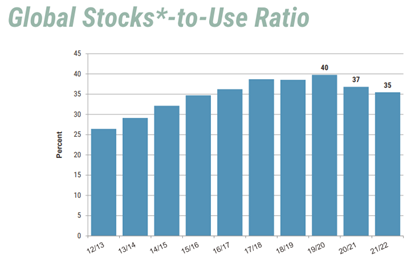
Wheat supply is of course a major variable in global price discovery and is related to the “stocks-to-use” ratio, representing the level of carryover stocks as a percentage of the total demand or use. These new USDA estimates reduced the global stocks-to-use forecast to 35%, which, if realized will be its lowest since 2016/17. If China’s massive wheat stocks are removed from the calculation (China exports very little wheat), the stocks-to-use estimate is 21.6%.

A chart showing global wheat stocks-to-use ratios for last 10 years.

Global wheat stocks-to-use percentage has declined after an eight-year run-up. Source: USDA August 2021 WASDE and USW Supply and Demand Report.

Guy Allen, Senior Economist at IGP Institute at Kansas State University, points out that an important consideration when looking at the wheat stocks-to-use ratio is to compare the ratio to corn as well. While wheat is primarily a food grain, it can compete with feed grains given relative prices or regional shortages. The current global stocks-to-use ratio forecast for corn is 24%, also lower than its ratio the past few years.

Supply Shock Source

How did the world get to this point? Global use continues to set records each year and ending stocks declined in 2020/21 and again this marketing year. It is major exporting countries taking the supply hit this year. In fact, Stratégie Grains, a French grains analyst, said that the stocks-to-use ratio for major exporting countries could fall to its second-lowest level on record after 2012/13.

USDA slashed Russia’s production forecast 12.5 MMT to 72.5 MMT. The Russian statistical agency, Rosstat, reduced the number of winter wheat acres harvested while the Ministry of Agriculture reported lower yields. In Canada, the Prairie Provinces saw production decline after persistent drought slashed yields by 24% compared to the 5-year average. USDA reduced its Canadian production forecast by 32% compared to 2020/21 to 24.0 MMT. If realized, it will be the smallest Canadian wheat crop since 2010/11.

U.S. Wheat Balance Sheet

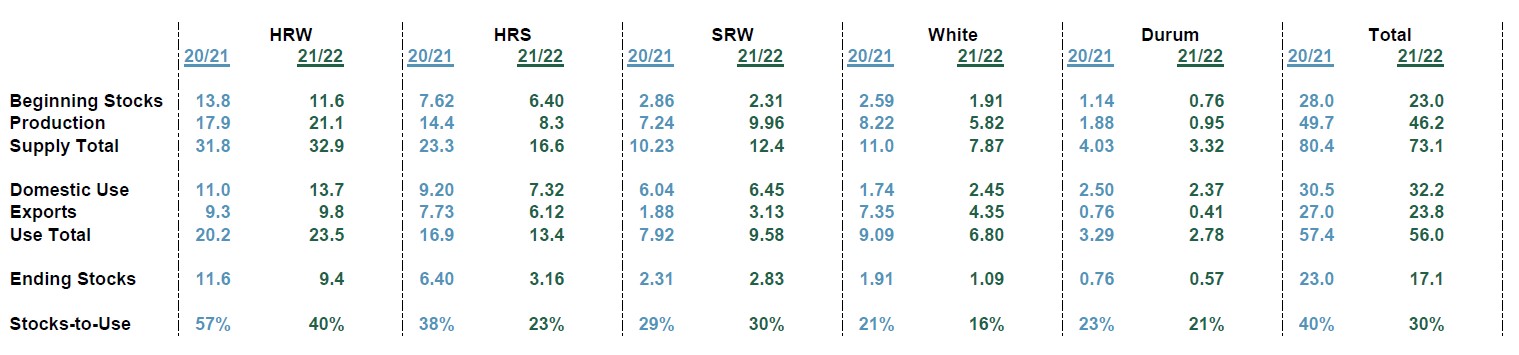
USDA also lowered U.S. production 7% compared to last year as drought has affected several wheat-growing areas including the Northern Plains states and the Pacific Northwest (PNW). The total stocks-to-use ratio in the U.S. is forecast at 30% for 2021/22, down 10% from 2020/21’s total stocks-to-use ratio of 40%. This is not surprising considering that all wheat classes started with lower beginning stocks in 2021/22 and of the five wheat classes tracked by the USDA in its monthly report all wheat classes except for hard red winter (HRW) and soft red winter (SRW) are expected to have lower ending stocks. Even with the higher production in HRW and SRW, the stocks-to-use ratio is forecast lower for all wheat classes in 2021/22. U.S. white wheat, primarily soft white grown in the Pacific Northwest (PNW) is the most affected with 16% stocks-to-use compared to 21% last year.

U.S. wheat stocks-to-use data for August 2021

USDA now expects the 2021/22 stocks-to-use ratio for each major U.S. wheat class to decline. Source: USDA August 2021 WASDE and USW Supply and Demand Report.

With harvest well underway for many classes (HRS, S.W.) and complete for HRW and SRW the market is getting a better indication of how accurate the USDA’s production number is. The September WASDE report will account for more known production in the United States and other major exporting countries. USDA will also publish its quarterly Grain Stocks report at the end of September that will also add to our understanding of how much wheat is available.

By USW Market Analyst Michael Anderson

August 19, 2021/by Erica Oakley
Share this
  • Share on Facebook
  • Share on Twitter
  • Share on WhatsApp
  • Share on LinkedIn
  • Share by Mail
https://www.uswheat.org/wp-content/uploads/2021/07/19JUL-ND-Wheat-Tour-D3-2-scaled-3.jpg 1920 2560 Erica Oakley https://www.uswheat.org/wp-content/uploads/USW-Logo-Full-Color.png Erica Oakley2021-08-19 12:00:002022-03-29 16:20:57Global Wheat Stocks-to-Use Ratio Supports Bullish Prices Outlook

Wheatletter Sidebar

Quick Links

  • Newsroom
  • Wheat Letter Blog
  • News Releases
  • Videos

Wheat Letter Related Blogs

A woman in a greenhouse at the Washington State University showing wheat breeding research to a Korean man.
Wheat Industry News

Wheat Industry News

News and Information from Around the U.S. Wheat Industry   Speaking of Wheat “The…
MORE
February 2, 2023
https://www.uswheat.org/wp-content/uploads/IMG_1653-scaled.jpg 1920 2560 Steve Mercer https://www.uswheat.org/wp-content/uploads/USW-Logo-Full-Color.png Steve Mercer2023-02-02 10:26:332023-02-02 10:26:33Wheat Industry News
Image shows farmers in a wheat field with the USW logo and World Wheat Supply and Demand headline to illustrate story on wheat prices.
Market and Crop Analysis

Wheat Prices Trend Lower Even As Uncertainty Continues

Following a year of dramatic volatility, several factors have pressured global wheat prices…
MORE
January 30, 2023
https://www.uswheat.org/wp-content/uploads/Wheat-SD.jpg 763 1318 Steve Mercer https://www.uswheat.org/wp-content/uploads/USW-Logo-Full-Color.png Steve Mercer2023-01-30 17:47:322023-01-30 17:47:32Wheat Prices Trend Lower Even As Uncertainty Continues

Stay up to date on wheat industry news!

SUBSCRIBE

Think Farm Export Programs Don’t Matter? Think Again.

GET THE REST OF THE STORY

Our Story

  • About USW
  • Dependable People. Reliable Wheat.
  • Board of Directors
  • Staff Directory
  • Office Locations

Market Information

  • Market Information
  • Price Reports
  • Price Charting Tools
  • Supply and Demand
  • Commercial Sales

Crop Quality

  • Crop Quality
  • Harvest Reports
  • Hard Red Winter
  • Hard Red Spring
  • Hard White
  • Soft White
  • Soft Red Winter
  • Durum

Working with Buyers

  • Working With Buyers
  • Customer Conferences
  • Wheat Classes
  • Wheat Glossary
  • Wheat Grade Factors
  • How to Buy
  • Ask the Expert
  • Resources

Who We Represent

  • Who We Represent
  • Board Meetings
  • State Wheat Commissions
  • Partners
  • Trade Activities

Policy

  • Policy
  • Trade Negotiations
  • Trade Barriers
  • Innovation and Sustainability
  • Food Security and Assistance
  • Public-Private Partnership

News

  • Newsroom
  • Wheat Letter Blog
  • News Releases
  • Videos

DTN Wheat Detail
DTN Corn Detail

2008-2013 U.S. Wheat Associates. All Rights Reserved
Privacy Policy | Non-Discrimination Statement

Scroll to top