thumbnail

By Stephanie Bryant-Erdmann, USW Market Analyst

This week, U.S. Wheat Associates (USW) holds its 2018 Fall Board of Directors meeting. At each board meeting, the USW Market Analyst presents an update on world and U.S. wheat supply and demand factors based on information from the U.S. Department of Agriculture, as of Oct. 11, 2018. Following are some highlights from the current report to the board.

  • 2018/19 global wheat production to fall for first time in 5 years.
  • Global supplies estimate to fall to 1,006 million metric tons (MMT); down 1 percent from the 2017/18 record.
  • Wheat production in Australia to fall to 18.5 MMT, 26 percent below the 5-year average.
  • U.S. wheat production estimated at 51.3 MMT, 8 percent above 2017/18.


  • Consumption forecast at a record 746 MMT, 4 percent above the 5-year average.
  • Chinese domestic consumption expected to reach 122 MMT, 5 percent above the 5-year average.
  • U.S. domestic consumption to grow 6 percent year over year to 31.1 MMT.


  • World wheat trade projected at 180 MMT, 4 percent above the 5-year average.
  • Australian exports to drop to 13.0 MMT, 10 percent below 2017/18, and the lowest level since 2007/08.
  • Exports from Russia to fall 15 percent year over year 35.0 MMT, still 28 percent above the 5-year average.
  • U.S. 2018/19 exports to increase to 27.9 MMT, up 14 percent from 2017/18, if realized.


  • World beginning stocks estimated at record 275 MMT, up 7 percent year over year.
  • Beginning stocks in Argentina forecast at 1.00 MMT, down 42 percent the 5-year average.
  • U.S. beginning stocks will fall to an estimated 29.9 MMT, 7 percent below 2017/18 levels.


  • Global ending stocks projected at 260 MMT, 5 percent below the record 2017/18 level, if realized.
  • Estimated Chinese ending stocks of 136 MMT account for 52 percent of global ending stocks.
  • Exporter ending stocks forecast at 58.8 MMT, down 24 percent year over year.
  • Ending stocks in importing countries to fall to 65.6 MMT, 15 percent below the 5-year average of 76.8 MMT.


  • Total U.S. wheat export sales for 2018/19 predicted to reach 27.9 MMT.
  • As of Oct. 11, 2018/19, U.S. wheat export sales were 18 percent behind last year’s pace.
  • About 27 percent of that difference represents temporary loss of the Chinese market.
  • Sales of soft red winter and durum are ahead of last year’s pace.


thumbnail

By Stephanie Bryant-Erdmann, USW Market Analyst

USDA updated its monthly World Agricultural Supply and Demand Estimates (WASDE) on Oct. 11, showing the United States to have the largest exportable supply of wheat in the world in 2018/19 following devastating losses in the European Union (EU) and Australia, and decreased production in Russia. Due to the decreasing exportable wheat supplies in these three countries (production plus beginning stocks minus domestic consumption), USDA expects the United States to have the largest exportable supply of wheat in the world in 2018/19 at 50.1 million metric tons (MMT).

Decreased production in half of the major exporting countries — Australia, the EU, Russia and Ukraine —   will result in global wheat production decreasing to 731 MMT, down 4 percent year over year and the lowest level since 2014/15, if realized. While global wheat production will fall for the first time in 5 years, USDA noted that global wheat consumption will reach a new record high of 746 MMT, 4 percent above the 5-year average.

Drought devastated wheat areas in the EU earlier this year and has now spread south to Australia.  USDA expects Australian total wheat production to fall to 18.5 MMT, 13 percent below last year and 26 percent below the 5-year average. Smaller Australian wheat production is also expected to result in 2018/19 Australian wheat exports falling to 13.0 MMT. If realized, that would be the lowest level of Australian exports since 2007/08, 26 percent below the 5-year average.

With Australian wheat exports decreasing sharply year-over-year, USDA expects U.S. white wheat exports to increase 11 percent from 2018/19 to 5.85 MMT, the highest level since 2011/12.

USDA expects 2018/19 U.S. wheat exports to reach 27.9 MMT, up 14 percent from 2017/18 and 7 percent above the 5-year average, if realized. Exports of five of the six U.S. wheat classes are expected to increase year-over-year, and hard red winter (HRW) exports are expected to remain above the 5-year average. Still, U.S. wheat export sales pace will need to increase to meet this goal, as year-to-date U.S. wheat export sales total just 11.6 MMT or 42 percent of USDA’s anticipated total.

thumbnail

By Stephanie Bryant-Erdmann, USW Market Analyst

On Sept. 28, USDA released its Small Grains Summary noting that 2018/19 U.S. wheat production increased to 51.3 MMT, up 8 percent from last year due to improvements in both average yield and harvested area. While this is still 8 percent below the 5-year average of 55.8 MMT, the 2018/19 production coupled with significant carry-in stocks ensure that the U.S. wheat store will remain open and well-stocked throughout 2018/19. Here is a look at 2018/19 U.S. wheat production by class.

Hard red winter (HRW). Last fall, U.S. farmers increased HRW planting in the U.S. Southern Plains due to favorable moisture conditions. That slight increase was not enough to offset decreased planted area in the U.S. Northern Plains where a long-term drought delayed, and in some cases, prevented winter wheat planting. Planted area in Montana fell 6 percent year over year. USDA reported HRW planted area at 23.2 million acres (9.39 million hectares), down 2 percent from 2017. Unfortunately, most of the Southern Plains received little to no moisture until spring, with some areas going from October to April without measurable precipitation. The poor weather caused Oklahoma wheat farmers to abandon 43 percent of their winter wheat area, up from both the 5-year average and the 2017/18 abandonment rate of 36 percent. The average HRW yield in Kansas and Oklahoma, the top two HRW-producing states, decreased 21 percent and 18 percent from 2017/18, respectively. With the drought causing both harvested area and average yields to fall, USDA estimates total 2018/19 HRW production dropped 12 percent to 662 million bushels (18.0 MMT). Though smaller in volume, 2018 HRW quality i is excellent. Read more here.

Hard red spring (HRS). Wet conditions slowed HRS planting but replenished depleted soil moisture across the drought stressed Northern Plains. USDA says U.S. farmers planted 12.1 million acres (4.90 million hectares) to HRS, up 17 percent from the year prior. The beneficial moisture boosting average HRS yields and harvested area. In North Dakota, the top HRS producing state, the average yield climbed 20 percent year over year to a record high 49.0 bu/acre (3.29 MT per hectare), up 41 percent from 2017/18. Idaho farmers also produced record high HRS yields. USDA now reports HRS production at 587 million bushels (16.0 MMT), up 53 percent from 2017/18.

Soft red winter (SRW). Last fall, U.S. farmers planted 5.85 million acres (2.37 million hectares) of SRW, up 4 percent from the year prior, but still 23 percent below the 5-year average. While planting conditions were generally favorable, depressed prices kept planted area low. In early 2018, several U.S. SRW growing areas received excessive moisture that decreased yield potential and the wet weather continued through harvest. USDA reported SRW production totaled 286 million bushels (7.78 MMT), down 2 percent from 2017/18 and 33 percent below the 5-year average of 429 million bushels (11.7 MMT). Read more here.

White wheat (including soft white, club and hard white). U.S. white wheat planted acres stayed close to the 5-year average at 4.15 million acres (1.68 million hectares) in 2018/19. A wet winter boosted yield potential for both the winter and spring crops. The average spring white wheat yield in Washington increased 20 percent to 54.0 bu/acre (3.63 MT per hectare). The slight increase in harvested area and significant improvement in average yields pushed 2018/19 total white wheat production to 272 million bushels (7.41 MMT), a 5 percent increase year over year, and 8 percent above the 5-year average of 252 million bushels (6.86 MMT).

Durum. Farmers planted less durum area this year in response to lower prices and large carry-out stocks during spring planting. USDA estimates 2.00 million acres (810,000 hectares) were planted to durum, down 13 percent from 2017/18 but still 9 percent above the 5-year average of 1.84 million acres (745,000 hectares). USDA estimated total 2018/19 U.S. durum production at 77.3 million bushels (2.10 MMT), up 41 percent from last year. Generally favorable weather boosted yields in the U.S. Northern Plains, with average durum yields increasing to 39.3 bu/acre (2.64 MT per hectare), up 13.3 bu/acre from last year when drought severely impacted the crop. Desert Durum® production fell 8 percent year over year to 10.5 million bushels (385,000 MT) due to sharply lower planted area in both Arizona and California.

thumbnail

By Stephanie Bryant-Erdmann, USW Market Analyst

It is no secret that global wheat production will fall this year due to unfavorable weather across the European Union (EU), Black Sea — Kazakhstan, Russia and Ukraine — and Australia. However, government policies are further constraining the global wheat supply, increasing costs and uncertainty for global wheat buyers.

Currently, there are two countries that have changed their export policies — Argentina and Ukraine — and a third, Russia, is thinking about it. These three countries account for an average 26 percent of global wheat exporter supplies and an average 50.7 MMT of global wheat exports. In Russia and Ukraine, the respective agricultural ministries are actively monitoring domestic wheat prices and wheat export quantities following a decline in 2018/19 production and rising domestic bread prices.

On Aug. 10, the Ukrainian Agricultural Ministry, in consultation with Ukrainian wheat traders, set the 2018/19 wheat export limit at 16.0 million metric tons (MMT), including 8.0 MMT of milling wheat. The export limit will cause Ukraine’s total wheat exports to fall by 7 percent year over year, but the milling wheat portion will fall by 20 percent compared to last year’s milling wheat export volume of 10.0 MMT. The export limit memorandum could be reviewed as early as the end of September, causing additional uncertainty about the availability of Ukrainian wheat.

On Sept. 3, the Russian Agricultural Ministry stated that it did not have plans to implement a grain export duty or “curb grain exports in any other way.” The Ministry released this statement following its second meeting with Russian grain exporters about export volumes in just 17 days. While the statement eased immediate concern from the markets (and resulted in 11 to 16 cent per bushel decreases for nearby wheat futures contracts on Sept. 4), the frequency of the meetings and letters obtained by Reuters have grain markets on edge.

As noted in the Aug. 23 Wheat Letter article A Risky Proposition, Russia implemented export taxes twice and completely banned wheat exports twice over the past decade. Each time, those policy changes resulted in significant, rapid price movement. Russia currently has an export tax on wheat that is set at zero percent, though it can adjust that tax at any time.

While Russia and Ukraine policies are adjusting to decreased domestic production and resulting increases in domestic prices, in Argentina, an export tax has been implemented in an attempt to shore up the domestic currency, which has fallen more than 50 percent compared to the U.S. dollar year over year. On Sept. 3, Argentina President Macri announced a 4 peso per dollar export tax on wheat and corn shipments.

According to International Grains Council (IGC) data, Argentine wheat has averaged $252 per metric ton (MT) since the beginning of the 2018/19 marketing year on June 1. This export tax will raise Argentine wheat prices by roughly 10 percent at today’s exchange rate of 39 Argentine pesos to 1 U.S. dollar, or about $25 per MT, on average. Argentine wheat production is expected to total 19.5 MMT, up 8 percent from 2017/18 and 35 percent above the 5-year average.

These policy changes and uncertainty from three of the world’s top wheat exporters come at a time when global wheat consumption is increasing and with it, the need for additional global exportable supply. USDA expects 2018/19 world wheat trade to rise 1 percent to a new record high of 184 MMT; if realized, it would be 6 percent greater than the 5-year average of 174 MMT.

With all of the uncertainty in the global wheat futures today, the U.S. wheat industry commitment to being the world’s most reliable supplier remains constant. Your local U.S. Wheat Associates representative stands ready to help with any questions about the U.S. marketing system, U.S. wheat supply and demand situation and U.S. wheat pricing.

To track U.S. wheat prices, subscribe to the USW Weekly Price Report.

By law, the only way to block U.S. grain exports is through a presidential declaration of national emergency. Importantly, a national emergency does NOT include short-term, fundamental rises in wheat prices or weakness in the U.S dollar. Further, the U.S. Constitution expressly forbids export taxes.

By Stephanie Bryant-Erdmann, USW Market Analyst

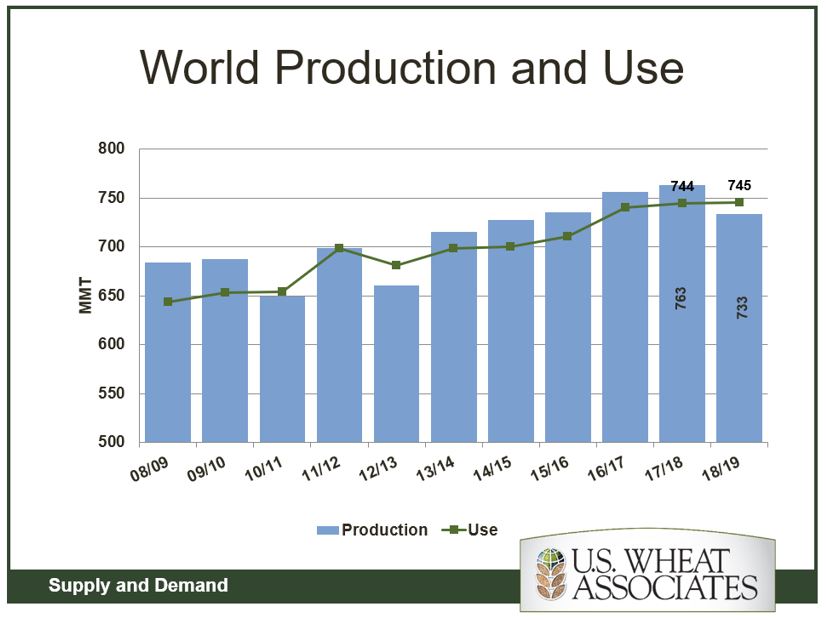
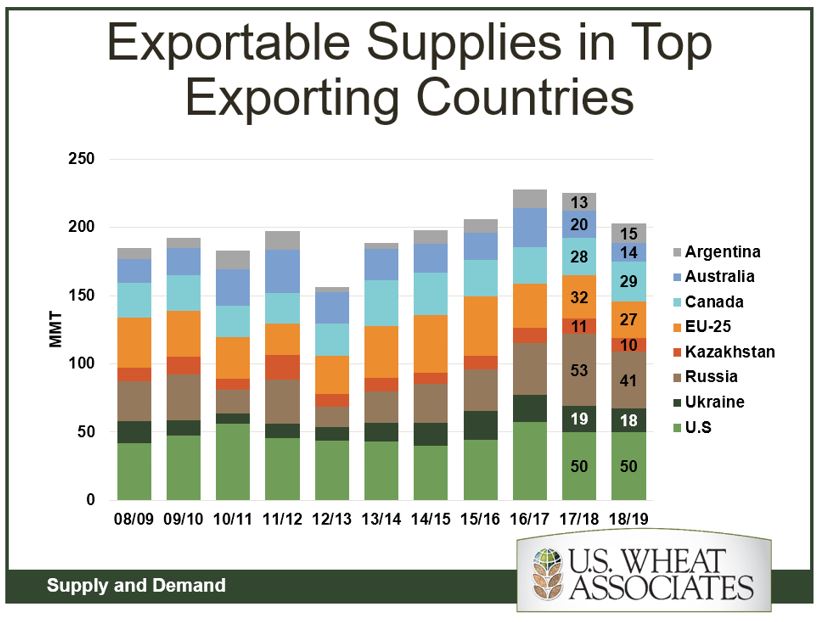
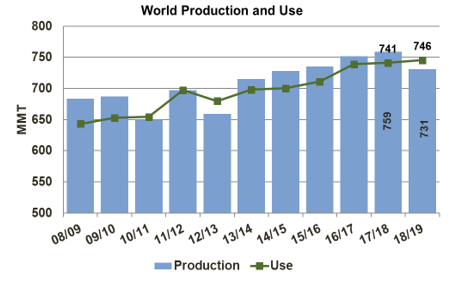
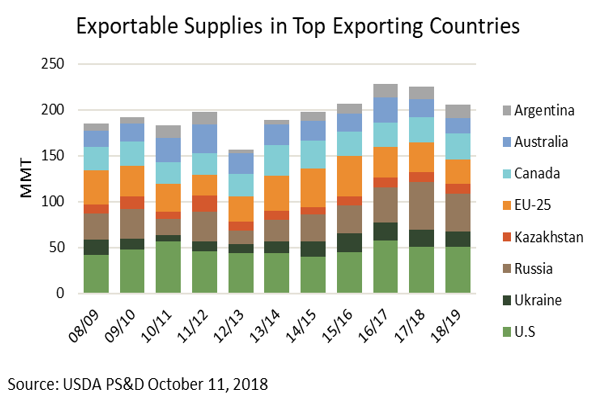
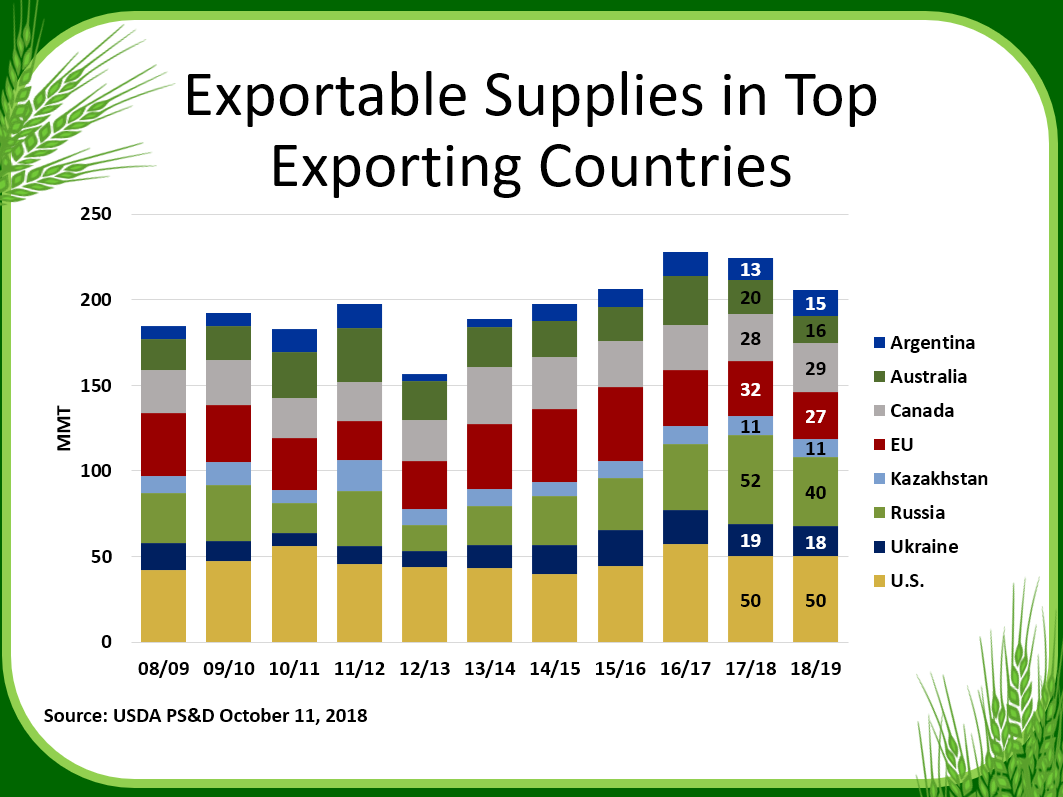
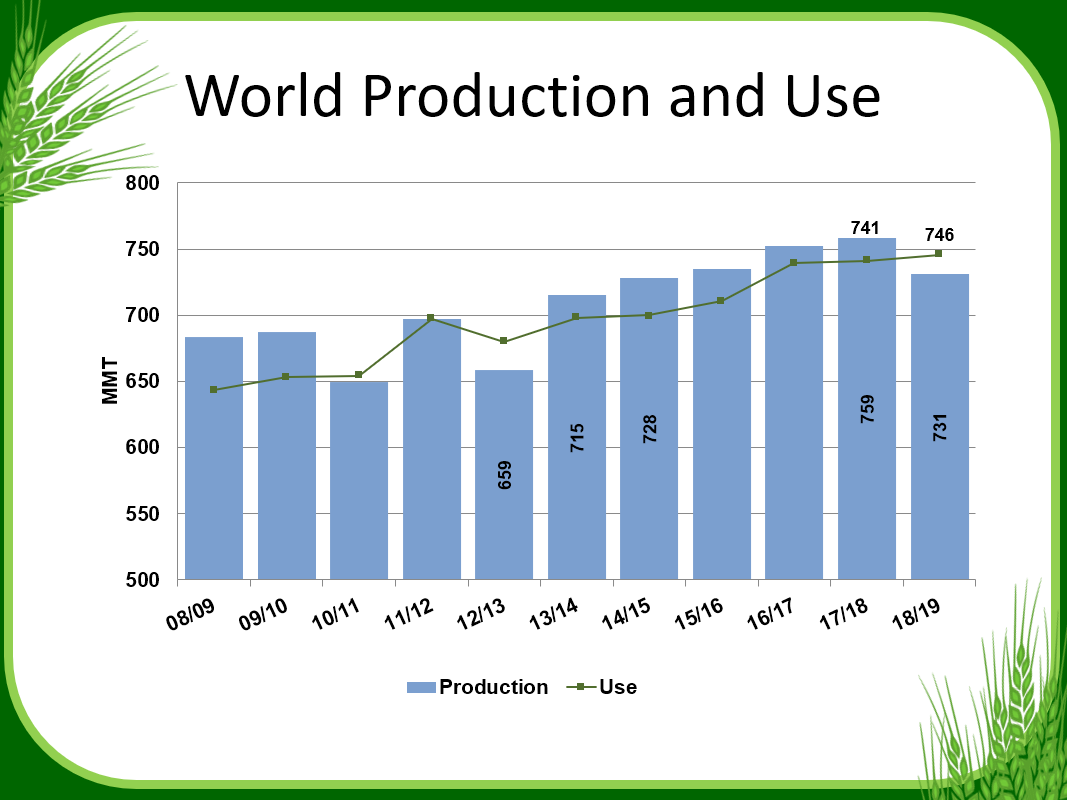
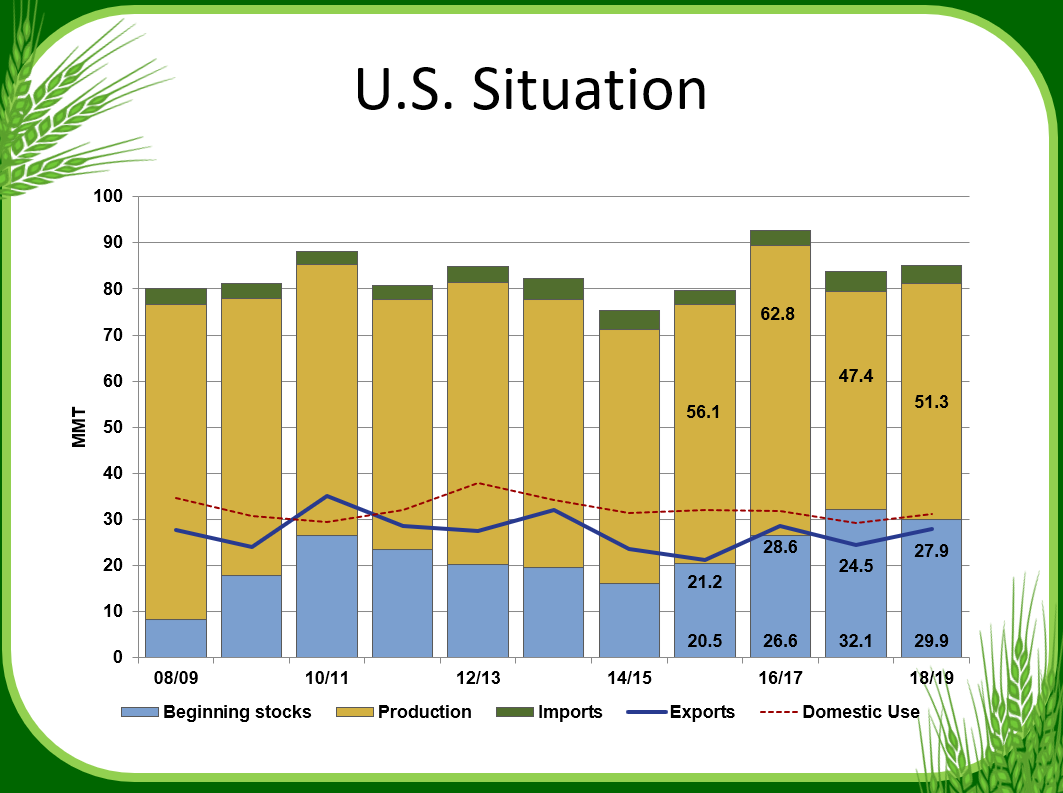
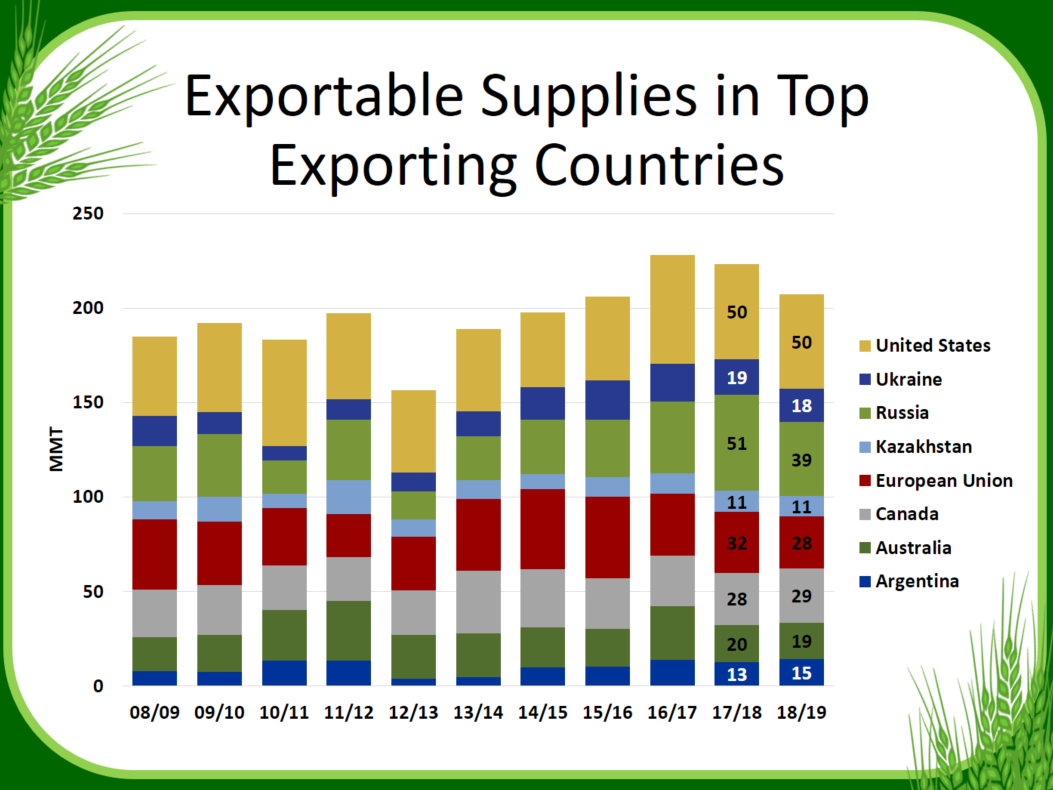
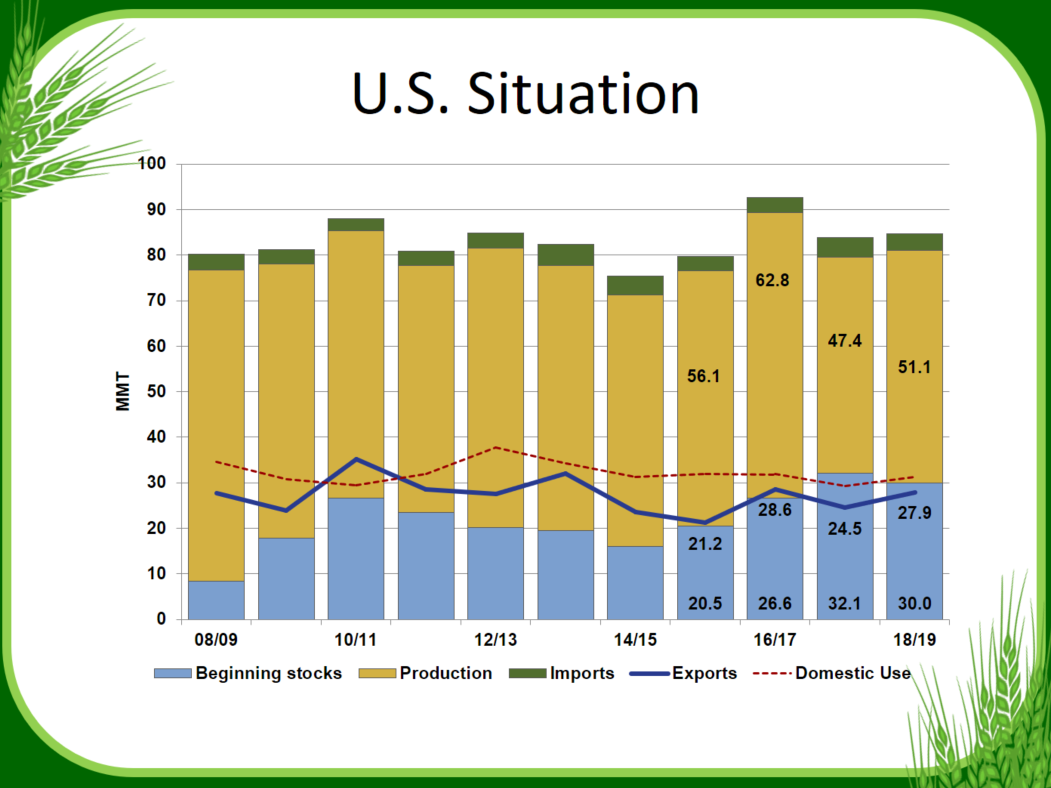
On Aug. 10, USDA increased its U.S. wheat export forecast to 27.9 million metric tons (MMT), up 14 percent from 2017/18, if realized. With 2018/19 global wheat production falling to 730 MMT, down 4 percent year over year, and supply in exporting countries shrinking to the lowest level in four years, USDA seems to anticipate global demand turning to U.S. wheat supply. That raises two questions:

  • Is there that much demand for U.S. wheat out there?
  • Can the U.S. grain transportation system handle the increase in wheat exports?

Is there that much demand for U.S. wheat out there?

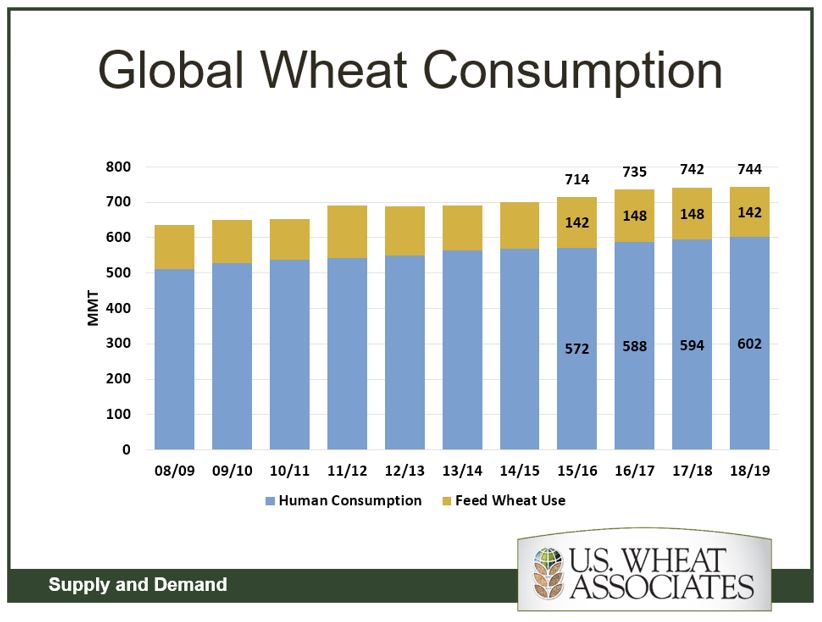
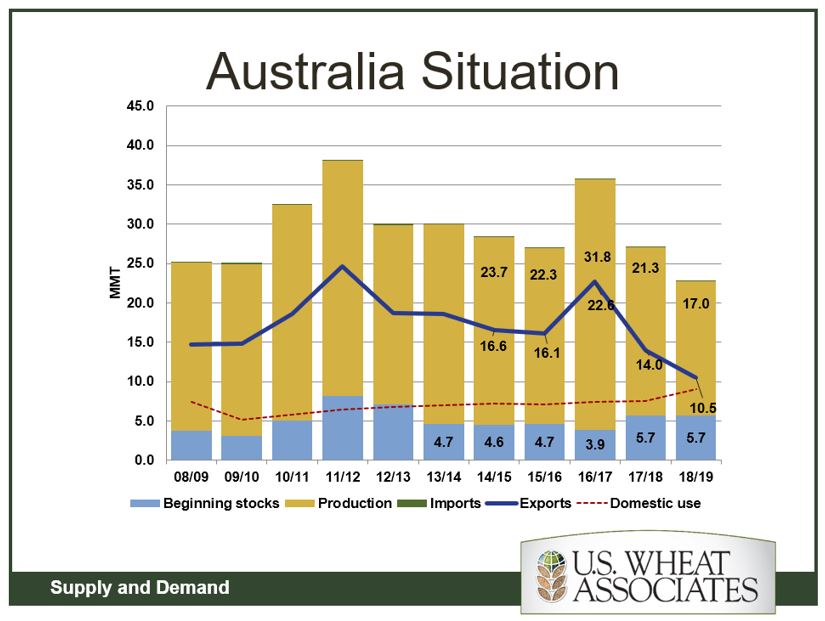
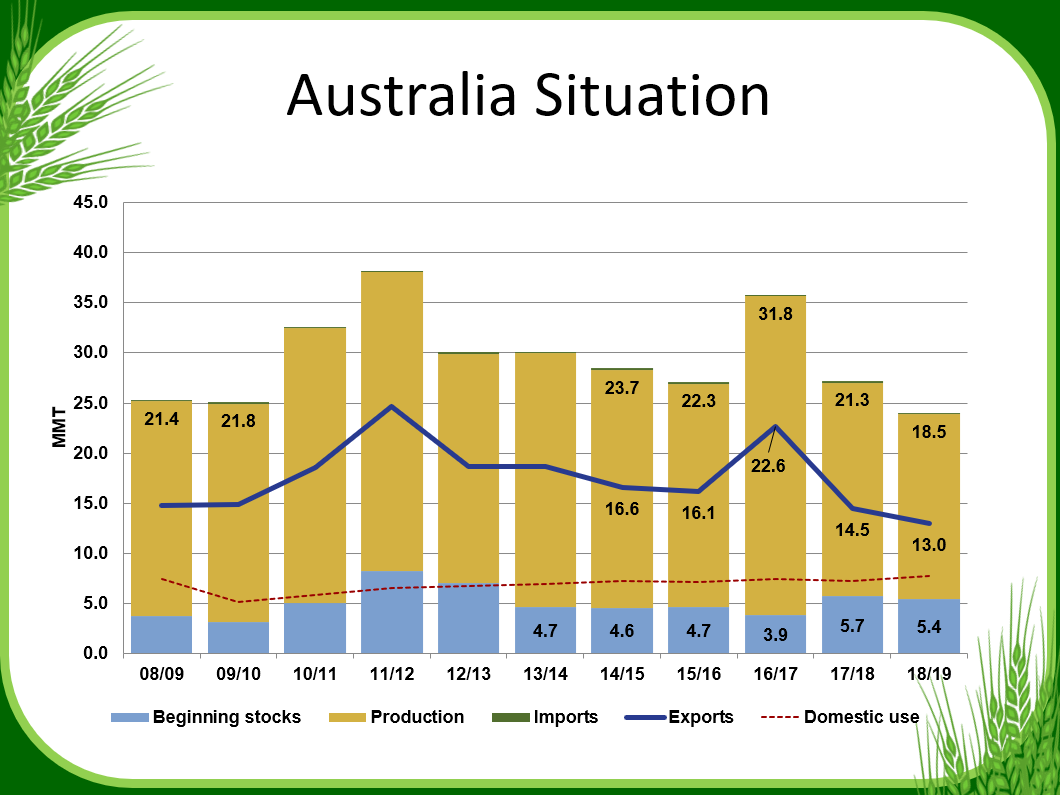
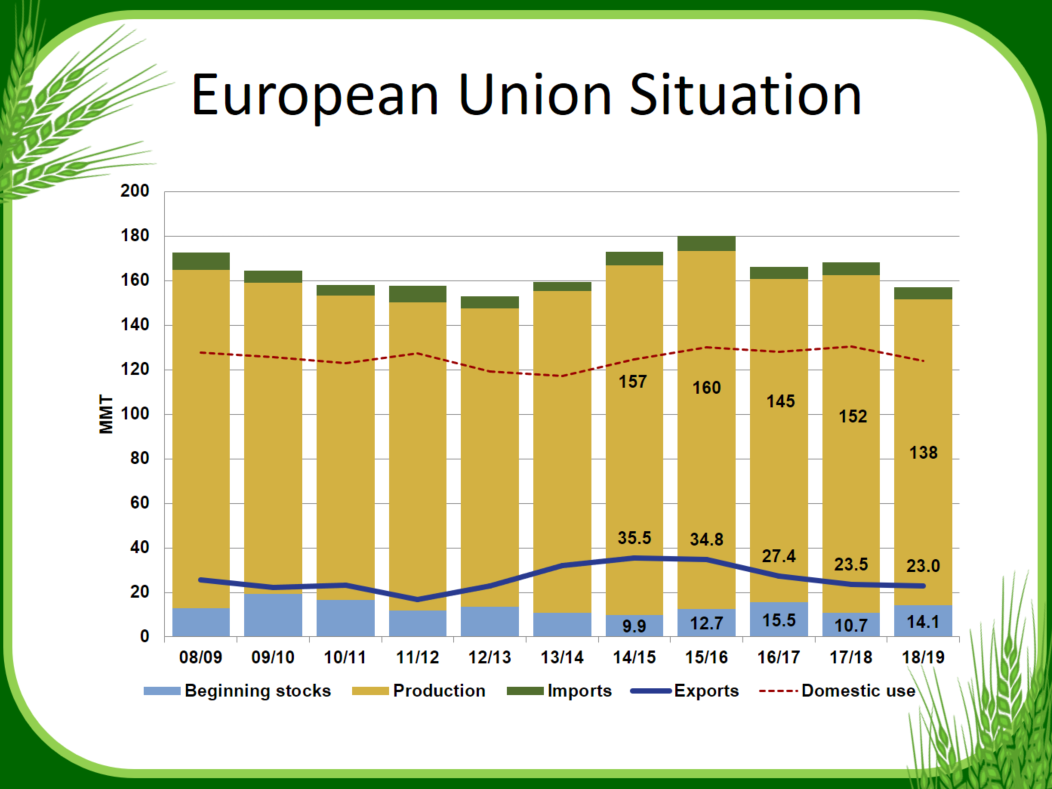
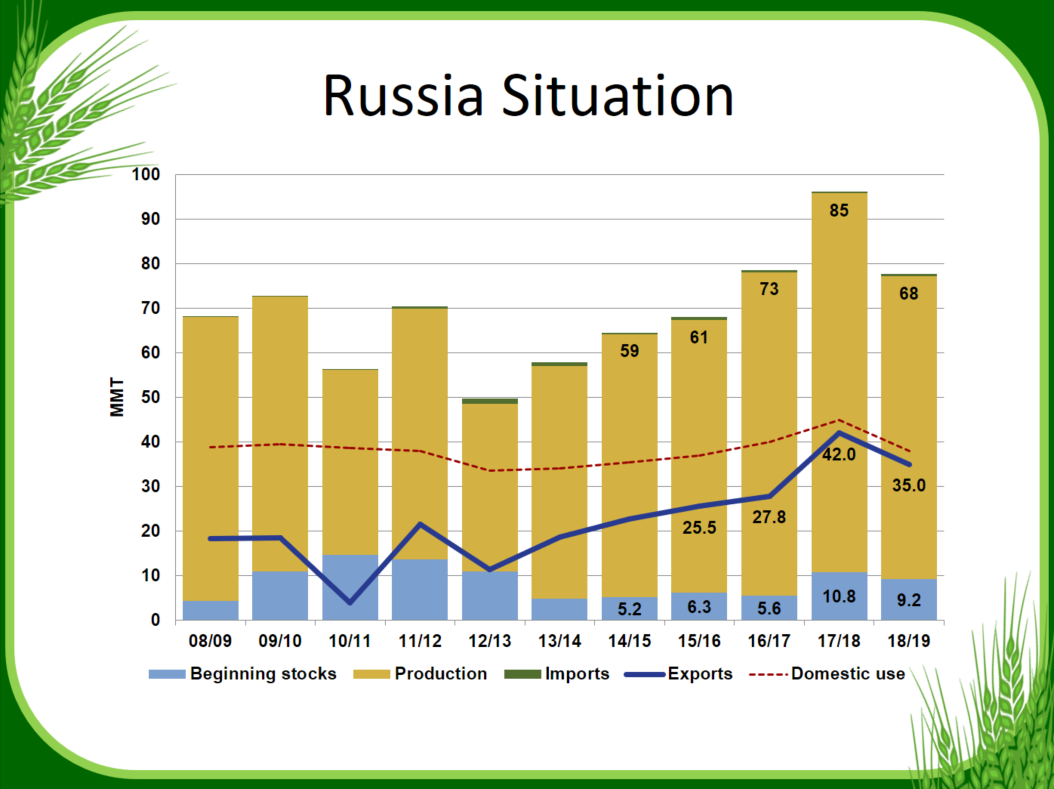
Based on USDA estimates, global wheat trade will need to increase to a new record high of 184 MMT in 2018/19 to meet global wheat consumption. With Russia and the European Union (EU) wheat exports expected to decline by a combined 7.5 MMT in 2018/19, and the extreme drought in Australia threatening its exportable supply, it is logical that U.S. wheat supplies will fill a crucial role in global wheat consumption.

Still, the United States will need to record an additional 19.6 MMT of export sales in the remaining 42 weeks of the 2018/19 marketing year, which began on June 1, or an increase in weekly sales from an average of 409,300 MT to 466,000 MT. Put another way, the United States needs to sell about two more vessels of wheat per week to reach the USDA estimate.

However, nearly two-thirds of that increase could come from just the top 20 U.S. customers, excluding China, based on historic buying patterns. For example, the top five U.S. wheat customers — Japan, Mexico, the Philippines, Nigeria and Korea — imported an average of 11.4 MMT of U.S. wheat exports the past five years. U.S. export sales to many top customers are behind last year’s pace, traders report continued interest in U.S. wheat and note that many customers are engaging in “just-in-time” buying patterns that result in large, last minute shipments that are challenging logistically. And that leads to the question:

Can the U.S. grain transportation system handle the increase in wheat exports?

The short answer is, “it depends.” The slightly longer answer is, “it depends on weather and trade policies.” Both of which are relative unknowns at this point. One thing is certain. Winter is coming and will bring, as it always does to some extent, cold weather and snow across the U.S. Northern Plains and Pacific Northwest (PNW) and ice and fog on the Mississippi River system, along with associated commodity movement delays.

During the winter months of December, January and February, U.S. Gulf all grain exports — including corn, sorghum, soybeans and wheat — average 6.67 MMT per month, down 24 percent from the peak month of October when 8.81 MMT of grain typically moves through the ports. For comparison, PNW all grain winter month exports average 3.13 MMT per month. This is an average 19 percent below the PNW peak export month of October when all grain PNW exports average 3.86 MMT.

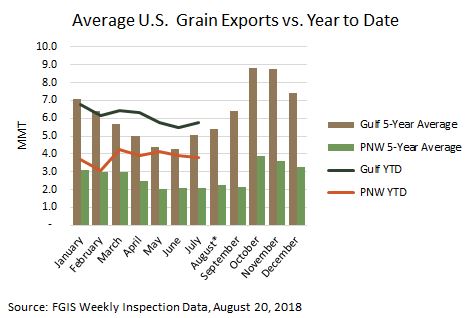
Trade policies will determine how much competition U.S. wheat exports face for freight and export elevation. U.S. Gulf grain exports center around four main commodities — corn, sorghum, soybeans and wheat, while U.S. PNW grain exports typically include barley, canola, corn, flaxseed, sorghum, soybeans and wheat. In the Gulf, soybeans account for roughly two-thirds of total grain shipments during the peak fall months of October and November. In the PNW, it is closer to 75 percent.

USDA’s August estimate is based on the current, enacted trade policies. As such, USDA expects U.S. feed grain and soybean exports to decrease by a combined 3.53 MMT year over year due primarily to decreased demand from China. In theory, reduced U.S. feed grains and soybean exports should increase freight and export elevation availability for wheat. However, through Aug. 16, there are already 8.86 MMT of U.S. corn export sales booked for the 2018/19 marketing year (beginning Sept. 1).  That is up 54 percent from last year and 12 percent above the 5-year average. U.S. soybean export sales for the new marketing year (beginning Sept. 1) are also up 45 percent year over year at 11.5 MMT. That increased drain on export capacity and the tightening global feed grain supply situation, as discussed in Ahead of USDA Report, Wheat Futures on a Powder Keg, indicate there may be upside potential for USDA’s estimates even with the existing uncertainty around U.S. trade policies. Customers should carefully watch the corn, soybean and feed grain supply and demand situation as it will impact freight and export elevation demand. While the expectation is that U.S. soybean and corn exports will be down, right now the data suggests otherwise.

With increased global demand for U.S. wheat likely and an uncertain outlook for U.S. transportation logistics, customers should take a serious look at the benefits of securing U.S. wheat supplies now. As always, the U.S. wheat store is open and ready to supply high-quality wheat — there just may be longer lines at checkout this year.

thumbnail

By Stephanie Bryant-Erdmann, USW Market Analyst

USDA updated its monthly World Agricultural Supply and Demand Estimates (WASDE) on August 10 and expects the global wheat supply and demand situation to be more favorable for U.S. farmers this year due to shrinking global wheat production. USDA lowered its global wheat production estimate by 6.63 million metric tons (MMT) to 730 MMT, down 4 percent year over year and the lowest level since 2014/15, if realized.

Widespread drought across Germany and northern Europe is one reason why USDA dropped its production forecast. USDA expects European Union total wheat production to fall to 138 MMT, 9 percent below both the 5-year average and 2017/18 production. With smaller EU wheat production, USDA lowered marketing year 2018/19 (June 1 to May 31) EU wheat exports to 23.0 MMT. If realized, that would be 2 percent below the year prior, and 25 percent below the 5-year average.

At the same time, USDA also expects Russian wheat production to fall 20 percent year over year to 68.0 MMT due to unfavorable winter wheat planting and growing conditions. With Russian wheat supplies shrinking, the 2018/19 Russian wheat export forecast is down 7.00 MMT from 2017/18 to 35.0 MMT.

With lower exportable wheat supplies (production plus beginning stocks minus domestic consumption) in Russia and the EU, USDA expects the United States to have the largest exportable supply of wheat in the world in 2018/19 at 49.7 MMT.

Consequently, USDA expects 2018/19 U.S. wheat exports to reach 27.9 MMT, up 14 percent from 2017/18 and 7 percent above the 5-year average, if realized. Still, U.S. wheat export sales pace will need to increase to meet this goal, as year-to-date U.S. wheat export sales total just 7.53 MMT or 27 percent of USDA’s anticipated total.

The shrinking global wheat supply, increasing global wheat consumption and large U.S. wheat supply have all lead to U.S. wheat futures rallies over the past month. Since the last WASDE update on July 12, U.S. HRW futures are up 72 cents per bushel ($26 per MT), SRW futures grew 54 cents per bushel ($20 per MT) and HRS climbed 67 cents per bushel ($25 per MT).

Each month, U.S. Wheat Associates (USW) updates a graphic summary of USDA’s WASDE (World Agricultural Supply and Demand Estimates) report. View the August summary here.

thumbnail

U.S. farmers are making good progress now on the second half of their 2018 winter wheat harvests and U.S. Wheat Associates (USW) wants to provide a mid-season look at winter wheat harvest and quality in this “Wheat Letter” entry. USW publishes a new Harvest Report every Friday on this website.


Soft Red Winter (SRW) harvest of a crop that was quite affected by rain throughout the growing season is now complete. Planted area was up somewhat compared to last year’s record low level. With abundant rain, yields were above average for the year but test weights from crops in both the East Coast and Gulf port tributaries are less than last year and the 5-year average. That knocks down the U.S. Grade for this crop to #3 SRW. DON levels are slightly higher in 2018 but are below the 5-year average. Processers should find good qualities for crackers overall and for cookies from segments of the crop. With higher protein and good extensibility, the crop should also be valuable for blending for baking applications. USW will post the final SRW quality report within the next few weeks.

John Hoffman SRW Wheat

Past USW Director John Hoffman of Circleville, Ohio, just beat the rain to complete his 2018 SRW harvest.


Hard Red Winter (HRW) harvest is more than 80 percent complete and buyers should want to take a very good look at the 2018 crop. Starting with another record low planted area, USDA believes farmers will harvest 17.9 million metric tons (MMT) of HRW this year or 12 percent less than in 2017. That amount is likely to change as USDA measures the effects of abandoned area in drought stressed areas of the Southern Plains. For buyers, however, this is a very good supply of HRW with composite protein holding at 12.6% (12% moisture) and test weights at 79.7 kg/hl (60.6 lb/bu). Quality reports from Montana’s harvest are even better. While flour and dough properties are just being measured for this crop, domestic millers and processors are saying they like what they see in this HRW crop.

HRW Harvest Peter Miller

HRW farmer Peter Miller of Lodgepole, Nebraska, posted this photo on his Twitter account @pmiller1320 on July 23.


Soft White (SW) winter wheat growing conditions across the Pacific Northwest (PNW) were nearly ideal for the 2018 crop. As of Aug. 3, the PNW SW harvest was 55% complete in Oregon (sadly aided by destructive fires in the north-central part of the state), 28% in Washington and 12% in Idaho. Industry sources say continued dry weather has pushed progress beyond those levels since early this week. Dryland yields are well above normal and early quality analysis indicate good test weight at 61.8 lb/bu (81.3 kg/hl), very low moisture content at 8.4%, low protein at 9.4% (12% moisture basis), and sound falling number value at 305 seconds.

Harvest Time Logan Padget

Logan Padget, son of USW Secretary-Treasurer Darren Padget, of Grass Valley, Oregon, posted this beautiful image of SW “Harvest Time” on their farm July 23.


We hope you will subscribe to USW’s Harvest Report and if you want to ask questions about this year’s crops or about other topics related to U.S. wheat and U.S. wheat exports, visit our new “Ask the Expert” section of this website at https://www.uswheat.org/market-and-crop-information/ask-the-expert/.


thumbnail

By Stephanie Bryant-Erdmann, USW Market Analyst


There is an old saying: “When there’s blood on the streets, buy property.” Given recent price movements, that could easily be changed to: “When trade policies are in the news, buy wheat.”


Since the steel and aluminum tariffs went into full effect for major U.S. wheat customers, September Kansas City hard red winter (HRW) wheat futures have fallen 51 cents per bushel ($19 per metric ton [MT]), September Chicago soft red winter (SRW) wheat futures dropped 25 cents per bushel ($9 per MT) and Minneapolis hard red spring (HRS) plunged 58 cents per bushel ($21 per MT).


Seasonal harvest pressure always impacts U.S. wheat prices during the summer months; however, this year the unique trade environment is also pressuring export demand and driving U.S. wheat prices lower. As of July 19, U.S. export sales for marketing year 2018/19 (June 1 to May 31) totaled 6.43 MMT, down 32 percent year over year. Exporters note that customers are choosing to purchase smaller than normal volumes of U.S. wheat, just what they need for the short-term or are waiting to make purchases, noting uncertainty about U.S. trade policies and their own countries’ retaliatory measures. Sales to the top five U.S. wheat customers — Mexico, Japan, the Philippines, Korea and Nigeria — are 27 percent behind last year’s pace.


Futures v Global S&D

U.S. wheat futures prices are not reflecting global supply and demand realities. Buyers are uncertain about the effects of unforeseen tariff wars and have altered their typical wheat import cadences.

With trade policy issues dominating the headlines, U.S. wheat futures markets are mostly ignoring global wheat supply and demand fundamentals, which can be seen in competitors’ wheat prices. The average global wheat price is up 41 cents per bushel ($15 per MT) with larger increases noted in Australia and Argentina, which compete with the United States in key quality-driven markets. According to International Grains Council (IGC) data, the average price of Australian wheat is up $19 per MT and the average price of Argentine wheat is up $75 per MT. These price increases are driven by increased global wheat demand, shrinking global wheat supplies and their location.


USDA noted in last week’s World Agricultural Supply and Demand estimates that global wheat production will fall to 737 MMT in 2018/19, the first drop in 5 years and down 3 percent from 2017/18. Decreased production is expected in the European Union (EU), Russia, Ukraine, Kazakhstan, and Australia. While the United States, Canada and Argentina are expected to have increased production, exporter supplies are expected to fall 20.2 MMT year over year.


Simultaneously, many importers are engaging in “just in time” purchases since wheat price movement has rewarded their patience the last few years. USDA expects importer ending stocks to fall to 49.8 MMT in 2018/19, the lowest amount in a decade.


While importer stocks are shrinking, USDA expects global wheat demand to surge to a new record high of 749 MMT, 4 percent above the 5-year average. That means that global wheat consumption will outpace global wheat production by 12.6 MMT this year and drop the global wheat stocks-to-use ratio (excluding China) to less than 20 percent. A level that has not been seen since 2007/08.


For perspective, in July 2007 all three wheat futures were above $6.00 per bushel ($220 per MT) and would continue climbing until March 2008 when prices peaked at $11.60 per bushel ($426 per MT) for SRW, $12.17 per bushel ($447 per MT) for HRW and $17.30 per bushel ($636 per MT) for HRS. On Friday, July 20, those three futures were at $5.16 per bushel ($190 per MT), $5.08 per bushel ($187 per MT) and $5.55 per bushel ($204 per MT), respectively, indicating there is a lot of room for upward mobility.


With exporter supplies shrinking and importers continuing a “just in time” purchasing pattern, global wheat prices are sitting on a powder keg that trade policy issues are currently disguising. Customers should take advantage of current U.S. futures price levels and lock in the competitive prices.


To track U.S. wheat export prices, subscribe to the USW Weekly Price Report.

thumbnail

By Elizabeth Westendorf, USW Assistant Director of Policy


Dumping in international trade is the export by a country or company of a product at a price that is lower in the foreign market than the price charged in the domestic market. U.S. Wheat Associates (USW) for many years has raised concerns about the Turkish government’s complex inward processing regime (IPR) that creates incentives to its milling industry to export flour at prices that are less than domestic flour prices.


In June, I traveled to Haiti to see firsthand the effect that Turkish flour dumped on the local market has on its domestic mills. Turkish flour is undermining domestic mills in countries around the world, including the Philippines, Angola, Indonesia, and Malaysia. This harms both U.S. wheat exports through market displacement and stifles the growth of local flour milling industries, potentially leading to closed mills and lost jobs.


Additionally, in countries like Haiti that are on the UN’s Least-Developed Countries list, these cheap flour imports can have a detrimental effect on development in the country. Local mills in Haiti provide needed value-added industry and employment. These mills are involved in the Haitian community and often contribute to educational efforts in local schools and other philanthropic pursuits that aid the country.


The French cultural influence is obvious in popular Haitian bread styles, made with flour from high quality U.S. wheat milled in Haiti.

Turkish flour companies exporting to Haiti do not do any of these things, and flour imports do not need nearly the same amount of labor. These factors mean that not only do these flour imports hurt Haiti’s mills and U.S. wheat exports, but also the Haitian people who benefit from the presence of this industry, imposing long-term costs on the country.


Over the past five years, Turkey has emerged as the world’s largest exporter of wheat flour, accounting for roughly a third of all flour exports globally.  Turkey exports over 70 percent of its flour to Iraq, Syria, and countries in Africa, but it reaches 160 countries worldwide and expands exports virtually every year. The rub is that this growth is not due to superior product or competitive advantage, but rather due to unfair government support systems that artificially encourage dumping flour on world markets.


Flour mills in Turkey can import wheat duty free under Turkey’s IPR. Under WTO rules, the wheat used in flour exports must be the same quality and characteristics as the imported wheat for the IPR to comply with WTO rules. However, there is no evidence that Turkey enforces this requirement, leading to an enormous incentive to export flour. They import high quality wheat for their domestic market and export lower quality flour made from domestic wheat. Several countries have successfully pushed back on this practice of dumping flour on export markets by opening investigations against Turkey. The Philippines successfully completed an anti-dumping investigation in 2014 against multiple Turkish flour exporters, and Indonesia invoked a global safeguard for wheat flour in 2012.


The root of this problem is policy in Turkey where trade remedies have no effect. If subsidized Turkish flour is blocked by trade remedies in individual markets, the incentives still exist for it to go somewhere. Flour exporters will keep finding vulnerable markets to dump their product in, and other countries like Haiti will suffer. This problem will only be fixed when Turkey follows its WTO commitments.


thumbnail

By Stephanie Bryant-Erdmann, USW Market Analyst

USDA raised 2018/19 U.S. wheat production to 51.2 million metric tons (MMT), up 8 percent from 2017/18, if realized. Along with the increase, USDA also released its first U.S. by-class forecast for U.S. wheat. Increases in hard red spring (HRS), soft red winter (SRW) and soft white (SW) wheat are expected to more than offset a 12 percent year over year reduction in hard red winter (HRW). U.S. spring wheat production is expected to increase to 15.9 MMT, up 52 percent from the previous year when drought shriveled the crop.

But while wheat production is expected to increase in the United States, it is expected to fall globally in 2018/19. USDA forecast 2018/19 total world wheat production at 736 MMT, down 3 percent from the year prior, if realized. The largest decrease is expected in Russia, which is forecast to produce 67.0 MMT, down 18.0 MMT from 2017/18 due to poor growing conditions. Wheat production is also expected to fall in the European Union (EU) and Australia due to dry conditions.

While 2018/19 world wheat production is expected to fall for the first time in 5 years, world wheat consumption is expected to grow 5.23 MMT from the previous year to 749 MMT. If realized, world wheat consumption will outpace world wheat production by 12.6 MMT in 2018/19.

With consumption outpacing production, world wheat ending stocks are expected to fall to 261 MMT, down 5 percent from 2017/18. The reduction in ending stocks puts the 2018/19 global stocks-to-use ratio (excluding China) just under 20 percent, which is the lowest level since 2007/08.