Editor’s Note: The following excerpts appear with permission from an article by Michelle Smith was published in “World Grain” on March 11, 2024.
Because the quality and attributes of flour can vary by season and variety, it’s important for bakers to understand what works best in their products. One tool that can help them determine flour quality is Solvent Retention Capacity (SRC) testing, said Sean Finnie, director of the Western Wheat Quality Laboratory with the U.S. Department of Agriculture’s (USDA) Agricultural Research Service.
He spoke about SRC testing at the American Society of Baking’s BakingTech 2024 conference, held Feb. 27-29. He is part of a team that works to improve wheat quality by identifying desirable traits, testing for them and working with breeders to enhance those traits.
“The way I see bakers using SRC data is the ability to make a profile of the flour you want,” Finnie said. “I think inherently bakers can look at and touch dough and know when something’s wrong. … If I were a baker, I would look at SRC data as a way of quantifying the inherent ability that you could just touch and feel when those are off, but you’ll know some issues before you actually make the dough.”
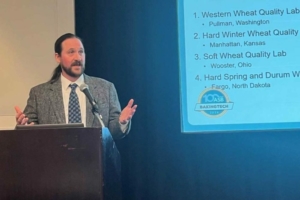
Sean Finnie, director of the Western Wheat Quality Laboratory with the USDA’s Agriculture Research Service, spoke at BakingTech 2024 in Chicago, Ill. He is part of a team that works to improve wheat quality by identifying desirable traits, testing for them and working with breeders to enhance those traits. Credit: ©SOSLAND PUBLISHING CO.
If bakers have a particular wheat flour they like, solvent retention capacity testing would provide the flour properties of that wheat and could help bakers make a profile of it.
“You can customize what your profile is and help identify attributes that make the flour more consistent from lot to lot,” Finnie said.
Read the rest of the article in World Grain at https://www.world-grain.com/articles/19724-using-src-testing-to-improve-wheat-quality.
Scientists at the federal wheat quality labs are using SRC to determine how well new and existing U.S. wheat varieties will perform in the mill and bakery. As a service to its wheat milling and baking customers, U.S. Wheat Associates (USW) provides a range of technical support that is unmatched in the global wheat trade. One of the most valuable is helping customers apply solvent retention capacity to better predict the true performance characteristics of flour for biscuits (cookies), crackers and cakes, as well as many hard wheat flour applications.
A Reflection of Functionality
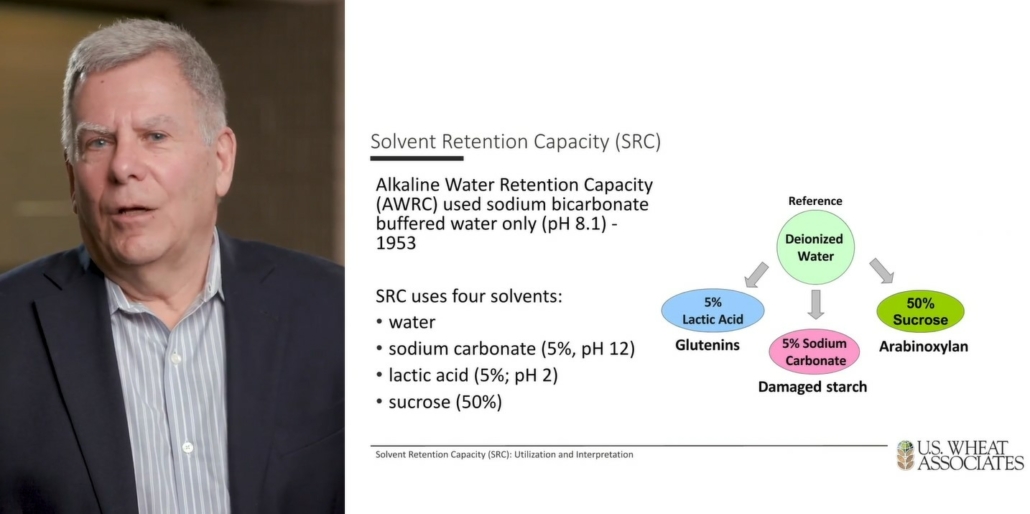
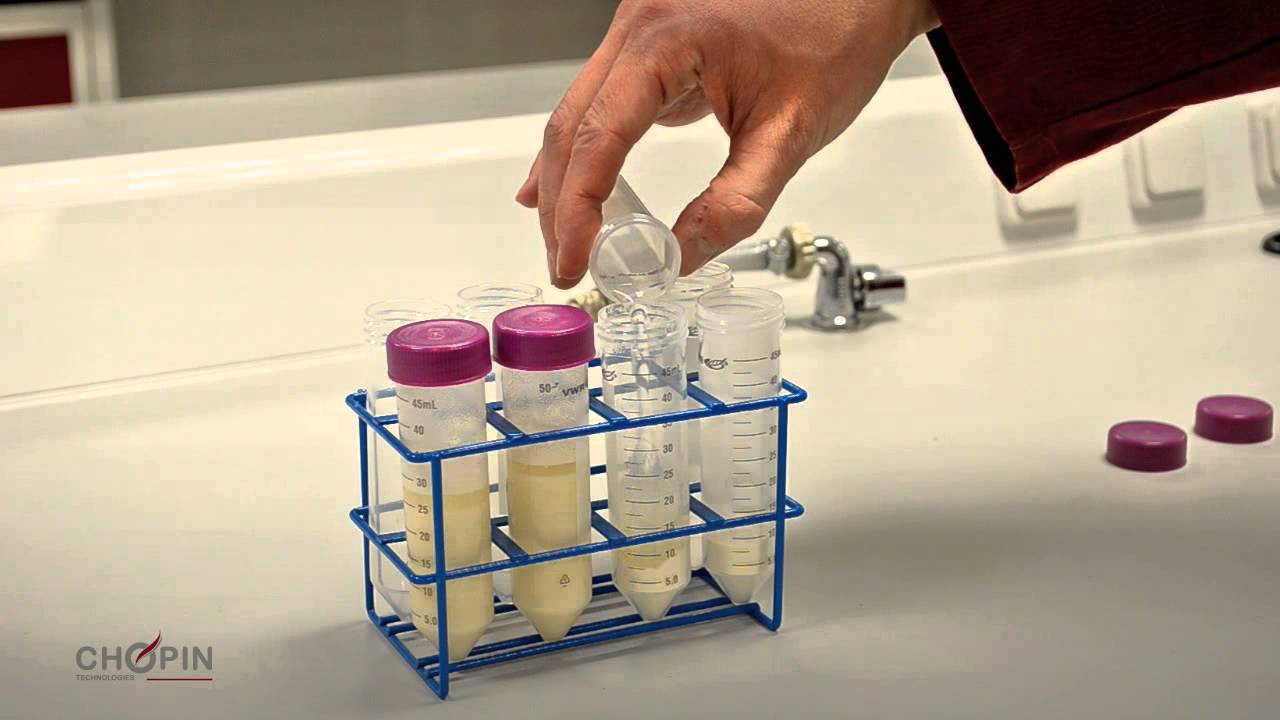
More specifically, SRC examines the glutenin, gliadin and pentosan characteristics of the flour, and the level of starch damage in the flour. These values describe the flour’s ability to absorb water during the mixing process and its ability to release that water during the baking process. The combined pattern of the four SRC values establishes a practical flour quality profile useful for predicting functionality and how flour products conform to specifications.
USW is showing millers how to use SRC to analyze flour streams to maximize quality while minimizing costs. For bakers, such testing ensures they are using the best possible flour for their products.
In 2020, USW asked cereal chemist Art Bettge to go into more depth on how millers and bakers can use and interpret SRC results to add value to their processes and products. A cereal chemist with more than 40 years of experience at the USDA Agricultural Research Service Western Wheat Quality Laboratory in Pullman, Wash., and in his ADB Wheat Consulting business, Bettge recorded an in-depth video presentation.
Watch Bettge’s entire presentation from the 2020 USW Crop Quality Seminars below. USW technical staff also shared their recommended Solvent Retention Capacity profiles for cookie and cracker products online. And most importantly, USW representatives in 13 offices around the world, are always ready to help our customers, through technical support and trade service, making buying U.S. wheat a rewarding experience.
Header Photo Copyright © Chopin Technologies.
For additional information, visit: https://www.uswheat.org/wp-content/uploads/2021-Solvent-Retention-Capacity-Recommendations.pdf.