thumbnail

A surprising drop in USDA’s estimate of U.S. wheat production in the September 30 Small Grains Summary Report helped support the trend of higher U.S. and world wheat prices. The recent sustained run-up in prices calls to mind another (and even more challenging) bull wheat market beginning in marketing year 2006/07 and continuing through 2007/08.

In March 2008, then U.S. Wheat Associates (USW) Senior Market Analyst Joe Sowers wrote in Wheat Letter that 2007/08 had been a remarkable year. He noted that “unforeseen weather calamities around the globe and major wheat exporters protecting supplies for domestic use” helped push stocks to their lowest level in 60 years and drove prices to record highs at the time. That supply shock followed a period in which wheat use outpaced production in 7 of the prior 10 years. Read Sowers’ article here.

Lower world wheat supplies and some key exporters still trying to hold down domestic food prices are also fueling the current market rally.

Today’s Supply Issues

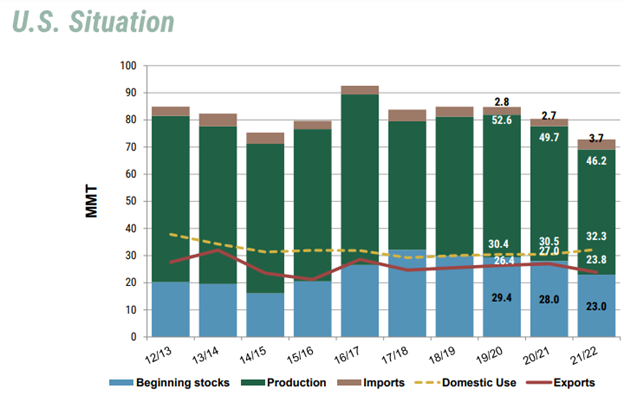
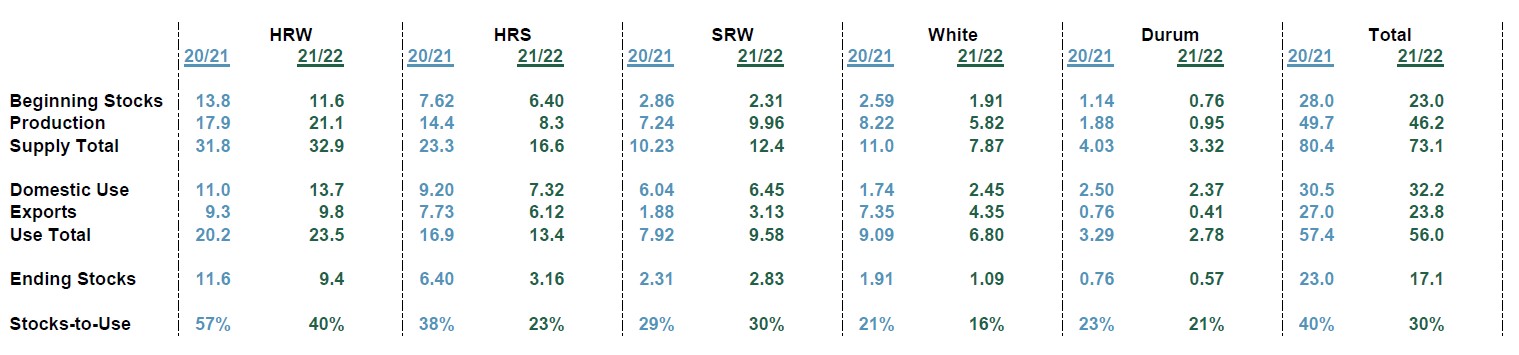
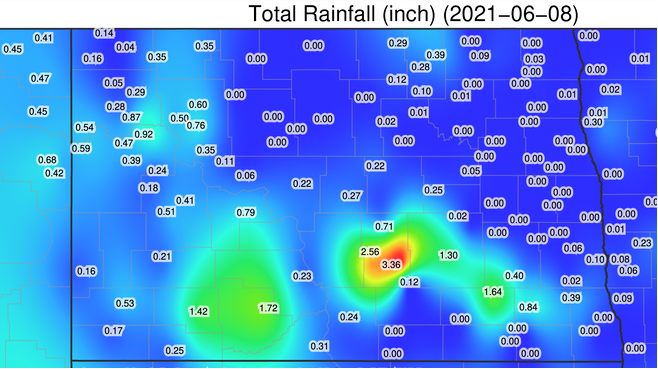
The challenges reducing worldwide wheat production and global stocks are well known at this point. The most recent Small Grains Report listed all wheat total production 10% below 2020 at 44.9 MMT (1.65 billion bushels). The report also fell short of average industry estimates and the NASS August projections. Despite a 5% increase in planted area in 2021 compared to 2020 and harvested area being up 1%, dry conditions ultimately trimmed total production. Winter wheat production was up 9% compared to 2020 while spring wheat bushels were down 44% compared to 2020, their lowest level since 1988. Durum wheat was down 46%.

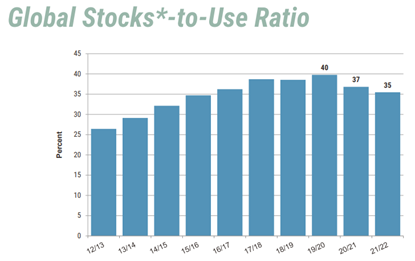
The latest USDA World Agricultural Supply and Demand Estimates (WASDE) report released October 12 also signaled lower production. USDA cut world wheat production by 4.4 MMT and trimmed ending stocks by 6 MMT. The report briefly sent U.S. wheat futures higher (followed on October 13 by managed money profit-taking). The report showed that for the second year in a row, ending stocks have declined following a long period of sustained annual growth. Compared to the highest ending stocks on record in 2019/20, ending stocks this year are down more than 17 MMT. USDA now projects 2021/22 world use to outpace production by 11.0 MMT — while global wheat demand continues to set new records.

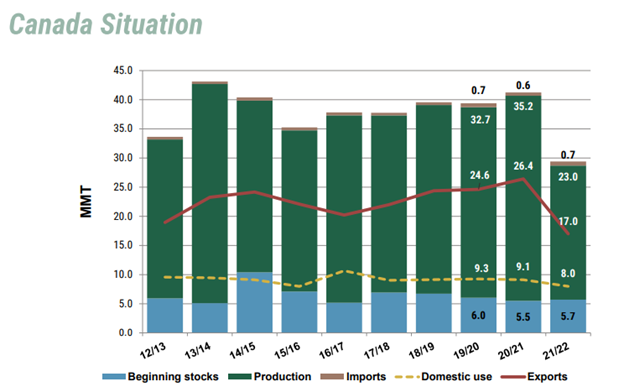
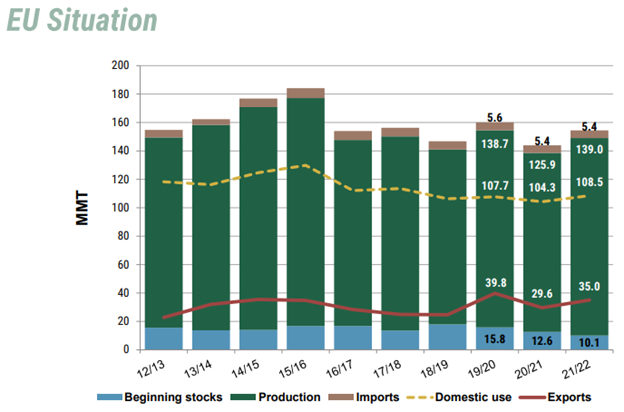
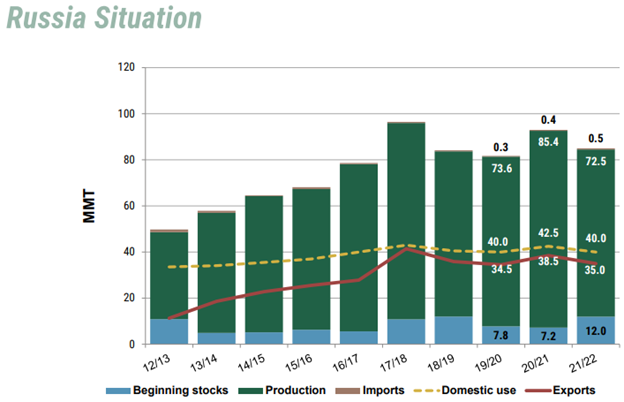
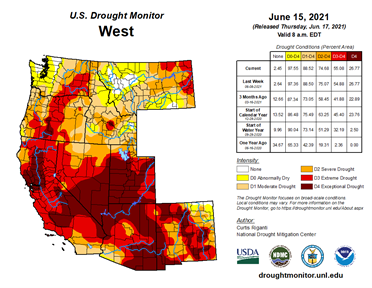
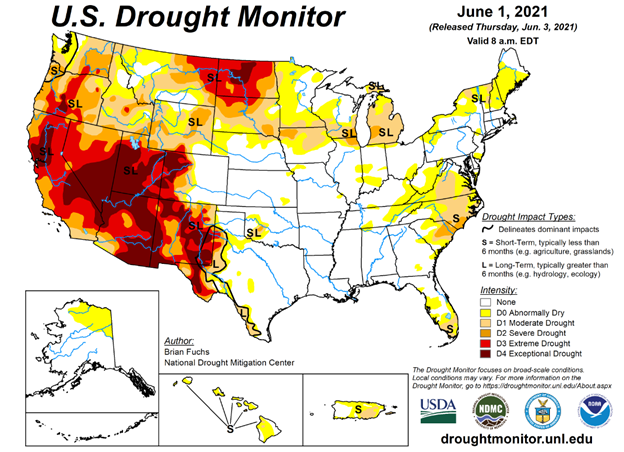
Drought conditions in Canada, the United States and Russia, along with quality issues in the European Union, have cut exportable wheat supplies.

Intervention Raises Import Cost

As it did in 2007/08, government intervention continues to hurt the world’s wheat importers. Russia’s export tax, which keeps going up, has helped increase global wheat prices. Russia’s agriculture ministry also laid out plans for an export quota beginning February 15 and lasting through the remainder of the 2021/22 season ending June 30, 2022. In Ukraine, which had better-growing conditions than neighboring Russia and is on an export pace well ahead of last year, the government and grain association are still at odds over what to do with surplus wheat. Kazakhstan was the first to announce plans to limit wheat exports but in early September the Kazak president called that idea “premature.”

Wheat futures prices 2006 to 2021

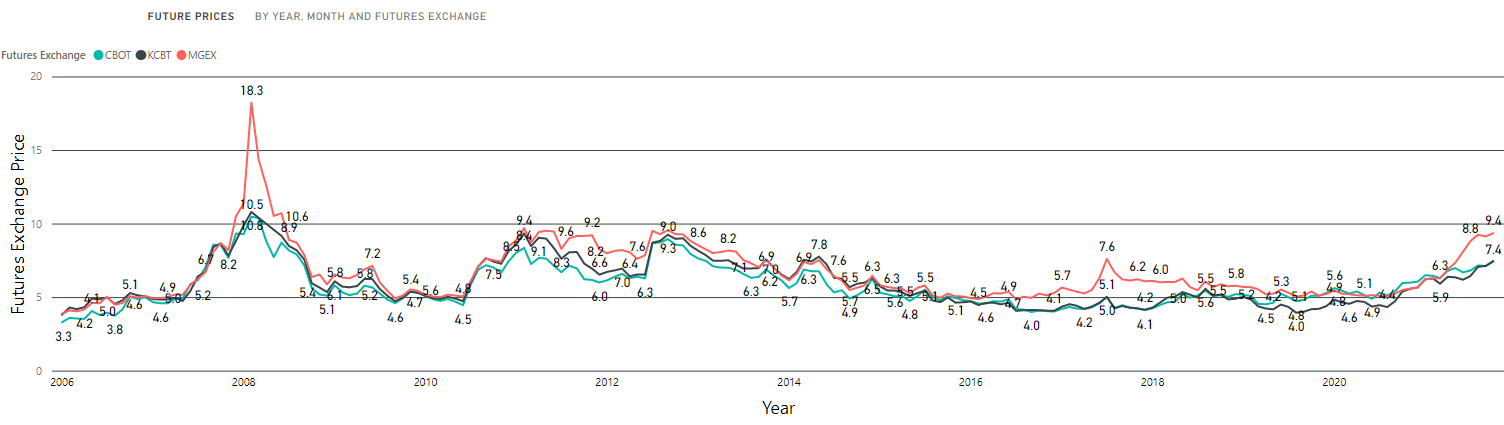
The bull wheat market from 2006 to 2008, seen here in U.S. wheat futures prices, was fueled by sharp drops in global wheat supplies from bad weather and intervention by some exporting countries’ governments. Supply and intervention also helped push prices up in late 2010. That pattern emerged again in 2020 as the market reacted to shorter supply and continued, trade-distorting government policies.

Differences and New Challenges

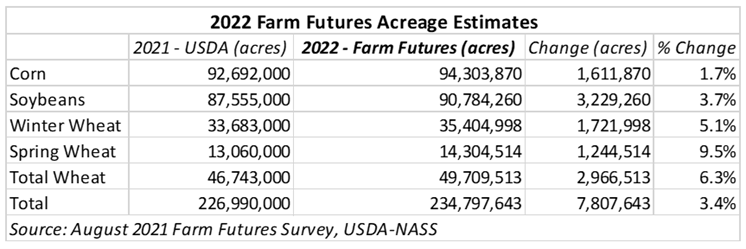
Will the current pressure on global wheat supplies continue? That remains to be seen. Higher prices do tend to stimulate an increase in planted area. Wheat varieties around the world are much improved from 13 years ago in their ability to perform better under production stresses. Farmers in every major exporting country are managing their crops better and in more sustainable ways.

New circumstances have added concerns for wheat importers. The ongoing challenges of the COVID-19 pandemic, including its contribution to dramatically rising freight costs with record recent gains in the Baltic Index, are unprecedented.

The critical consideration for wheat buyers and flour users today, as it was in 2007/08 when Joe Sowers wrote about that remarkable year, is whether they can rely on good weather to increase supplies and reduce world wheat prices for the rest of 2021/22 and into 2022/23.

By Michael Anderson, USW Market Analyst

thumbnail

The U.S. farm families who produce wheat and the entire U.S. supply chain remain committed to operating a transparent and open market. How export prices are discovered is one of the reasons why our overseas customers know they can depend on the integrity of our supply chain, the quality of U.S. wheat and our unmatched reliability as a supplier. U.S. wheat export prices are discovered openly through futures exchanges and the cost to move wheat to the loading equipment at export elevators, and prices are always available to customers. In addition, private exporters use risk management tools to honor sales contract prices often made months in advance of vessel loading. However, we recognize that navigating U.S. export markets and making purchasing decisions is a complicated, risk-involved process, especially when wheat customers have so many options for sourcing their supplies. For many years, U.S. Wheat Associates (USW) has helped wheat buyers navigate this process and discover export prices by publishing its weekly wheat price report on its website.

What is the USW Price Report?

The weekly U.S. wheat export prices as reported by USW each Friday after wheat futures markets close are compiled through research from numerous market sources, including U.S. wheat exporters of all classes from various U.S. ports. The prices reported the Free on Board (FOB) estimated value of number two grade and the proteins indicated. They are not intended to represent offers nor should U.S. wheat importers rely on them as such. Additional factors may alter these prices significantly* and USW recommends that buyers maintain regular contact with suppliers to receive offers representing their requirements.

In addition to estimated prices of U.S. wheat by class (not including durum nor hard white wheat), protein level, export region and delivery period, Price Report also includes weekly futures prices select ocean rates and currency exchange rates, charts that provide context and market highlights that help buyers understand the market more thoroughly.

How is the USW Price Report assembled?

The USW Market Analyst begins by surveying export wheat company representatives trading the U.S. wheat classes from the Gulf, Pacific Northwest (PNW) and Great Lakes. The traders provide the week’s current basis, which is the difference between cash price offered for a commodity at a specific location and a futures contract price for that commodity. The basis is then added to the Friday closing futures price from the exchange on which the wheat class is traded: hard red spring (HRS) on the Minneapolis Grains Exchange (MGEX); hard red winter (HRW) on the Kansas City Board of Trade (KCBT); and soft red winter (SRW) on the Chicago Board of Trade (CBOT). PNW soft white (SW) and Western White correspond to the CBOT futures price. Expressed as an equation: Export Basis + Futures Price = Cash Price (FOB).

How to Read the Price Report

Posted below is the front page of a past Price Report, which has been color-coded to display the information featured in the report. The delivery month is in chronological order and details forward pricing. Each month also includes wheat futures month codes as follows: H=March; K=May; N=July; U=September; Z=December. The futures month codes are combined with the calendar year to show the futures price reference and delivery month.

For example, in the column Nov (Z21), “Nov” represents November delivery and Z21 represents the November delivery price based on the December 2021 wheat futures contract. To calculate the estimated export price of wheat in November, the November export basis, quoted in cents, in red, is added to the FOB price in green. The total is the FOB price, in purple.

Color coded Price Report

More on Export Basis

Export basis can move up or down, affecting the export price of wheat, due to a variety of these factors. Some factors affecting export basis include transportation costs (trucking, barge, and rail rates), storage and elevation costs at export terminals, supply and customer demand, quality specifications, handling costs and profit margins, among other factors. Wheat export prices are also directly tied to movements in the futures market. In addition, export basis varies by exporting company, so USW Price Report basis prices represent an average of the shared quotes from traders.

Additional Resources in Each USW Price Report

Ocean Freight rates are included on the second page of each USW Price Report. Rates come from industry representatives each week and show many common vessel sizes and routes. A variety of charts are included in the USW Price Report to help customers visualize price trends. In addition, a Daily Futures Settlement Prices chart shows a week-on-week snapshot of the futures exchange.

USW Price Report Charts Page

Finally, on the last page of the Price Report, highlights that we have gleaned from several sources on potential market factors in the global wheat market help give meaning to price movements for the week. The futures highlight explains fundamental and technical factors affecting futures movement week-over-week. Export basis details the international and domestic conditions affecting basis movement by class and export region week-over-week. Highlights also include important information published by the USDA including crop progress and acreage, commercial U.S. export sales, U.S. Drought Monitor and foreign wheat marketing and production updates.

In the video below, a past USW Market Analyst shares a more detailed review of the USW Price Report, how it is assembled and how to understand and utilize the data.

An open, transparent pricing system is essential to a functioning global market and USW wants its customers to have as much information and tools available to them when making wheat purchasing decisions. Buyers should contact their suppliers to obtain prices based on their specific requirements and contract terms.

The weekly USW Price Report can be viewed here. Sign up to receive the report directly to your inbox every Friday by subscribing to the weekly USW Price Report email.

*These factors may include: (1) payment terms (differing from cash against documents which are the terms used in the U.S. Wheat Associates price report); (2) various quality factors, and method of quality certification; (3) loading terms (USW prices represent Free on Board and do not include loading rate guarantees, stevedoring costs or other elevator tariff charges); (4) different delivery periods than indicated in monthly prices reported by U. S. Wheat Associates.

By Michael Anderson, USW Market Analyst

thumbnail

On Tuesday, Sept. 14, 2021, U.S wheat futures gained as much as 2% after key wheat-producing nations lowered their production outlooks. With harvest nearly wrapped up in the Northern Hemisphere, the most recent USDA Supply & Demand (WASDE) report brought an updated look at key exporting countries and regions.

USDA currently expects 2021/22 world exportable wheat supplies will be about 221 MMT, down from an estimated 231 MMT in 2020/21.

United States

The 2021 harvest is virtually complete with only a few pockets of hard red spring (HRS) remaining to be harvested and about 10% of the durum crop still in the field. Except for soft red winter (SRW), all U.S. wheat classes saw lower production compared to 2020/21. Proteins were all higher than the 5-year average and growing regions that saw longer periods of hot, dry weather, including the Pacific Northwest (PNW) soft white (SW) region and the state of North Dakota, where the bulk of HRS and durum wheat is grown, saw protein averages reach as much as 1.8 points above the 5-year average.

USDA forecasts U.S. wheat production in 2020/21 will total 46.2 MMT, down 7% compared to 2020/21 following lower than average yields for SW, HRS and durum. Total U.S. wheat exports are expected to reach 23.8 MMT, which is down significantly from last year.

Click here to read more about the 2021 U.S. wheat harvest.

U.S. wheat supply and demand

Source: USDA, September 2021

Canada

After a record-setting 2020 wheat harvest, Canada’s total 2021 wheat crop is forecast to drop sharply. Stats Canada, in its latest report released this month, used satellite images and other data to estimate production. The Western Canadian spring wheat crop is expected to be 15.3 MMT, a 41% drop compared to last year, which would be the smallest spring wheat crop since 2007. Total wheat production is projected at 21.7 MMT, down 38% compared to 2020/21. The decline in production is blamed on hot, dry weather that persisted throughout the growing season.

Canadian wheat supply and demend

Source: USDA, September 2021

European Union (EU)

France’s farm ministry lowered its estimate for 2021 soft (non-durum) wheat by more than 600,000 MT this month following a wet summer. Despite the reduction, the ministry emphasized that the forecast was 24% higher than last year’s harvest and 8% higher than the 5-year average. Strategié Grains noted that wet weather towards the end of the growing cycle led to disappointing yields in France and Germany, while hot, dry weather early in the summer challenged the wheat crop in Poland and the Baltics. On the other hand, Romania and Bulgaria had record-setting yields this year. According to Romania’s agriculture minister, yields there were 5.34 MT/ha (79.4 bu/ac). Bulgarian wheat production was up 51% compared to last year reported AgriCensus. Despite the increased production, persistent rain caused concern about milling quality with decreased test weight and falling number reported.

EU wheat supply and demand

Source: USDA, September 2021

Russia

The latest USDA WASDE report put Russian wheat production at 72.5 MMT, 12.5 MMT less than the USDA’s original forecast of 85.0 MMT. Russia’s agriculture ministry reported 69.3 MMT of wheat harvested as of Sept. 9 on 23.7 million hectares (58.5 million acres), 12% less than the same time last year.

Russian wheat supply and demand

Source: USDA, September 2021

Ukraine

An autumn drought last year reduced Ukraine’s winter grains planted area, but officials said farmers plan to plant 10% more winter wheat this year. The agriculture ministry reported the wheat harvest complete with 32.8 MMT in the bin with a yield of 4.66 MT/ha (69.20 bu/ac). The current wheat harvest is a record for the Black Sea exporter, and yields are 22% higher than last year’s reported AgriCensus. In 2021, Ukraine’s grain exports could reach 80.6 MMT according to their agriculture ministry. The latest WASDE report forecasts Ukrainian wheat exports to be 23.5 MMT, up significantly from last year.

Australia

Australia’s Bureau of Agricultural and Resource Economics (ABARES) reported “exceptionally favorable” growing conditions for the second year in a row and adjusted its wheat forecast up 17% to 32.63 MMT. The latest WASDE report forecast Australian wheat production at 31.5 MMT, up 1.5 MMT compared to the August report.

Argentina

The Buenos Aires Grains Exchange (BAGE) reported 79% of all the wheat planted area had normal or excellent moisture levels. BAGE emphasized that Argentina’s wheat crop improved significantly following rainfall in the central and southern planted areas. The USDA left its production forecast unchanged from last month at 20.5 MMT.

By Michael Anderson, USW Market Analyst

thumbnail

An August 2021 survey of 737 farmers across the United States conducted in late July by Farm Progress Publications suggests that wheat, corn and soybean planted area will be up for 2022.

Jacqueline Holland, writing in www.farmprogress.com, said the surveyed farmers estimated they will plant a total of 46.7 million acres of wheat. Farm Progress also noted recently that, if realized, 46.7 million acres of wheat would exceed “the smallest wheat acreage in history in 2020…by an astounding 5.4 million acres.”

USDA’s National Agricultural Statistics Service (NASS) will release it’s annual Small Grains Summary report including wheat acreage, area planted and harvested, yield and production on Sept. 30, 2021.

Even with a potentially large 2022 U.S. wheat crop, the Farm Progress survey showed why wheat stocks could actually decline slightly through the next marketing year. The publication said it estimates 2022/23 U.S. wheat usage at just under 58 million metric tons (2.13 billion bushels) in part because of “higher export targets.” That would be the highest usage rate since 2016/17 and “consume all new production that comes online” in 2022 and, if realized, create the lowest stock-to-use percentage since 2013/14.

The image shows a table giving estimated acres farmers expect to plant as of August 2021.

The planted area estimate of 94.3 million acres of corn and 87.6 million acres of soybeans from the survey would mean the combined total planted area with wheat would be the third largest combined acreage on record.

Where Will Those Acres Come From?

Ms. Holland suggested that farmers in the Plains have some flexibility to change their crop rotations compared to farmers in the Eastern U.S. Corn Belt. She added that cattle herd numbers are down which could allow a shift from forage crops. And double-cropping wheat after soybeans remains a profitable choice.

The writer goes on to describe reasons why these rather bullish estimates may be tempered. For wheat, as for corn and soybeans, the estimates from the survey assume optimal weather conditions. Too many U.S. wheat farmers know optimal conditions are rare. In fact, the threat of continued drought through the winter wheat planting season will have an impact on seeded area for 2022.

China’s Influence

The author also noted that China will continue its outsized influence on global wheat, corn and soy supply and demand. Export demand levels could grow if China’s livestock feed demand grows and that will affect U.S. grain production profitability.

“Global livestock rations will likely waver between wheat and corn depending on market prices,” Ms. Holland wrote. “Any potential usage shifts could have significant impacts on pricing and acreage allocations in the 2022/23 marketing year.”

The rising cost of production inputs may also come into play as U.S. farmers make their cropping plans and weigh heavier on decisions should crop prices start to fall back.

Wheat Will Compete

Ms. Holland’s final point about the survey estimates is important for the world’s wheat buyers.

“…With winter wheat sowings just around the corner and wheat futures trading at lucrative prices,” she wrote, “expect wheat to be a strong competitor against corn and soybean in the 2022 acreage battle.

By Michael Anderson, USW Market Analyst

thumbnail

USDA’s August 2021 World Supply & Demand Estimates (WASDE) report trimmed expected global wheat production, reduced the global wheat stocks-to-use ratio and created a supply shock market rally. USDA dropped total production to 777 million metric tons (MMT), 15.4 MMT less than its July forecast, citing major weather problems in Russia, Canada and the United States. Global wheat use forecast for 2021/22 is 787 MMT.

Wheat supply is of course a major variable in global price discovery and is related to the “stocks-to-use” ratio, representing the level of carryover stocks as a percentage of the total demand or use. These new USDA estimates reduced the global stocks-to-use forecast to 35%, which, if realized will be its lowest since 2016/17. If China’s massive wheat stocks are removed from the calculation (China exports very little wheat), the stocks-to-use estimate is 21.6%.

A chart showing global wheat stocks-to-use ratios for last 10 years.

Global wheat stocks-to-use percentage has declined after an eight-year run-up. Source: USDA August 2021 WASDE and USW Supply and Demand Report.

Guy Allen, Senior Economist at IGP Institute at Kansas State University, points out that an important consideration when looking at the wheat stocks-to-use ratio is to compare the ratio to corn as well. While wheat is primarily a food grain, it can compete with feed grains given relative prices or regional shortages. The current global stocks-to-use ratio forecast for corn is 24%, also lower than its ratio the past few years.

Supply Shock Source

How did the world get to this point? Global use continues to set records each year and ending stocks declined in 2020/21 and again this marketing year. It is major exporting countries taking the supply hit this year. In fact, Stratégie Grains, a French grains analyst, said that the stocks-to-use ratio for major exporting countries could fall to its second-lowest level on record after 2012/13.

USDA slashed Russia’s production forecast 12.5 MMT to 72.5 MMT. The Russian statistical agency, Rosstat, reduced the number of winter wheat acres harvested while the Ministry of Agriculture reported lower yields. In Canada, the Prairie Provinces saw production decline after persistent drought slashed yields by 24% compared to the 5-year average. USDA reduced its Canadian production forecast by 32% compared to 2020/21 to 24.0 MMT. If realized, it will be the smallest Canadian wheat crop since 2010/11.

U.S. Wheat Balance Sheet

USDA also lowered U.S. production 7% compared to last year as drought has affected several wheat-growing areas including the Northern Plains states and the Pacific Northwest (PNW). The total stocks-to-use ratio in the U.S. is forecast at 30% for 2021/22, down 10% from 2020/21’s total stocks-to-use ratio of 40%. This is not surprising considering that all wheat classes started with lower beginning stocks in 2021/22 and of the five wheat classes tracked by the USDA in its monthly report all wheat classes except for hard red winter (HRW) and soft red winter (SRW) are expected to have lower ending stocks. Even with the higher production in HRW and SRW, the stocks-to-use ratio is forecast lower for all wheat classes in 2021/22. U.S. white wheat, primarily soft white grown in the Pacific Northwest (PNW) is the most affected with 16% stocks-to-use compared to 21% last year.

U.S. wheat stocks-to-use data for August 2021

USDA now expects the 2021/22 stocks-to-use ratio for each major U.S. wheat class to decline. Source: USDA August 2021 WASDE and USW Supply and Demand Report.

With harvest well underway for many classes (HRS, S.W.) and complete for HRW and SRW the market is getting a better indication of how accurate the USDA’s production number is. The September WASDE report will account for more known production in the United States and other major exporting countries. USDA will also publish its quarterly Grain Stocks report at the end of September that will also add to our understanding of how much wheat is available.

By USW Market Analyst Michael Anderson

thumbnail

The effects of weather on the 2021/22 global wheat crop have sparked a run-up in prices even as harvest progresses in the Northern Hemisphere. Given the market’s supply concerns, U.S. Wheat Associates (USW) gathered information from major wheat exporting countries to see what may affect USDA’s next estimates of world supply and demand due on Aug. 12.

Both USDA and the International Grain Council (IGC) still expect 2021/22 global wheat crop production to reach a record level. USDA’s July estimate of 792.4 million metric tons (MMT) was down 2.0 MMT from June. IGC trimmed its latest forecasts by about 1.0 MMT to 788 MMT.

Hot, dry weather in the northern and Pacific Northwest (PNW) regions of the United States and, recently, in Canada, has attracted much of the market’s attention.

United States

The Wheat Quality Council Hard Spring and Durum Tour estimated this year’s hard red spring (HRS/DNS) yield average at 29.1 bushels per acre, compared to 43.1 bushels per acre in 2019. Even so, the tour’s consensus is HRW/DNS protein and kernel size will be very good. U.S. northern durum and soft white (SW) wheat yields are also expected to be down significantly. On the other hand, hard red winter (HRW) and soft red winter (SRW) average yields and production are expected to be higher for 2021/22. In addition, Kansas-based HRW grower Brian Linin, noted, “We put a lot into this crop. Protein [levels] have been awesome.” Follow USW’s weekly Harvest Report for more information.

HRS wheat rows showing effect of drought in North Dakota

Drought in the Northern U.S. Plains could cut the 2021/22 HRS/DNS yield average by one-third, but industry experts expect protein and kernel quality will be good.

Canada

Canada, the largest spring wheat producer, has experienced record temperature and drought in portions of its Prairie Provinces. Agriculture and Agri-Food Canada (AAFC) cut its most recent forecast of spring wheat production by 11% to 25.6 MMT, down sharply from previous estimates. That agency also reduced spring wheat export forecasts to 17.7 MMT, down 16% from last year.

South America

In Argentina, dry weather is also a concern, depleting soil moisture for the winter wheat crop and creating a logistics headache. The Buenos Aires Grains Exchange (BAGE) reported potential leaf damage and developmental delays caused by a severe cold front in July. Neighboring Brazil and Paraguay have also experienced potentially damaging cold weather. Brazil experienced some of the lowest temperatures in years throughout July. One local newspaper in Paraguay, “La Nación,” reported there may be a need to import wheat this year instead of marketing excess domestic production.

EU

The European Union’s top wheat-producing states, France and Germany, received persistent rain leading to flooding in some areas, which slowed harvest and created quality concerns. On Aug. 3, France’s farm ministry lowered the estimate for wheat production there by 410 thousand metric tons (TMT), but total production is still expected to be at least 25% more than in 2020/21. In a report following the flooding, a German farmers group suggested there may be crop failures in many areas. Despite this, total German production is expected to be 23.1 MMT, up almost 5% compared to last year. Further east, Romania and Bulgaria each expect to harvest record crops, although official reports said rains could downgrade a portion of Bulgaria’s harvest to feed.

Black Sea

USDA’s May Russian wheat production forecast of 85.0 MMT was seen as bullish by many at the time. Two private Russia-based analysts cited lower-than-expected yields in the Central and Volga regions when they cut their production estimates recently. IKAR cut its forecast for the 2021 wheat crop by 3.0 MT to 78.5 MMT and SovEcon cut its forecast 6.6% to 76.8 MMT. Rosstat, the Russian state statistics agency, reduced winter wheat planted area by 7.5% compared to last year, blaming dry weather. Export prices, as a result, increased at least $7 per MT following the news. The current Russian government export tax scheme is also adding part of that increased export cost.

Ukraine’s wheat harvest lags last year’s pace but yields are up 12% compared to 2020. In reaction to reduced wheat production in Russia, prices for Ukrainian wheat gained $3 to $5 per MT settling between $240 to $243 per MT. The USDA estimates Ukraine’s wheat production to rise 15% this year to 30.0 MMT.

According to one Ukrainian-based broker, farmers in Kazakhstan are expecting a 30% drop in wheat production this year from hot, dry weather in the early summer. The Kazak government is considering banning feed wheat exports while also considering a tax on milling wheat exports following a meeting of the foreign affairs and trade commission last month.

Australia

Wheat growing areas of Australia, especially Western Australia, are “looking extremely good” said one analyst with the Australian Export Grain Innovation Centre. Production estimates are expected to fall 17% compared to 2020/21 when Australia produced a record crop. This year’s crop is expected to be 15% above the 10-year average to 28.5 MMT following a 1% increase to the planted area. Some areas are reporting water logging and would benefit from a couple of weeks of sunny dry weather to dry out the fields.

screenshot from Australian Export Grain Innovation Centre

The Australian Export Grain Innovation Centre reports a second year of good wheat production potential after breaking a severe drought in 2020.

In-Born Optimism

Back in the drought areas of the United States, many wheat farmers are looking ahead to the next crop with winter wheat seeding likely to start in some areas by early September. In an interview with the Pacific Northwest Ag Network, Casey Chumrau, Executive Director of the Idaho Wheat Commission, described the farming community’s outlook this way: “The overall sentiment is not great, but they are farmers, so they are thinking next year is going to be better.”

By Michael Anderson, USW Market Analyst

thumbnail

On the heels of a White House Executive Order on competition this month, a large group of agricultural shippers recently wrote to the U.S. Surface Transportation Board (STB) to advocate for several policy proposals in front of the board that can make a significant difference in increasing rail competition in transportation of wheat and other commodities.

The letter was written by a diverse grouping of agricultural organizations, including U.S. Wheat Associates (USW), that created an informal coalition, the Agricultural Transportation Working Group (ATWG), in 2003. The group meets regularly to discuss critical transportation policy issues that affect U.S. agriculture. The group also identifies policy priorities and suggests needed changes to help maintain U.S agriculture’s international competitiveness.

Elevator and train to illustrate rail competition story.

About 70% of U.S. wheat is transported by train from inland country elevators to domestic and export markets, so rail competition is important for the entire supply chain.

More Room for Negotiation Needed

With about 70% of U.S. wheat moving to domestic and export markets by rail, railroads provide an essential logistical function that neither farmers nor grain companies can perform on their own. Yet those shippers are often “captive” because they lack economic alternatives to a single railroad.

The letter specifically encouraged STB to enable “competitive switching” (see below for more information) and urged “the Board to finalize other regulations … to provide rail customers greater ability to negotiate prices and challenge unreasonable rates and fees.” The letter points out that “fees are increasingly becoming a larger source of revenue for railroads and expense for their customers.” Click here to read more about how rail rates affect U.S. wheat export basis.

The President’s Executive Order was particularly broad and focused on proposals to increase competition in many industries, with the transportation portion including rail competition and maritime initiatives,  stating that “robust competition is critical to preserving America’s role as the world’s leading economy … inaction has contributed to these problems, with workers, farmers, small businesses, and consumers paying the price.”


“Competition is critical to the health of the rail industry and the significant role rail serves in the larger economy, and this Executive Order will help focus attention on these important issues.” – Surface Transportation Board Chairman Martin J. Oberman


The Order explicitly states that agencies like the STB and Federal Maritime Commission (FMC) can influence the conditions of competition through their exercise of regulatory authority. In addition to the competitive switching rule, the STB has the latitude to propose or finalize other options such as bottleneck rate rules and Final Offer Rate Review – for which USW has advocated – both of which would start to tip the scales in favor of a level playing field for rail shippers.

Opposition Anticipated

While the rail industry will almost certainly oppose any changes to the current regulatory model that affects rail competition, executive pressure and political initiative may encourage the STB majority to act on these proposals (click here to read STB Chairman Martin J. Oberman’s statement on the President’s Executive Order). Many industry watchers are even speculating that the focus on increasing competition and attention on consolidation will factor into the STB’s consideration of the proposed Canadian National Railways purchase of Kansas City Southern Railroad – something the USW Wheat Transportation Working Group is closely watching.

In USW’s mission “to enhance wheat’s profitability for U.S. wheat producers and its value for their customers,” a potential solution may be found in the President’s directive if it indeed does rebalance the relationship between railroads and their customers.

By Michael Anderson, USW Market Analyst


“Competitive switching” is a policy proposal in which a rail customer such as an inland country grain elevator could seek bids for service from nearby competing railroads even if the customer is not located directly on the competing railroad’s track. It is designed to inject competition into what is otherwise a captive transportation market, where many rail customers, especially grain elevators, have direct access to only a single freight railroad, leaving them with little to no bargaining power over shipping rates. Freight rail reform advocates who have sought such policies for a long time are enthusiastically looking to the President’s “Promoting Competition in the American Economy” executive order to add momentum to the call for greater competition.

thumbnail

Hot, dry weather following a parched fall and a winter with less snow in some areas has many parts of Washington, Oregon and Idaho experiencing some of the driest weather in a generation. Much of the area that grows spring and winter soft white (SW) and white club wheat is experiencing some form of drought. All eyes will be on USDA’s first estimate of new crop SW production in its July World Agricultural Supply and Demand Estimates report, although a reduction in yield potential and concerns about protein levels are already anticipated.

The market has reacted to the weather with FOB prices for ordinary SW up $140.00 per metric ton ($4.00 per bushel) more than a year ago. Demand for the 2020/21 SW crop was quite strong and ending stocks of 1.31 million metric tons are half of what they were in 2019/20. The stocks-to-use ratio for SW ended the year at only 13%.

Now, the hot dry weather leaves farmers unwilling to forward contract new crop sales as they struggle to identify what volume they will produce and because dry conditions tend to increase protein, what protein levels they will be able to offer. Traders are cautious because the drought’s effect on protein levels could make securing lower protein SW difficult. It is important to remember that SW protein levels have been elevated in some past years. Your local U.S. Wheat Associates (USW) office is an excellent resource to help you identify how to get the most value from every new crop.

Showing the U.S. Drought Monitor for the Western states.

Extreme drought is intensifying in the Pacific Northwest and throughout the western United States.

Michelle Hennings, Executive Director of the Washington Association of Wheat Growers, recently noted that while winter planted SW is stressed with lower yield potential, spring planted SW has had so little moisture some farmers may not have any harvest.

Washington state, which accounts for around 50% of the Pacific Northwest (PNW) SW crop, has received only half of its usual average rainfall according to NOAA’s National Centers for Environmental Information and areas falling into the drought category makeup well over half the state. Areas rated in extreme drought are increasing fast week-over-week and winter wheat conditions in Washington are rated 15% good to excellent.

Karin Bumbaco, Assistant State Climatologist, University of Washington, recently noted that the drought in the state has expanded quickly. Just three months ago none of Washington was in extreme drought versus today when more than 23% of the state – and almost all the state’s wheat country – falls into the category (see the PNW SW wheat production area above from the interactive U.S. wheat export supply system map on www.uswheat.org).

Driest in More than 40 Years

The once-in-a-generation drought led one farmer to observe “if you can get an average crop, consider yourself lucky!”

Darren Padget, a dryland wheat farmer in north-central Oregon and the current USW Chairman, noted that harvest may come early this year. The lack of rain has matured his crop enough that harvest, which usually comes at the end of July, may start in less than a month. Padget also mentioned that it is the driest weather he has seen since 1977, a year many farmers remember when looking for a comparison to this year. In Oregon, which accounts for around 20% of the PNW SW crop, winter wheat conditions are rated 11% good to excellent.

Some Good to Excellent Wheat

Idaho, which accounts for around 30% of the PNW SW crop, has also been very dry. Similar to neighboring states, spring planted SW in Idaho is severely stressed, especially on non-irrigated fields. However, some wheat in Idaho is grown under irrigation and farmers there are more optimistic about the condition of fall planted SW fields. In fact, USDA’s latest report puts 44% of SW winter wheat in good to excellent condition.

Despite the challenges to the 2021/22 PNW SW crop, many farmers do have crop insurance and the state governments are also considering other ways to help farmers through this challenge, and USW is there for overseas buyers who have questions and concerns.

Producers, by nature, remain optimistic. One producer in Washington state put it best: “…we are not going to give up.”

By Michael Anderson, USW Market Analyst

thumbnail

By Michael Anderson, USW Market Analyst

Hard red spring (HRS) futures rose $0.85 week-over-week to close at $8.10 per bushel on Friday, June 4, a level nearly $3.00 more per bushel than they were a year ago. Some recent rain in western Canada took some pressure off HRS prices, but severe drought in North Dakota, the top producing HRS state, remains the crucial market factor. AgriCensus on June 8 said the USDA is likely to slash its spring wheat forecast in its June 10 WASDE report, following the prolonged period of drought.

Daily Futures Settlement Prices 28052021 to 04062021

An unusually dry winter with very little snow cover meant that soil moisture was far below average for the state when spring wheat planting started. Dryness persisted through planting, and following very cool conditions, the HRS production region had been in one of the hottest and driest periods in over 30 years. The dry soil makes it hard for rain to absorb into the hard ground when it has come in localized areas, leading to water runoff. The unusual heat causes the moisture to evaporate quickly.

More Concerned

Erica Olson, Market Development and Research Manager for the North Dakota Wheat Commission (NDWC), remains optimistic but said the HRS and durum crops are definitely stressed. She said rain is needed now, and consistent rain needs to follow. In 2017, North Dakota experienced another dry growing season leading to lower yields and some abandonment. A key difference this year is the lack of soil moisture growers started with. Farmers tell her they are growing more concerned by the day.

Olson noted that they would see more abandonment and a smaller crop with below-average yields if things do not turn around.


Farmer anxiety over this year’s crop potential means that grain traders are having difficulty securing offers from growers. Unsure of their yield potential, many farmers are unwilling to commit to much forward sales, and if they have stored wheat to sell, they may expect prices to go higher. A U.S. wheat trader said rain is needed now and compared this year to 1988 when a severe drought cut spring wheat yields in half. The USDA’s initial crop condition rating for spring wheat is the “second-lowest first crop rating ever next to the disastrous year of 1988,” noted one wheat analyst.

“The word of the year will be ‘timely’ rains,” said NDWC Policy and Marketing Director Jim Peterson in an interview with DTN. That article pointed to many factors affecting the current wheat conditions in the Northern Plains. While dryness is expected to continue in the near term, conditions can change quickly.

Speaking of things changing quickly, after this story was written and scheduled to publish June 9, south-central North Dakota received some respite with isolated rain showers overnight on June 8. More rain is expected this week; however, it may not be enough or soon enough to turn conditions around.

Source: North Dakota Agricultural Weather Network

Canada

Farmers in the Canadian Prairie Provinces are also experiencing unseasonably hot weather but recently received what was dubbed the “billion-dollar rainfall” for their spring wheat crops.

USDA reported that drier conditions returned to Manitoba, but beneficial showers continued elsewhere, further improving emerging spring grains and oilseeds prospects. Most agricultural districts in Manitoba received less than 5 mm, with near-complete dryness in Canada’s Red River Valley.

thumbnail

By Michael Anderson, USW Market Analyst

The first predictions for global wheat supplies and demand in the new U.S. marketing year (June 1, 2021, to May 31, 2022) are in. Most estimates call for relatively stable world supplies in 2021/22. Only time will tell the real story, but U.S. Wheat Associates (USW) will be watching several market factors closely over the next few months.

USDA published its initial supply and demand forecast for the new 2021/22 U.S. marketing year this month. According to the May World Agricultural Supply and Demand Estimates (WASDE), estimated world beginning stocks will be 295 million metric tons (MMT), down 2% from 2020/21, with ending stocks also projected at 295 MMT. While global wheat production is expected to reach a record 789 MMT, global consumption is also forecast at a record 789 MMT.

U.S. Stocks Decline

In the United States, except for soft red winter (SRW) wheat, the stocks-to-use ratio for the other wheat classes all declined in 2020/21. For example, soft white (SW) wheat stocks-to-use ratio went from 35% in 2019/20 to 15% in 2020/21.

Along with USW, buyers of soft white (SW) and hard red spring (HRS) wheat will want to monitor the weather across the PNW and Northern Plains, where conditions have been very dry for growing winter crops and newly seeded spring crops. Recent rain has been helpful but spotty. Timely rains will be needed to avoid a fall-off in production for those wheat classes and northern durum.

Late rain in the primary hard red winter (HRW) states has helped the new crop, but it is too soon to know if that precipitation came too late for wheat in sections of Colorado, Kansas and Oklahoma. USW’s Harvest Report is a helpful way to track crop conditions.

Supplies in Other Exporting Countries

Beginning stocks for the five major historic exporters, the United States, Canada, Australia, Argentina, and the European Union (EU), are forecast to be 45 MMT, down from 50 MMT in 2020/21. Ending stocks for 2021/22 U.S. marketing year are forecast to be 42 MMT, a decline of 3 MMT compared to 2020/21.

Ending stocks for the United States, Canada, Australia, Argentina, and the EU reached their highest on record in 2017/18 with 60.0 MMT of global ending stocks. Since then, stocks have fallen. If realized, USDA now expects 2021/22 ending stocks for those five major exporters will be the lowest since 2007/08 at 42 MMT, down 19% from the 10-year average. However, beginning stocks for 2021/22 for Black Sea exporters Russia, Ukraine and Kazakhstan are forecast at 15 MMT, up 67% from 2020/21. The ending stocks forecast for the Black Sea exporters was also raised compared to 2020/21 and double 2019/20 to 18 MMT.

Canada is experiencing dry weather in its key growing regions, adding to anxiety there, beginning stocks and production are all projected down.

Australia is poised for a second consecutive bumper wheat crop. Near perfect conditions ahead of planting season in April and May and favorable crop weather forecasts from the Australian weather bureau have traders there confident. One broker called for a 29.5 MMT crop compared to the WASDE forecast of 27 MMT.

The Rosario Grain Exchange (BCR), an Argentine association, projects a record 20.0 MMT crop for the lead South American wheat producer following a 3% increase in planted area.

Coceral, an EU-based association representing the cereals trade, revised its EU wheat output upward by 4.3 MMT after “excellent yield prospects in the Balkan countries and Spain.” Germany also increased winter wheat sown area by 3%. The European Commission increased its forecast for common wheat production to 126.2 MMT, 6% less than the most recent WASDE report forecast for 2021/22.

Russia Weighs In

It will be interesting to see how USDA adjusts its forecast for Russian wheat production in 2021/22 in its June WASDE report. The May WASDE forecasted 2021/22 production in Russia, the leading world wheat exporter, at 85 MMT, down slightly from the record 2020/21 crop. However, a separate report from the USDA Foreign Agriculture Service Attaché based in Moscow forecast Russian wheat production at a much lower volume. SovEcon, a Russia-based analyst, forecast in May that the Russian wheat crop will be 81.7 MMT.

China Demands Attention

Monitoring China’s actions in global grain trade will be important over the next few months.

Record corn imports have slashed world corn stocks. China has purchased 11.38 MMT of U.S. corn in the current marketing year, and an additional 11.98 MMT is still awaiting shipment. China purchased $400 million of U.S. corn in May 2021 alone.

The effect of China’s unprecedented corn demand on the wheat market should draw any wheat buyer’s attention. China’s unusually large wheat imports beginning in early 2020 through most of 2020/21, including 3.2 MMT of U.S. wheat, helped pull up global wheat prices. Then, as China’s government buyers ramped up corn imports, the price relationship between corn and wheat narrowed and even reversed at times.

Market watchers know that USDA expects wheat feeding in China to reach 40 MMT in 2021/22 but also expects its notoriously large volume of wheat stocks to decline by only 3.0 MMT. And China, notoriously, holds half the world’s wheat stocks, but USDA’s forecast expects ending stocks to be 3.0 MMT less than 2020/21.

IGC Expects Higher Prices

In its May Grain Market Report, the International Grains Council (IGC) noted that despite an increase in wheat production, a rise in consumption and tightened ending stocks in 2020/21 will lead to a drawdown in global grain stocks for 2021/22. The IGC said that ending stocks will be at a seven-year low.

As the 2021 U.S. wheat harvest moves north, USW colleagues, our state wheat commission members and farmers across the country will continue monitoring the critical market factors that affect our overseas customers.