• Facebook
  • Twitter
  • Vimeo
  • LinkedIn
  • SUBSCRIBE
  • MEMBER LOGIN
U.S. Wheat Associates
  • Our Story
    • About USW
    • Dependable People. Reliable Wheat.
    • Board of Directors
    • Staff Directory
    • Office Locations
  • Market Information
    • Market Information
    • Price Reports
    • Price Charting Tools
    • Supply and Demand
    • Commercial Sales
  • Crop Quality
    • Crop Quality
    • Harvest Reports
    • Hard Red Winter
    • Hard Red Spring
    • Hard White
    • Soft White
    • Soft Red Winter
    • Durum
  • Working With Buyers
    • Working With Buyers
    • Customer Conferences
    • Wheat Classes
    • Wheat Glossary
    • Wheat Grade Factors
    • How to Buy
    • Ask the Expert
    • Resources
  • Who We Represent
    • Who We Represent
    • Board Meetings
    • State Wheat Commissions
    • Partners
    • Trade Activities
  • Policy
    • Policy
    • Trade Negotiations
    • Trade Barriers
    • Innovation and Sustainability
    • Food Security and Assistance
    • Public–Private Partnership
  • News
    • Newsroom
    • Wheat Letter Blog
    • News Releases
    • Videos
  • Search
  • Menu Menu
You are here: Wheat Letter Blog 1
Hard Red Winter, Market and Crop Analysis, Wheat Quality

Good Functional Characteristics, Lower Average Protein Mark New HRW Crop

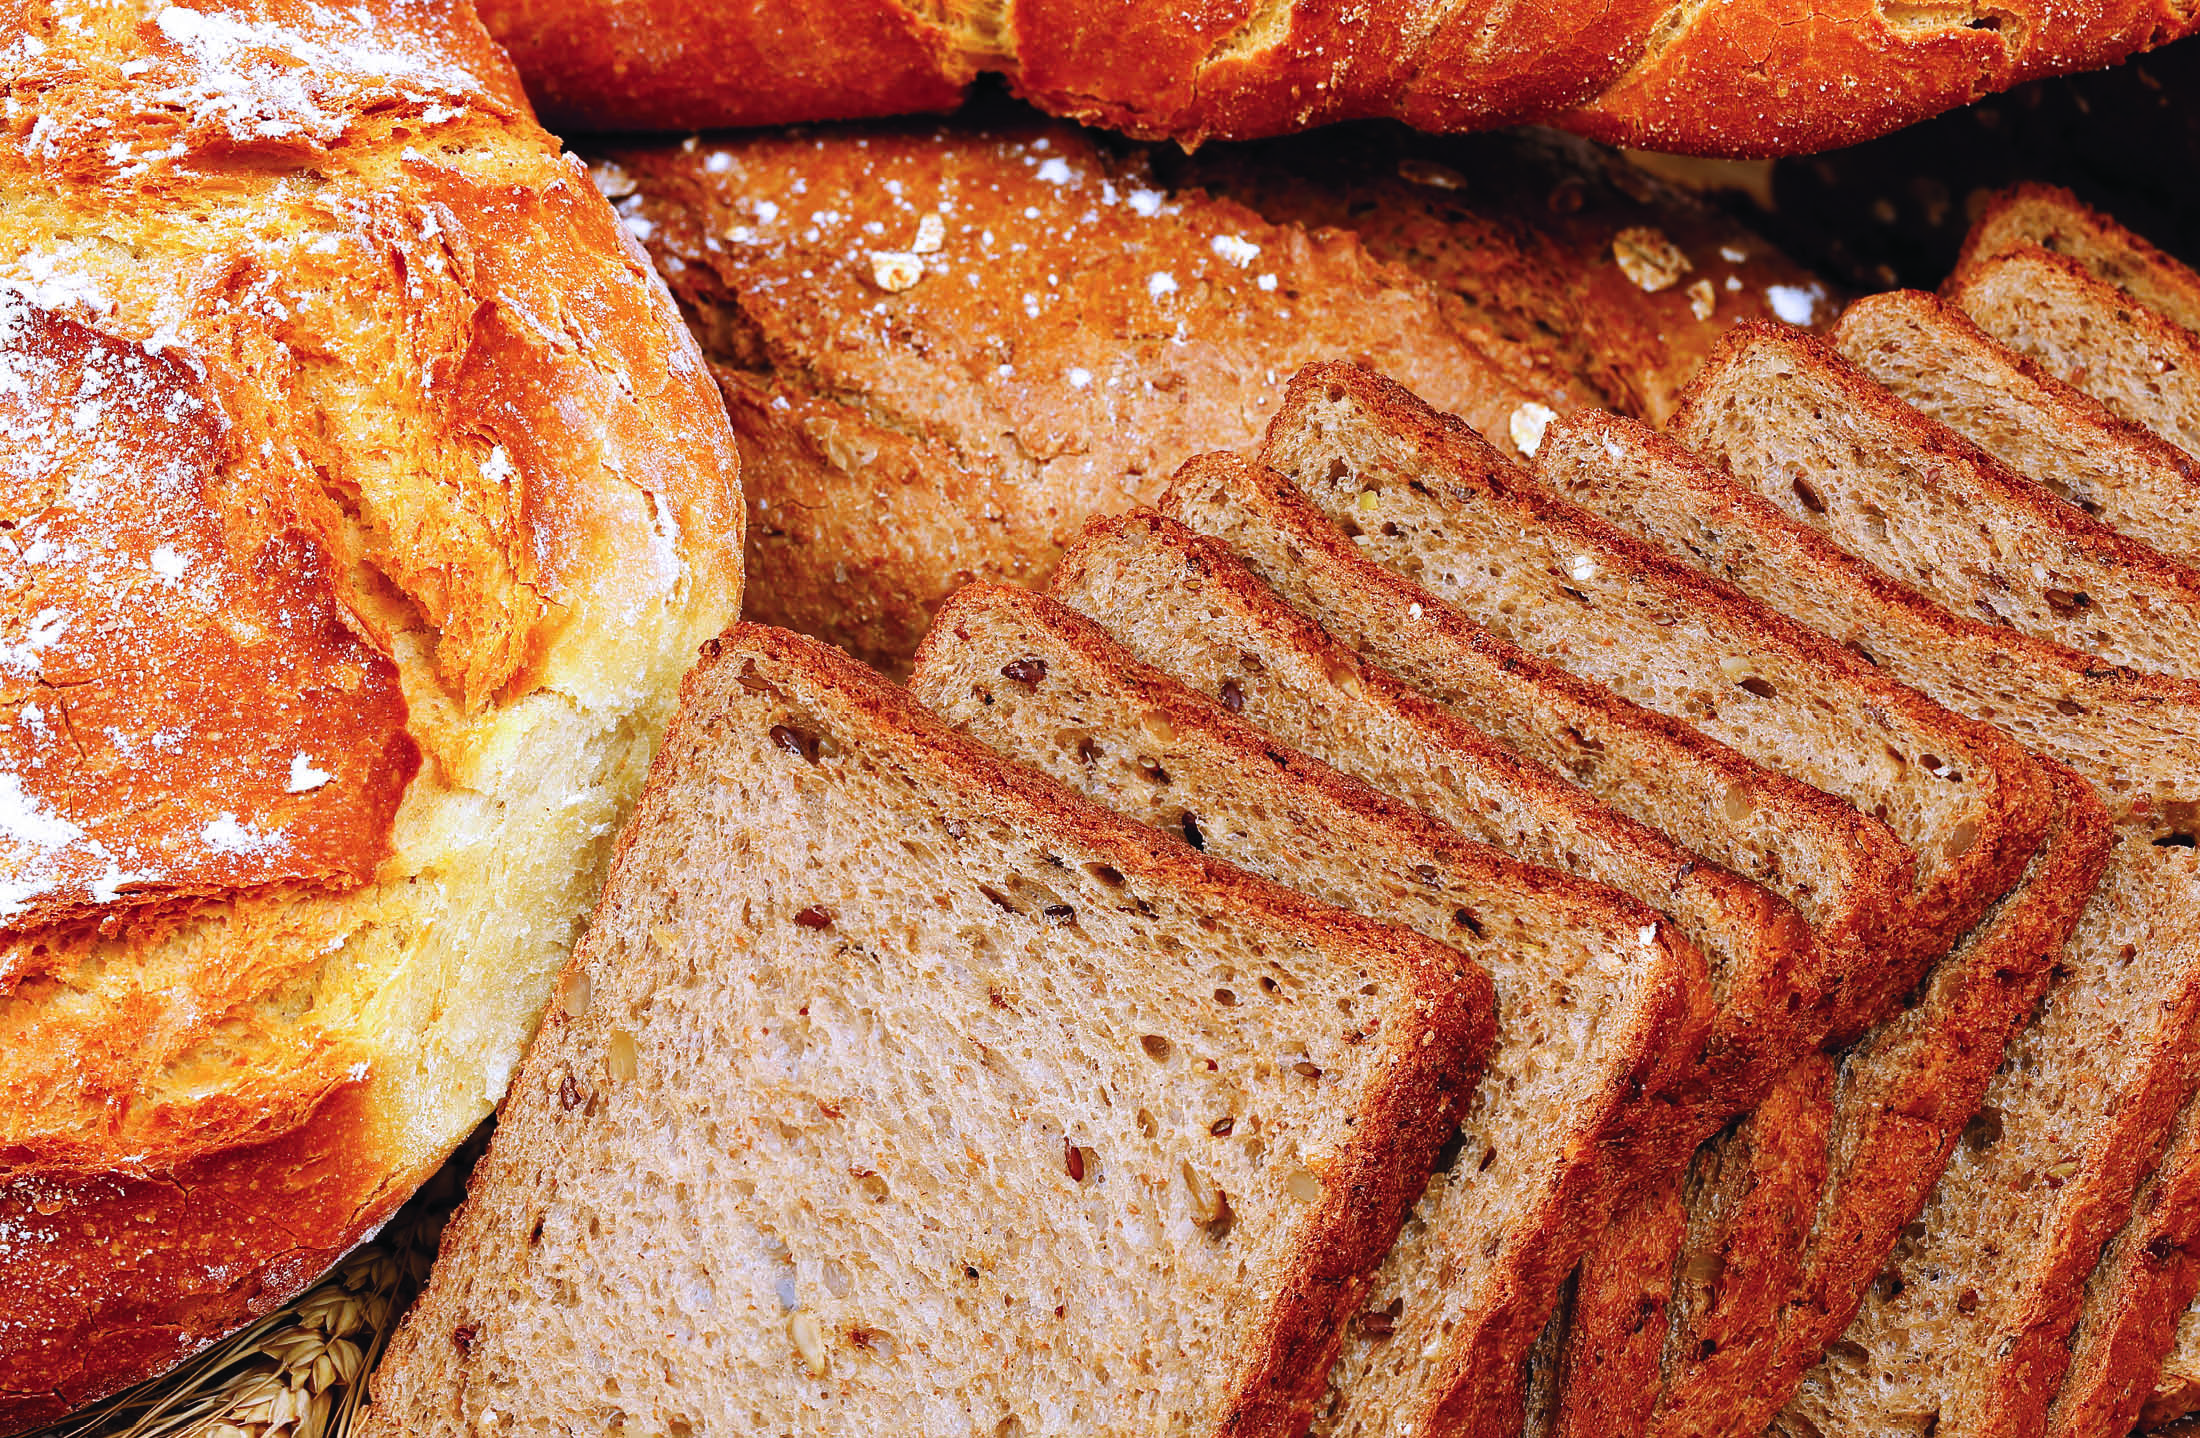
Wheat food products to illustrate Wheat Industry News

USW and its partner organizations have completed the crop quality analysis of the 2017/18 U.S. hard red winter (HRW) crop. The final data is summarized below. The complete analysis will appear in both a class-specific report and USW’s 2017 Crop Quality Booklet, and shared with hundreds of customers around the world as part of USW’s annual Crop Quality Seminars.

This HRW crop is a strong testament to the primal role of economics and weather in farming.

At planting, the profit potential of HRW did not look very good to many farmers and those who could do so planted more land to other crops. Planted area fell to its lowest level in more than 100 years. Then, although variable conditions challenged the crop, moisture remained adequate, or even excessive in some areas, resulting generally in better than expected yields. Still, USDA has estimated the HRW supply (excluding a small volume of imports) at 36.5 MMT, down 13 percent from 2016/17. Whole crop composite average protein levels are generally lower than average but the crop offers good milling and processing characteristics.

Wheat and Grade Data. Overall kernel characteristics are outstanding in the 2017 crop, although protein levels were again relatively low. Despite the challenging growing conditions, overall 92 percent of Composite, 86 percent of Gulf-Tributary and 100 percent of Pacific Northwest-Tributary samples graded U.S. No. 2 or better. Test weight averages 60.5 lb/bu (79.6 kg/hl), above the 5-year average of 60.3 lb/bu (79.3 kg/hl) and equal to last year. The total defects average of 1.2 percent is below the 2016 and 5-year averages. Foreign material is 0.1 percent, below last year’s 0.2 percent, while shrunken and broken at 0.9 percent is equal to last year and below the 5-year average. Average thousand kernel weight of 31.0 g significantly exceeds the 5-year average of 29.1 g. The average wheat falling number is 378 sec, below 2016 and the 5-year average, but still indicative of sound wheat.

The average protein of 11.4 percent (12 percent mb) is similar to last year, but significantly lower than the 5-year average. Protein content distribution varies by growing region. Approximately 56 percent of the samples tested were less than 11.5 percent protein, 28 percent between 11.5 percent to 12.5 percent and 16 percent greater than 12.5 percent.

Flour and Baking Data. The Buhler laboratory mill flour yield average is 78.1 percent, above the 2016 average of 76.6 percent and the 5-year average of 75.2 percent. However, flour ash of 0.64 percent (14 percent mb) is also higher than 2016’s 0.56 percent and the 5-year average. Gluten index values average 93 percent, equal to both last year and the 5-year average. The W value of 199 (10-4 J) is slightly lower than last year’s average and well below the 5-year average. Average bake absorption is 62.8 percent, similar to 2016 and the 5-year average. Farinograph development and stability times are 4.5 min and 6.1 min, respectively, compared to last year’s respective times of 4.0 min and 6.7 min and significantly lower than the 5-year averages. Loaf volume averages 806 cm3, below 2016 and the 5-year average, but still indicative of good baking quality.

Summary. The quality of the 2017 HRW crop is very similar to the 2016 crop. Generally, the 2017 crop was planted and developed in a favorable environment until late in the growing season, with abundant moisture and no heat stress in the Central and Southern Plains. High yields resulted in lower quantities of wheat and flour protein, but the crop exhibits very good milling characteristics. The loaf volumes achieved indicate there is adequate protein quality to make good quality bread even though mix times are shorter than the 5-year averages. This crop meets or exceeds typical HRW contract specifications and should provide high value to customers.

 

October 5, 2017/by actualize
Share this
  • Share on Facebook
  • Share on Twitter
  • Share on WhatsApp
  • Share on LinkedIn
  • Share by Mail
https://www.uswheat.org/wp-content/uploads/2021/07/Working-with-Buyers-Bread-Square.jpg 1438 2200 actualize https://www.uswheat.org/wp-content/uploads/USW-Logo-Full-Color.png actualize2017-10-05 13:30:422017-10-05 13:30:42Good Functional Characteristics, Lower Average Protein Mark New HRW Crop

Wheatletter Sidebar

Quick Links

  • Newsroom
  • Wheat Letter Blog
  • News Releases
  • Videos

Wheat Letter Related Blogs

Photo of a combine unloading wheat into a semi-trailer.
Wheat Industry News

Wheat Industry News

News and Information from Around the U.S. Wheat Industry Speaking of Wheat “Overall, U.S.…
MORE
March 16, 2023
https://www.uswheat.org/wp-content/uploads/USW_2022_NE_Harvest-5-scaled.jpg 1707 2560 Steve Mercer https://www.uswheat.org/wp-content/uploads/USW-Logo-Full-Color.png Steve Mercer2023-03-16 09:38:472023-03-16 09:38:47Wheat Industry News
Image shows a folded US$ bill shaped like a price movement chart up and down and flat.
Market and Crop Analysis

Markets Look for Weaker Dollar as Purchasing Conditions Improve

With recent breaks in U.S. and global wheat futures and lower freight rates, the wheat market…
MORE
March 15, 2023
https://www.uswheat.org/wp-content/uploads/Looking-for-a-Weaker-.jpg 795 1318 Steve Mercer https://www.uswheat.org/wp-content/uploads/USW-Logo-Full-Color.png Steve Mercer2023-03-15 17:00:322023-03-16 09:39:20Markets Look for Weaker Dollar as Purchasing Conditions Improve

Stay up to date on wheat industry news!

SUBSCRIBE

Think Farm Export Programs Don’t Matter? Think Again.

GET THE REST OF THE STORY

Our Story

  • About USW
  • Dependable People. Reliable Wheat.
  • Board of Directors
  • Staff Directory
  • Office Locations

Market Information

  • Market Information
  • Price Reports
  • Price Charting Tools
  • Supply and Demand
  • Commercial Sales

Crop Quality

  • Crop Quality
  • Harvest Reports
  • Hard Red Winter
  • Hard Red Spring
  • Hard White
  • Soft White
  • Soft Red Winter
  • Durum

Working with Buyers

  • Working With Buyers
  • Customer Conferences
  • Wheat Classes
  • Wheat Glossary
  • Wheat Grade Factors
  • How to Buy
  • Ask the Expert
  • Resources

Who We Represent

  • Who We Represent
  • Board Meetings
  • State Wheat Commissions
  • Partners
  • Trade Activities

Policy

  • Policy
  • Trade Negotiations
  • Trade Barriers
  • Innovation and Sustainability
  • Food Security and Assistance
  • Public-Private Partnership

News

  • Newsroom
  • Wheat Letter Blog
  • News Releases
  • Videos

DTN Wheat Detail
DTN Corn Detail

2008-2013 U.S. Wheat Associates. All Rights Reserved
Privacy Policy | Non-Discrimination Statement

Scroll to top