In 2022, U.S. wheat farmers continued a now three-year run producing excellent quality soft red winter (SRW) wheat for the world’s weak gluten wheat buyers and food processors.
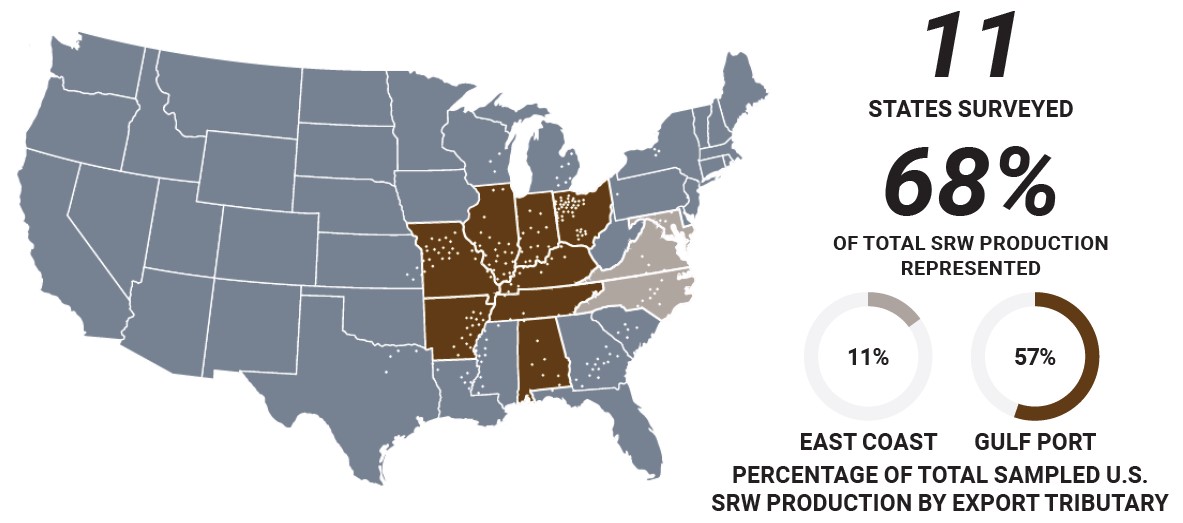
U.S. SRW is grown over a wide area mainly east of the Mississippi River. The production region experienced generally good growing conditions in the 2022 crop year. A total of 230 samples from elevators in 18 reporting areas across 11 states accounting for an estimated 68% of total U.S. SRW production, were collected and analyzed by Great Plains Analytical Laboratory, Kansas City, Mo. The results were weighted by the estimated production for each reporting area and combined into “Composite Average,” “East Coast” and “Gulf Port” values.
Hitting Quality Targets
The 2022 SRW crop is very sound with high test weight and falling number values, lower moisture, good milling characteristics, and is relatively free of DON. Processors will find a versatile crop with good qualities for cookies, cakes and crackers. With higher protein and good extensibility, the crop should also be valuable in blending for baking applications.
Buyers are encouraged to review their quality specifications to ensure that purchases meet their expectations.
U.S. Wheat Associates (USW) has posted more information on the Soft Red Winter Wheat 2022 Quality Survey on its website here.
The Season in Review
Planting started at a normal pace in mid-September 2021 and progress was similar to the 5-year average. USDA estimates SRW seeded area for the 2022 harvest at 2.78 million hectares, up from 2.67 million hectares seeded for the 2021 harvest and above the 5-year average.
As the crop developed, there was plentiful moisture through winter and spring with only Maryland seeing lower soil moisture. Overall, timely mild temperatures and rainfall benefited critical kernel development.
Harvest began slowly in late-May but picked up pace in mid-June with hotter temperatures and dry conditions. By July, much of the growing region experienced heat, humidity and above average rainfall with pockets of favorable harvest weather.
2022 SRW production is estimated to be 10.4 million metric tons (MMT), up from 9.8 MMT in 2021 and above the 5-year average of 8.3 MMT.
2022 Crop Highlights
- The overall grade sample average for the 2022 SRW harvest survey is U.S. No. 1 SRW; the Gulf average is U.S. No. 1 SRW, and East Coast is U.S. No. 2.
- Test Weight averages trended higher and indicate a sound crop with a Composite average of 60.1 lb/bu (79.1 kg/hl), a Gulf average of 60.3 lb/bu (79.3 kg/hl) and East Coast average at 59.7 lb/bu (78.5 kg/hl).
- 1000 Kernel Weight, Kernel Diameter and Wheat Protein values reflect a relatively consistent crop.
- Single Kernel values also reflect a consistent crop. For the East Coast, kernels are softer, heavier and larger than last year but harder and smaller than the 5-year average. For the Gulf, kernels are slightly softer, lighter and smaller than last year, but harder than the 5-year average.
- Wheat Protein content demonstrates a consistent crop. The Composite average of 9.6% (12% mb) and East Coast average of 10.1% are higher than 2021 and 5-year averages. The Gulf average of 9.4% is slightly higher than 2021 but below the 5-year average.
- Falling Number trended well above average, indicating this is a sound crop with very little sprout damage. Composite (327 sec), East Coast (336 sec) and Gulf (325 sec) are all above 2021 and 5-year averages.
- Vomitoxin (DON) averages are well below the USDA threshold of 2.0 ppm and indicate that the sampled crop is relatively free of DON: Composite (0.7 ppm), Gulf (0.8 ppm) and East Coast (0.4 ppm).
- Laboratory Mill Flour Extraction for Composite (66.4%), East Coast (66.6%) and Gulf (66.4%) are all higher than 2021 but below the 5-year averages. The extraction rate from a laboratory mill is not optimized and will always be significantly lower than the rate obtained from a commercial mill.
- Amylograph data indicates enhanced starch characteristics that are well suited for batter-based products. The 2022 averages for Composite (666 BU), East Coast (574 BU) and Gulf (687 BU) reinforce the high falling numbers and indicate very low levels of amylase activity.
- Solvent Retention Capacity (SRC) values generally indicate excellent quality for cookies and crackers. Sucrose values indicate cookies and crackers will benefit from reduced baking time.
- Dough Properties suggest that this crop is weaker than the 5-year average and is typical for SRW.
- Alveograph data indicate a crop that is more extensible, less resistant than last year and is suitable for blending bread-type products. P values: Composite (36 mm), East Coast (41 mm) and Gulf (35 mm); L values: Composite (82 mm), East Coast (91 mm) and Gulf (80 mm).
- Average Loaf Volumes are higher than last year and indicate this crop is excellent for blending: Composite (624 cc), East Coast (610 cc) and Gulf (627 cc).
- The Cookie Spread Ratios for Composite (10.7), East Coast (10.6) and Gulf Ports (10.7) are all similar to last year and higher than the 5-year averages, indicating good spreadability.
The latest 2022 USW Harvest Report on all U.S. wheat classes is posted here. Wheat Letter will share final crop quality reports as they are available, and reports will be posted here.