• Facebook
  • Twitter
  • Vimeo
  • LinkedIn
  • SUBSCRIBE
  • MEMBER LOGIN
U.S. Wheat Associates
  • Our Story
    • About USW
    • Dependable People. Reliable Wheat.
    • Board of Directors
    • Staff Directory
    • Office Locations
  • Market Information
    • Market Information
    • Price Reports
    • Price Charting Tools
    • Supply and Demand
    • Commercial Sales
  • Crop Quality
    • Crop Quality
    • Harvest Reports
    • Hard Red Winter
    • Hard Red Spring
    • Hard White
    • Soft White
    • Soft Red Winter
    • Durum
  • Working With Buyers
    • Working With Buyers
    • Customer Conferences
    • Wheat Classes
    • Wheat Glossary
    • Wheat Grade Factors
    • How to Buy
    • Ask the Expert
    • Resources
  • Who We Represent
    • Who We Represent
    • Board Meetings
    • State Wheat Commissions
    • Partners
    • Trade Activities
  • Policy
    • Policy
    • Trade Negotiations
    • Trade Barriers
    • Innovation and Sustainability
    • Food Security and Assistance
    • Public–Private Partnership
  • News
    • Newsroom
    • Wheat Letter Blog
    • News Releases
    • Videos
  • Search
  • Menu Menu
You are here: Wheat Letter Blog 1
Amanda Spoo, Hard Red Spring, Market and Crop Analysis, Northern Durum, Wheat Production and Harvest, Wheat Quality

Annual Spring Wheat Tour Sees Improvement from 2017 Drought Impact

By Amanda J. Spoo, USW Assistant Director of Communications

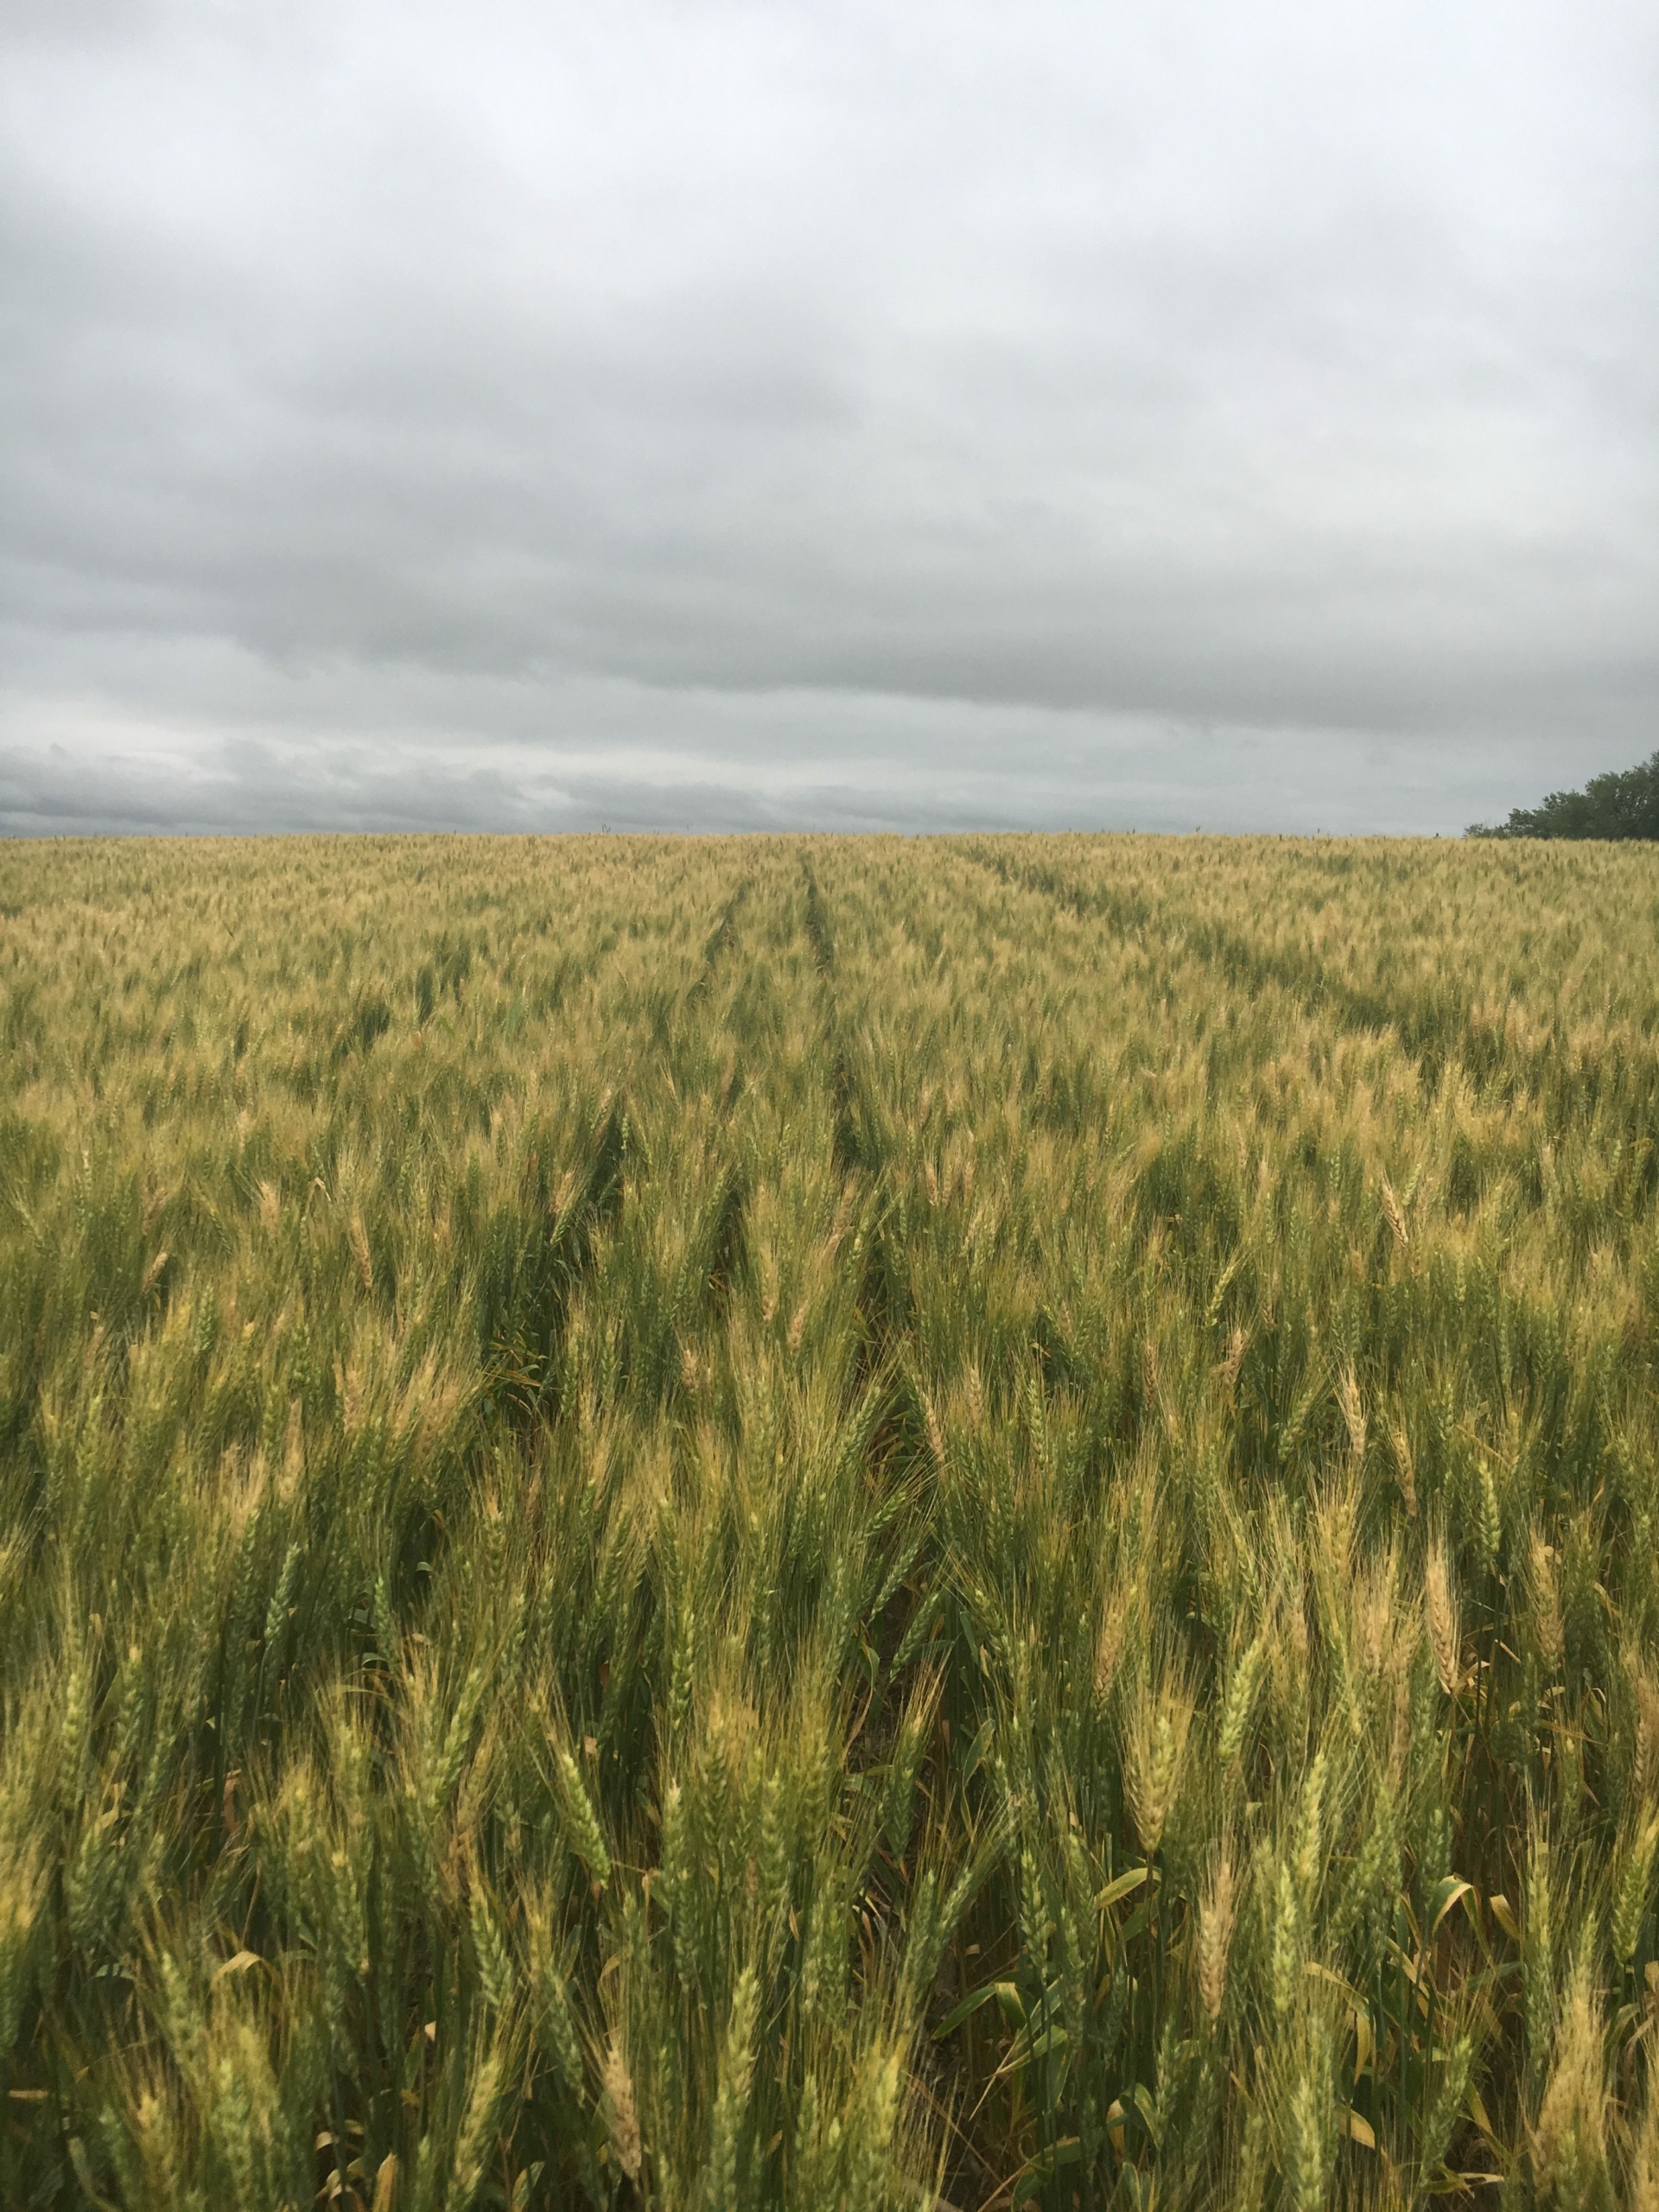
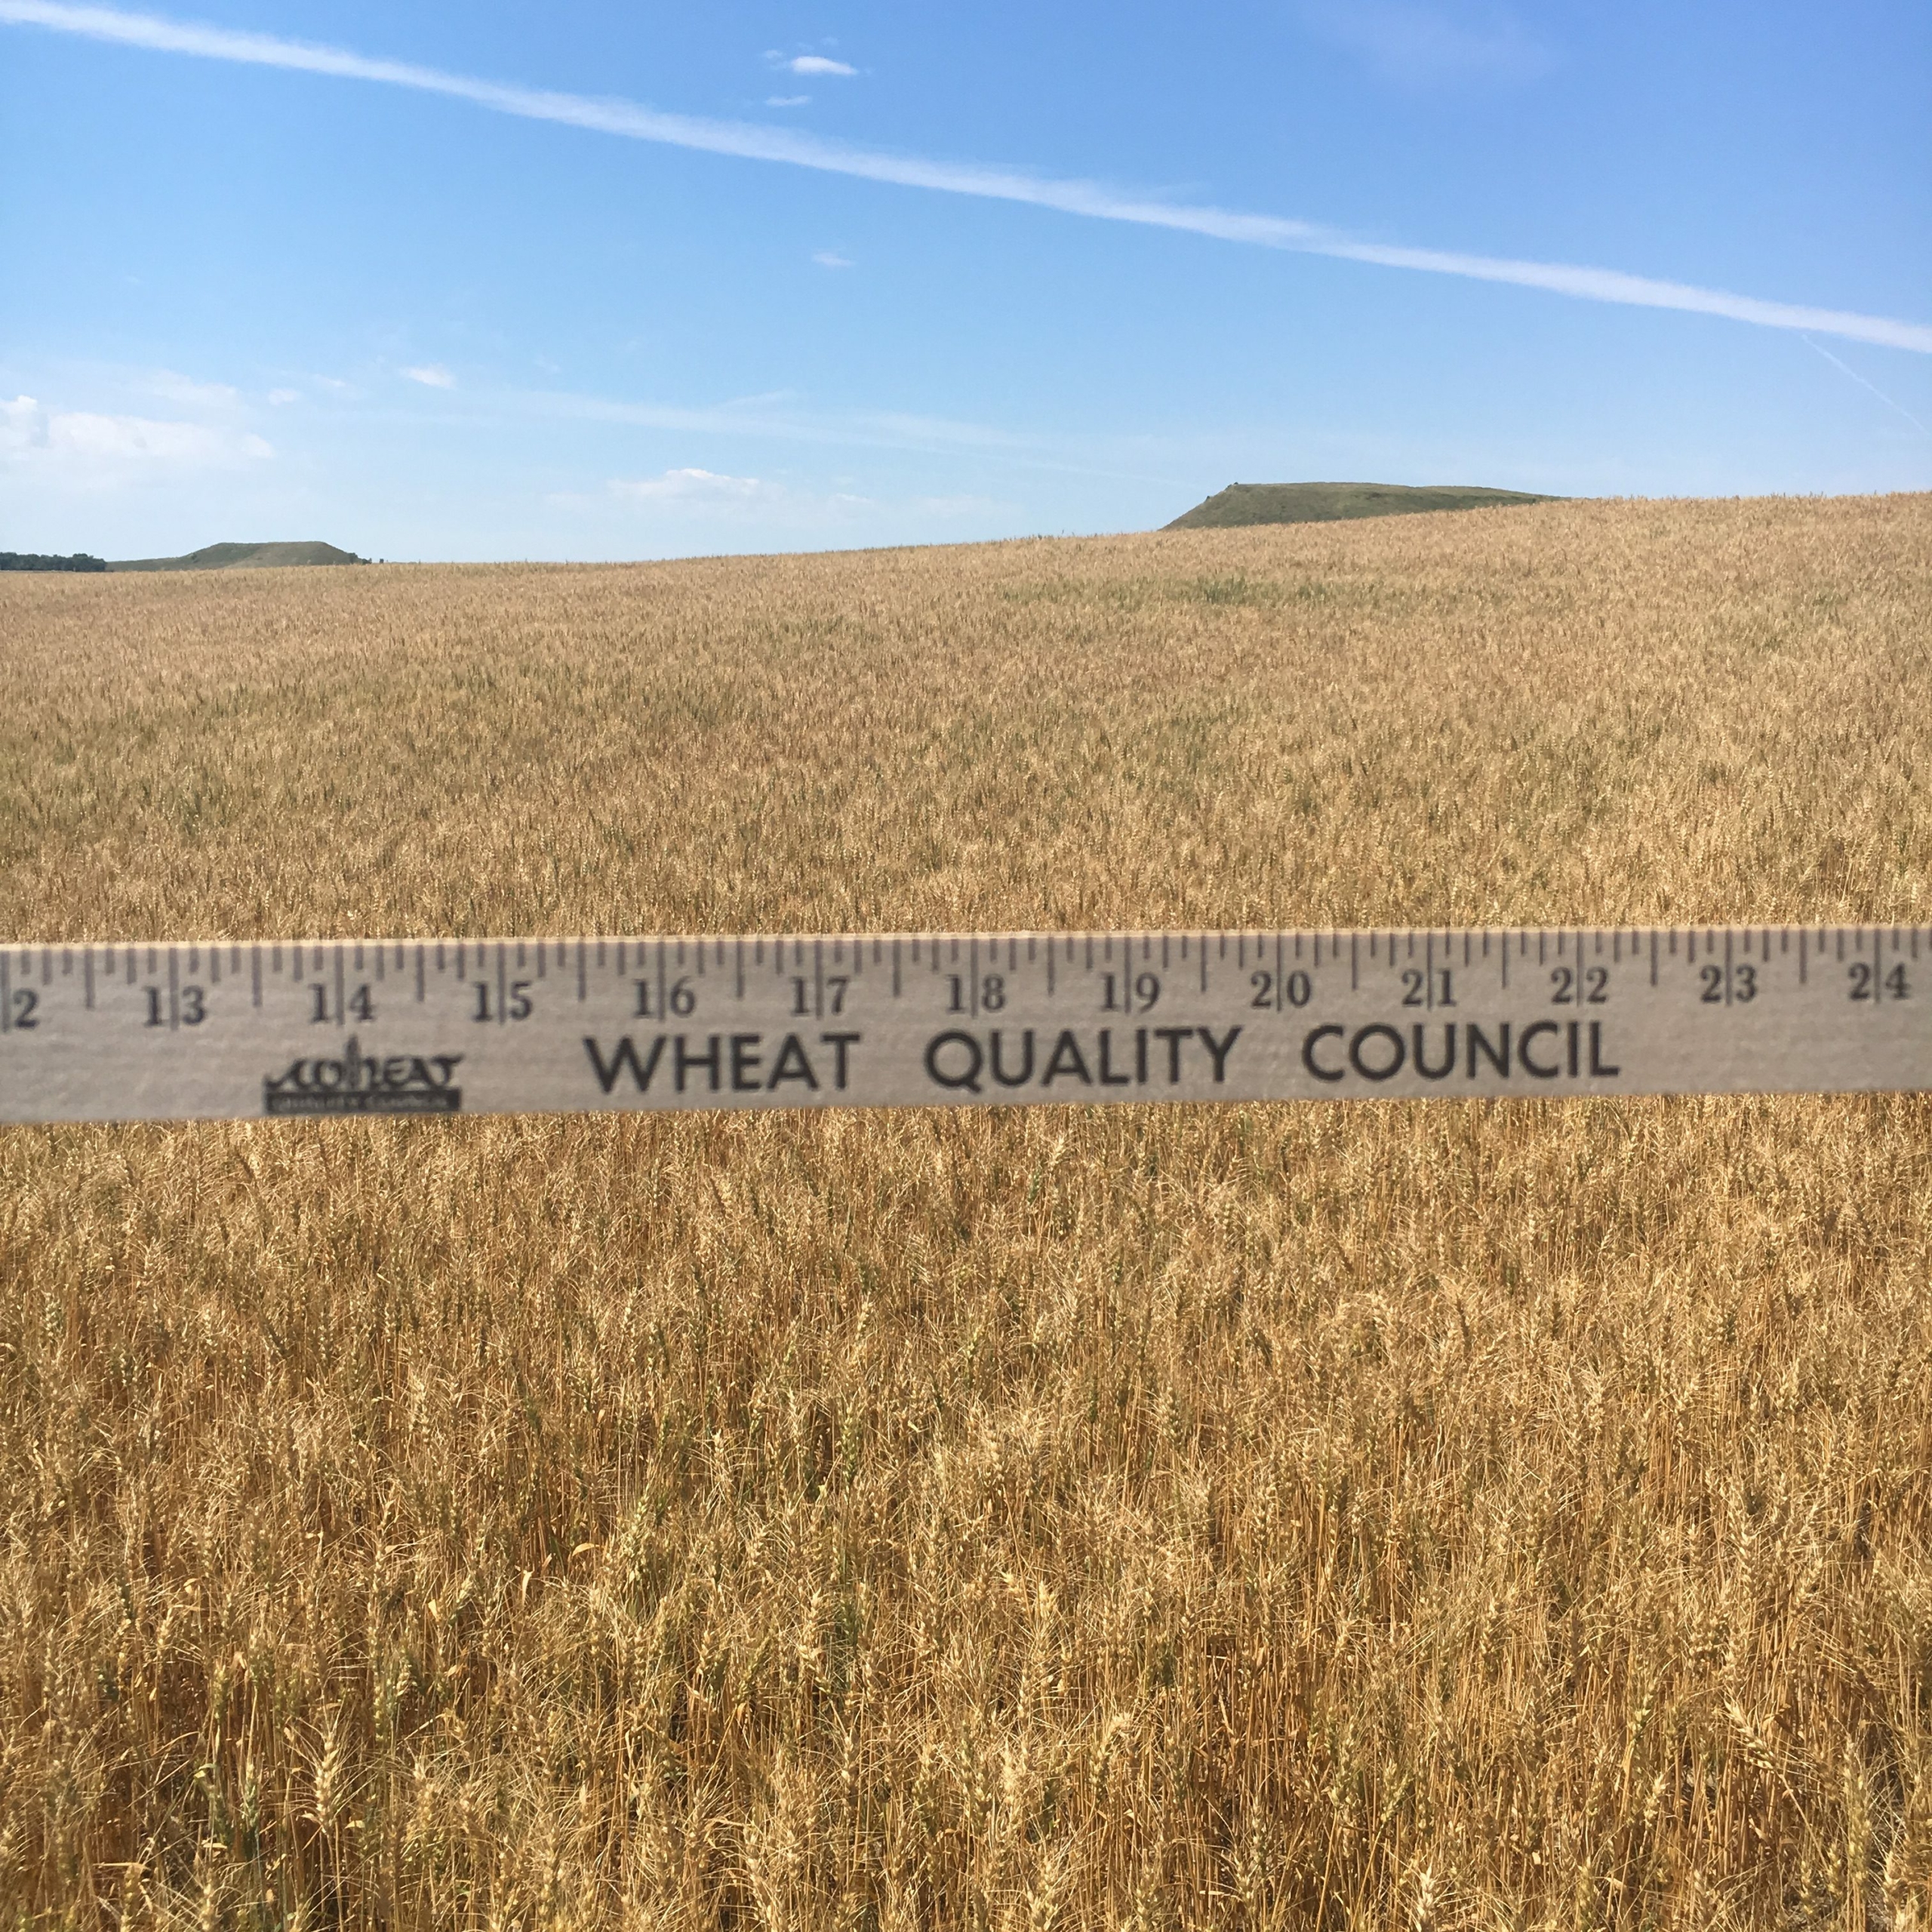
This week, the Wheat Quality Council hosted its annual hard red spring (HRS) and durum crop tour. Participants spent three days mainly in North Dakota surveying this year’s crop and estimating yield. The tour, which surveyed a total of 342 fields, estimated weighted average HRS yield at 41.1 bushels per acre (bu/a), slightly higher than last year’s HRS average of 38.1 bu/a, which was impacted by ongoing drought conditions in western areas. The durum weighted average yield was 39.3 bu/a, in line with last year’s average of 39.7 bu/a, which was a decline from 45.4 bu/a in 2016. While the overall crop looks better than last year, it is still below the tour’s 5-year average of 45.4 bu/ac.

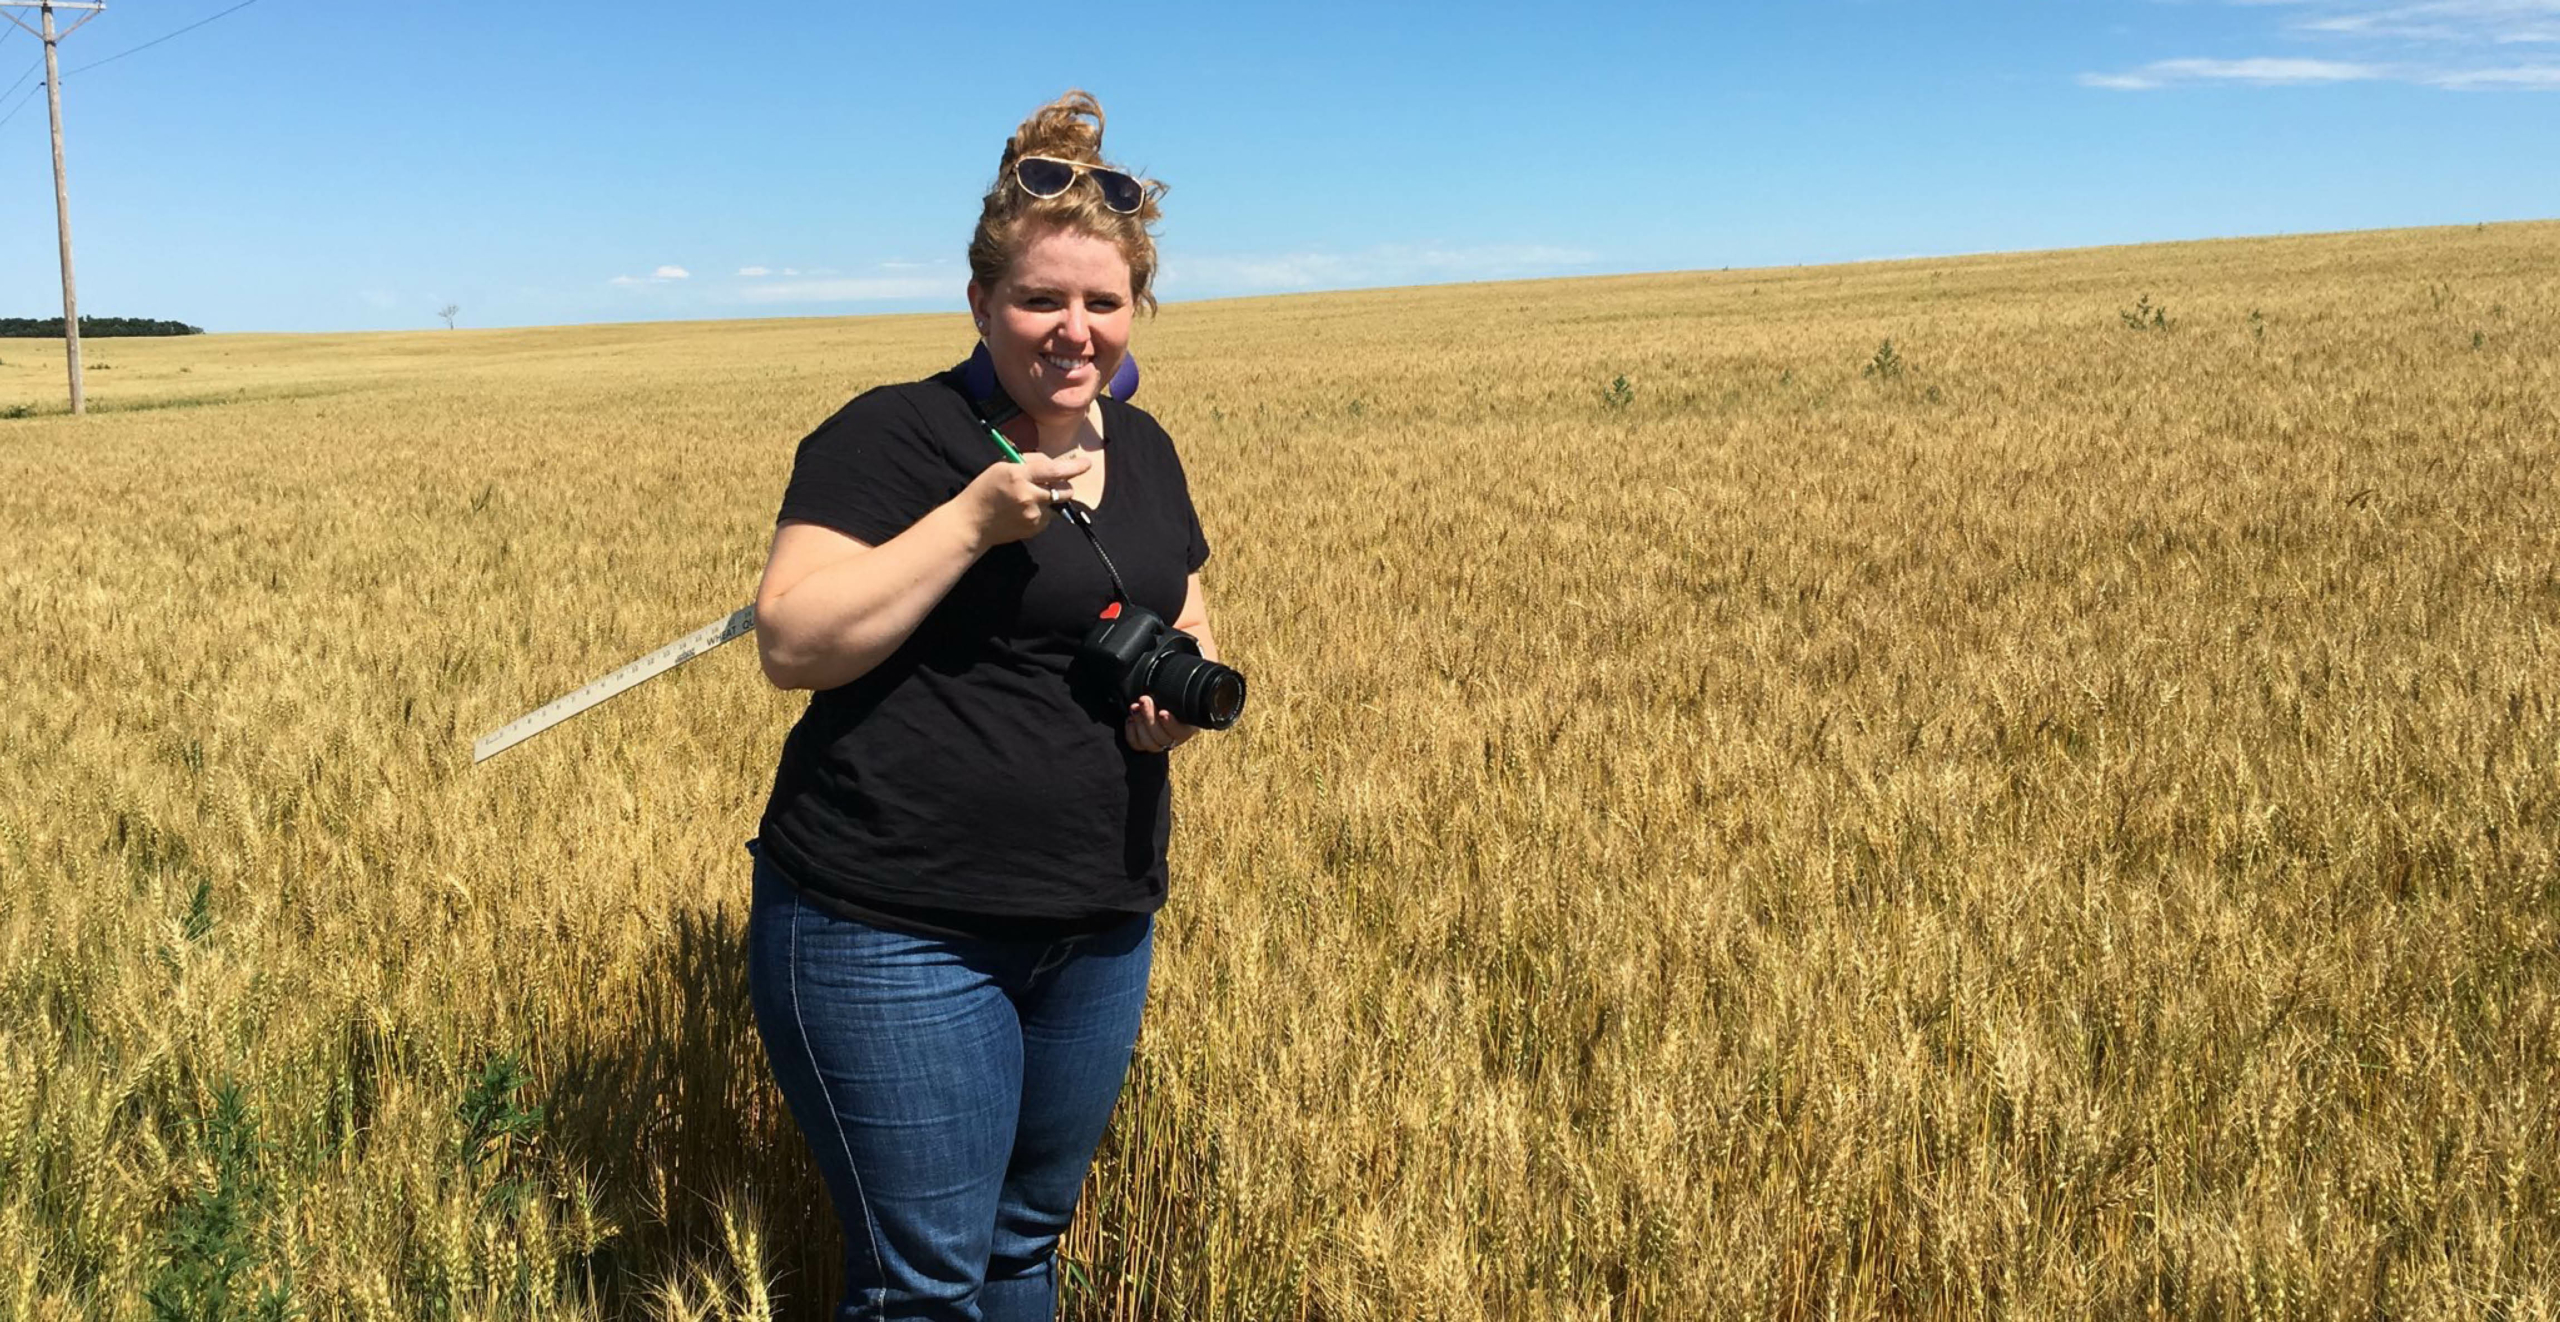
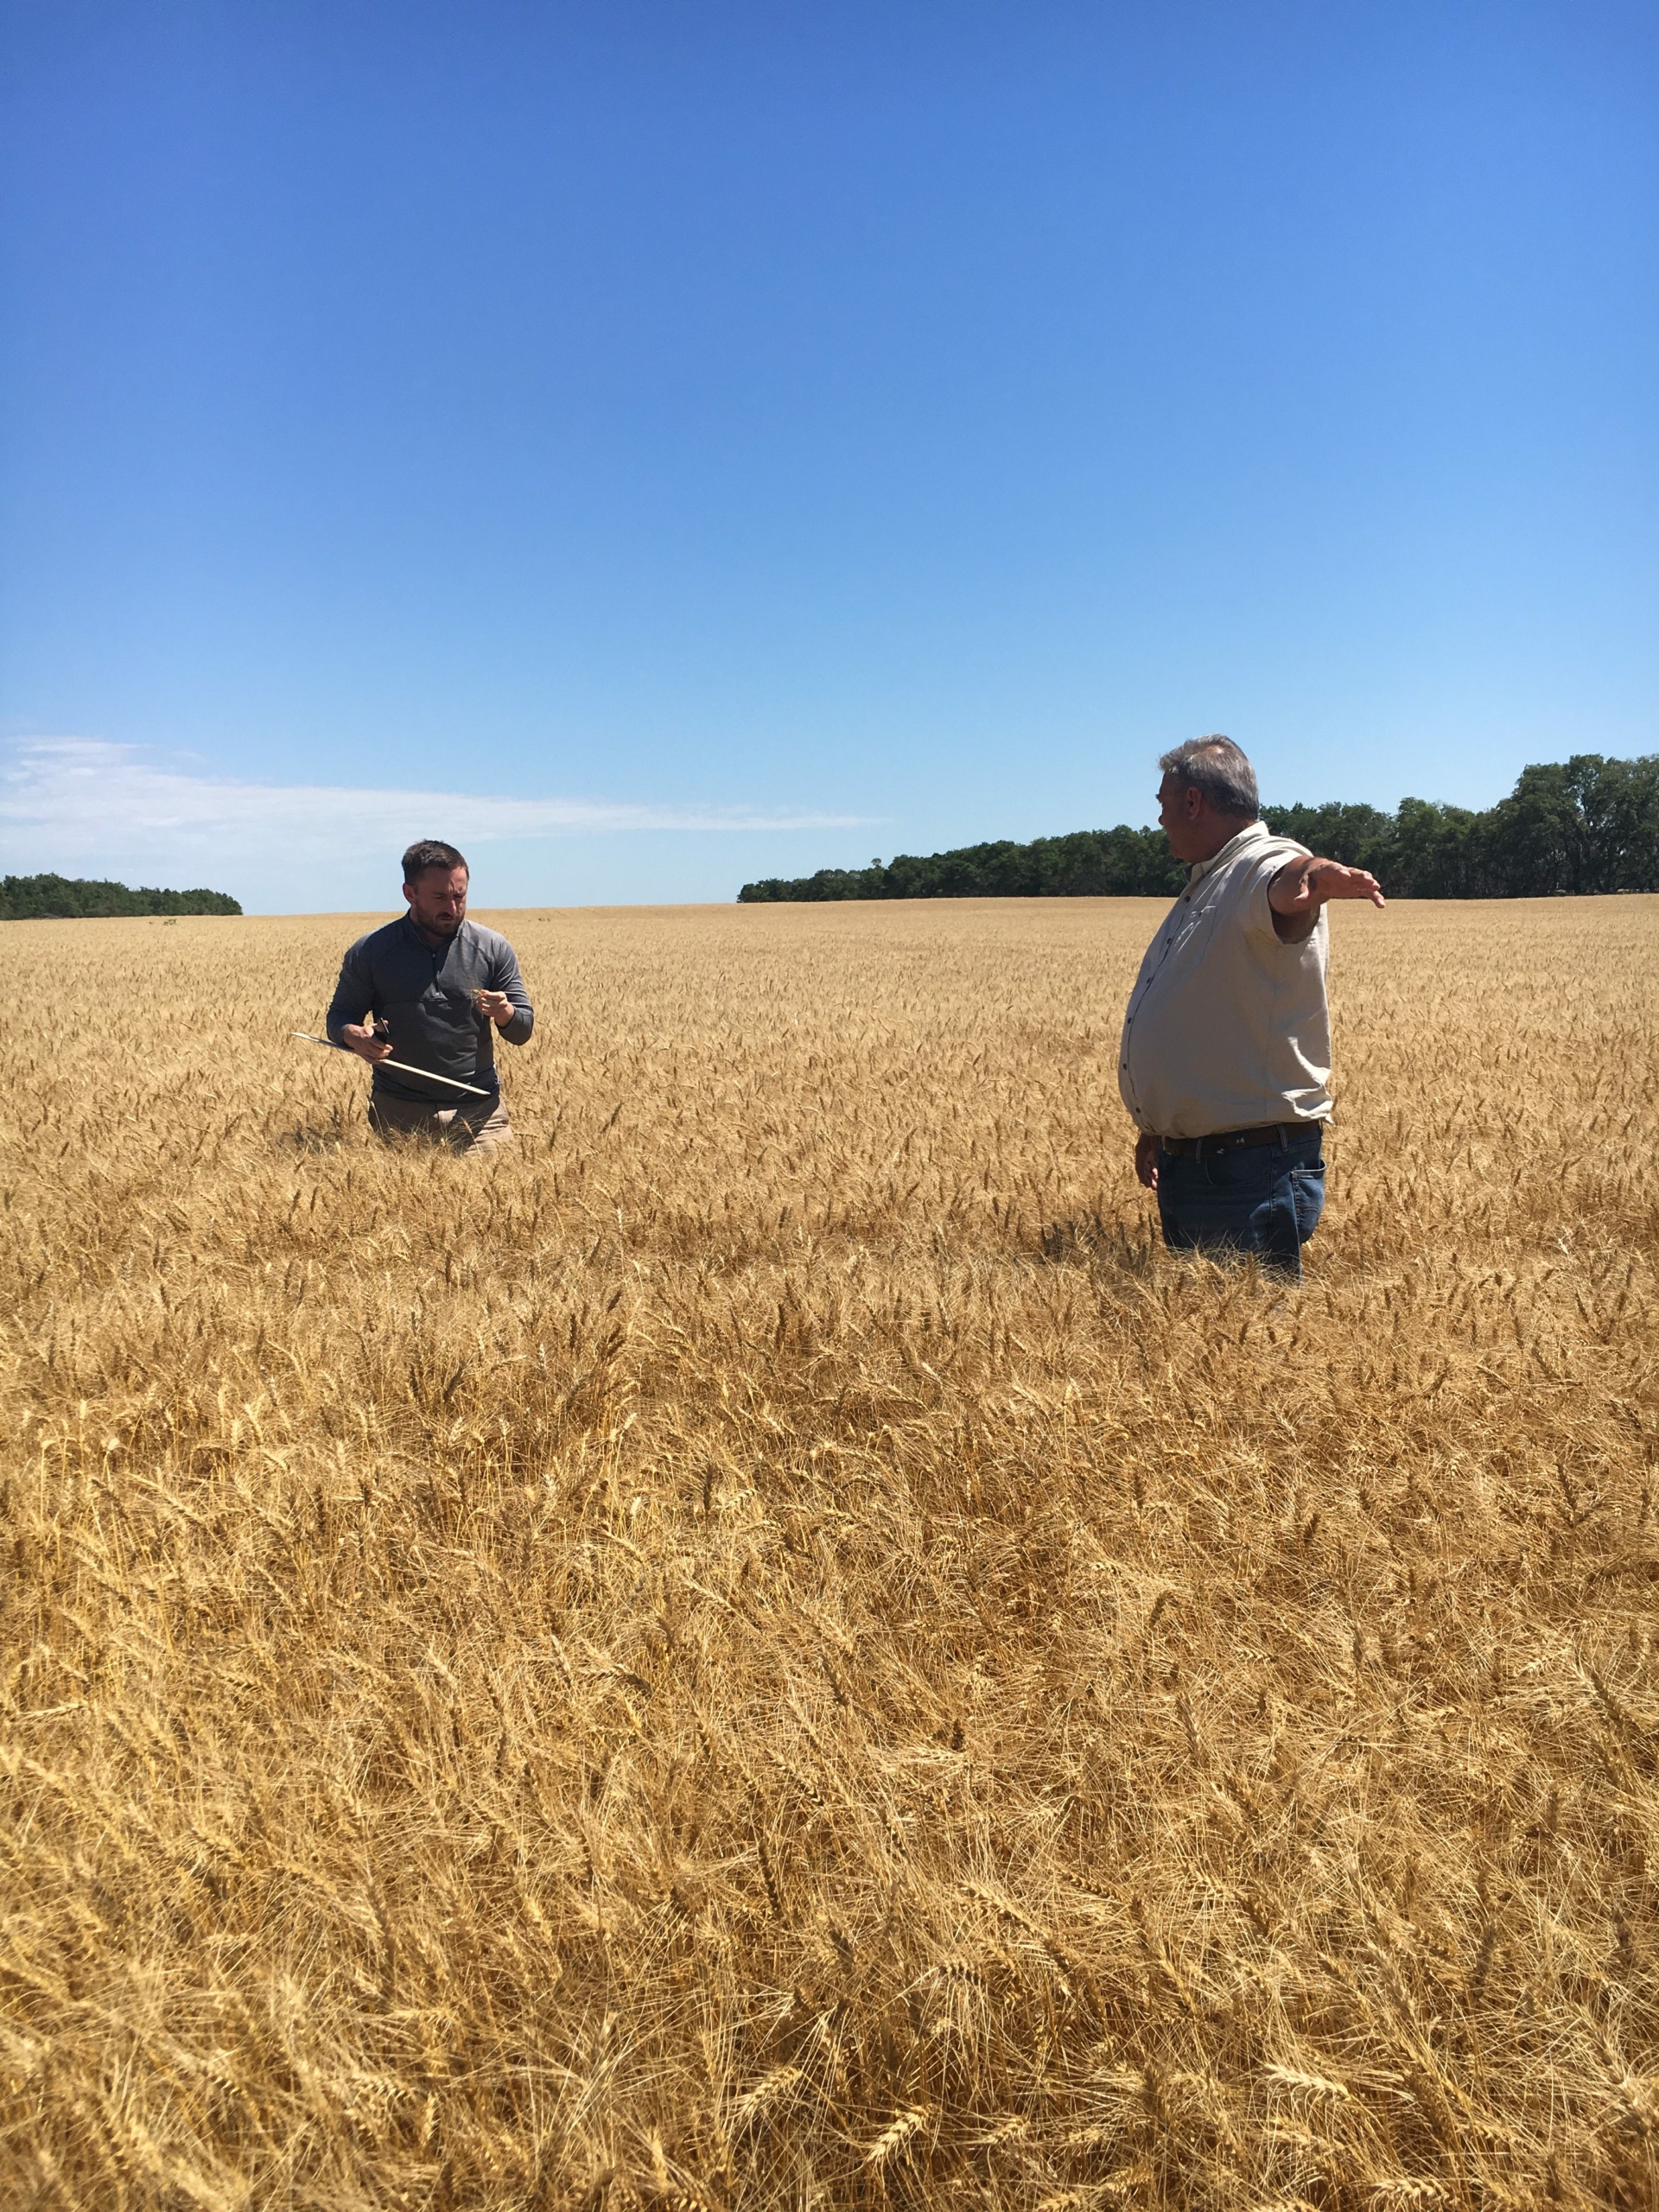
Participants on the tour always represent a wide range of the wheat industry, including millers, traders, farmers, researchers, government officials and media who travel along eight distinct routes covering most of the state’s wheat production.

“The continuing success of this tour is that we make it a value-added experience,” said Wheat Quality Council Executive Vice President Dave Green. “We keep training more and more people and that makes a difference across this industry.”

On the first day, participants drove west from Fargo to Bismarck, with two routes going farther into the western part of the state, and others covering western Minnesota and northern South Dakota. The Day 1 weighted average yield was 41.1 bu/a, up from 38.8 bu/a in 2017. For HRS specifically, the yield was 41.3 bu/a, down from 37.9 bu/a in 2017. The scouts surveyed 138 fields on Day 1, of which 135 were HRS and 3 were durum.

On Day 2, the tour surveyed 148 fields, 135 of which were HRS and 13 were durum. The group moved from Bismarck to Devils Lake. The overall average for Day 2 was 38.8 bu/a, up from 35.7 in 2017. For HRS, the yield was 38.3 bu/a, up slightly from 35.8.

The third day of the tour included a half day of crop surveying. The participants then all returned to North Dakota State University’s Northern Crops Institute in Fargo to compile the overall crop report. On Day 3, participants surveyed at total of 55 HRS fields and one durum field. The Day 3 weighted average yield for HRS was 45.6 bu/a, down slightly from 46.2 bu/a in 2017.

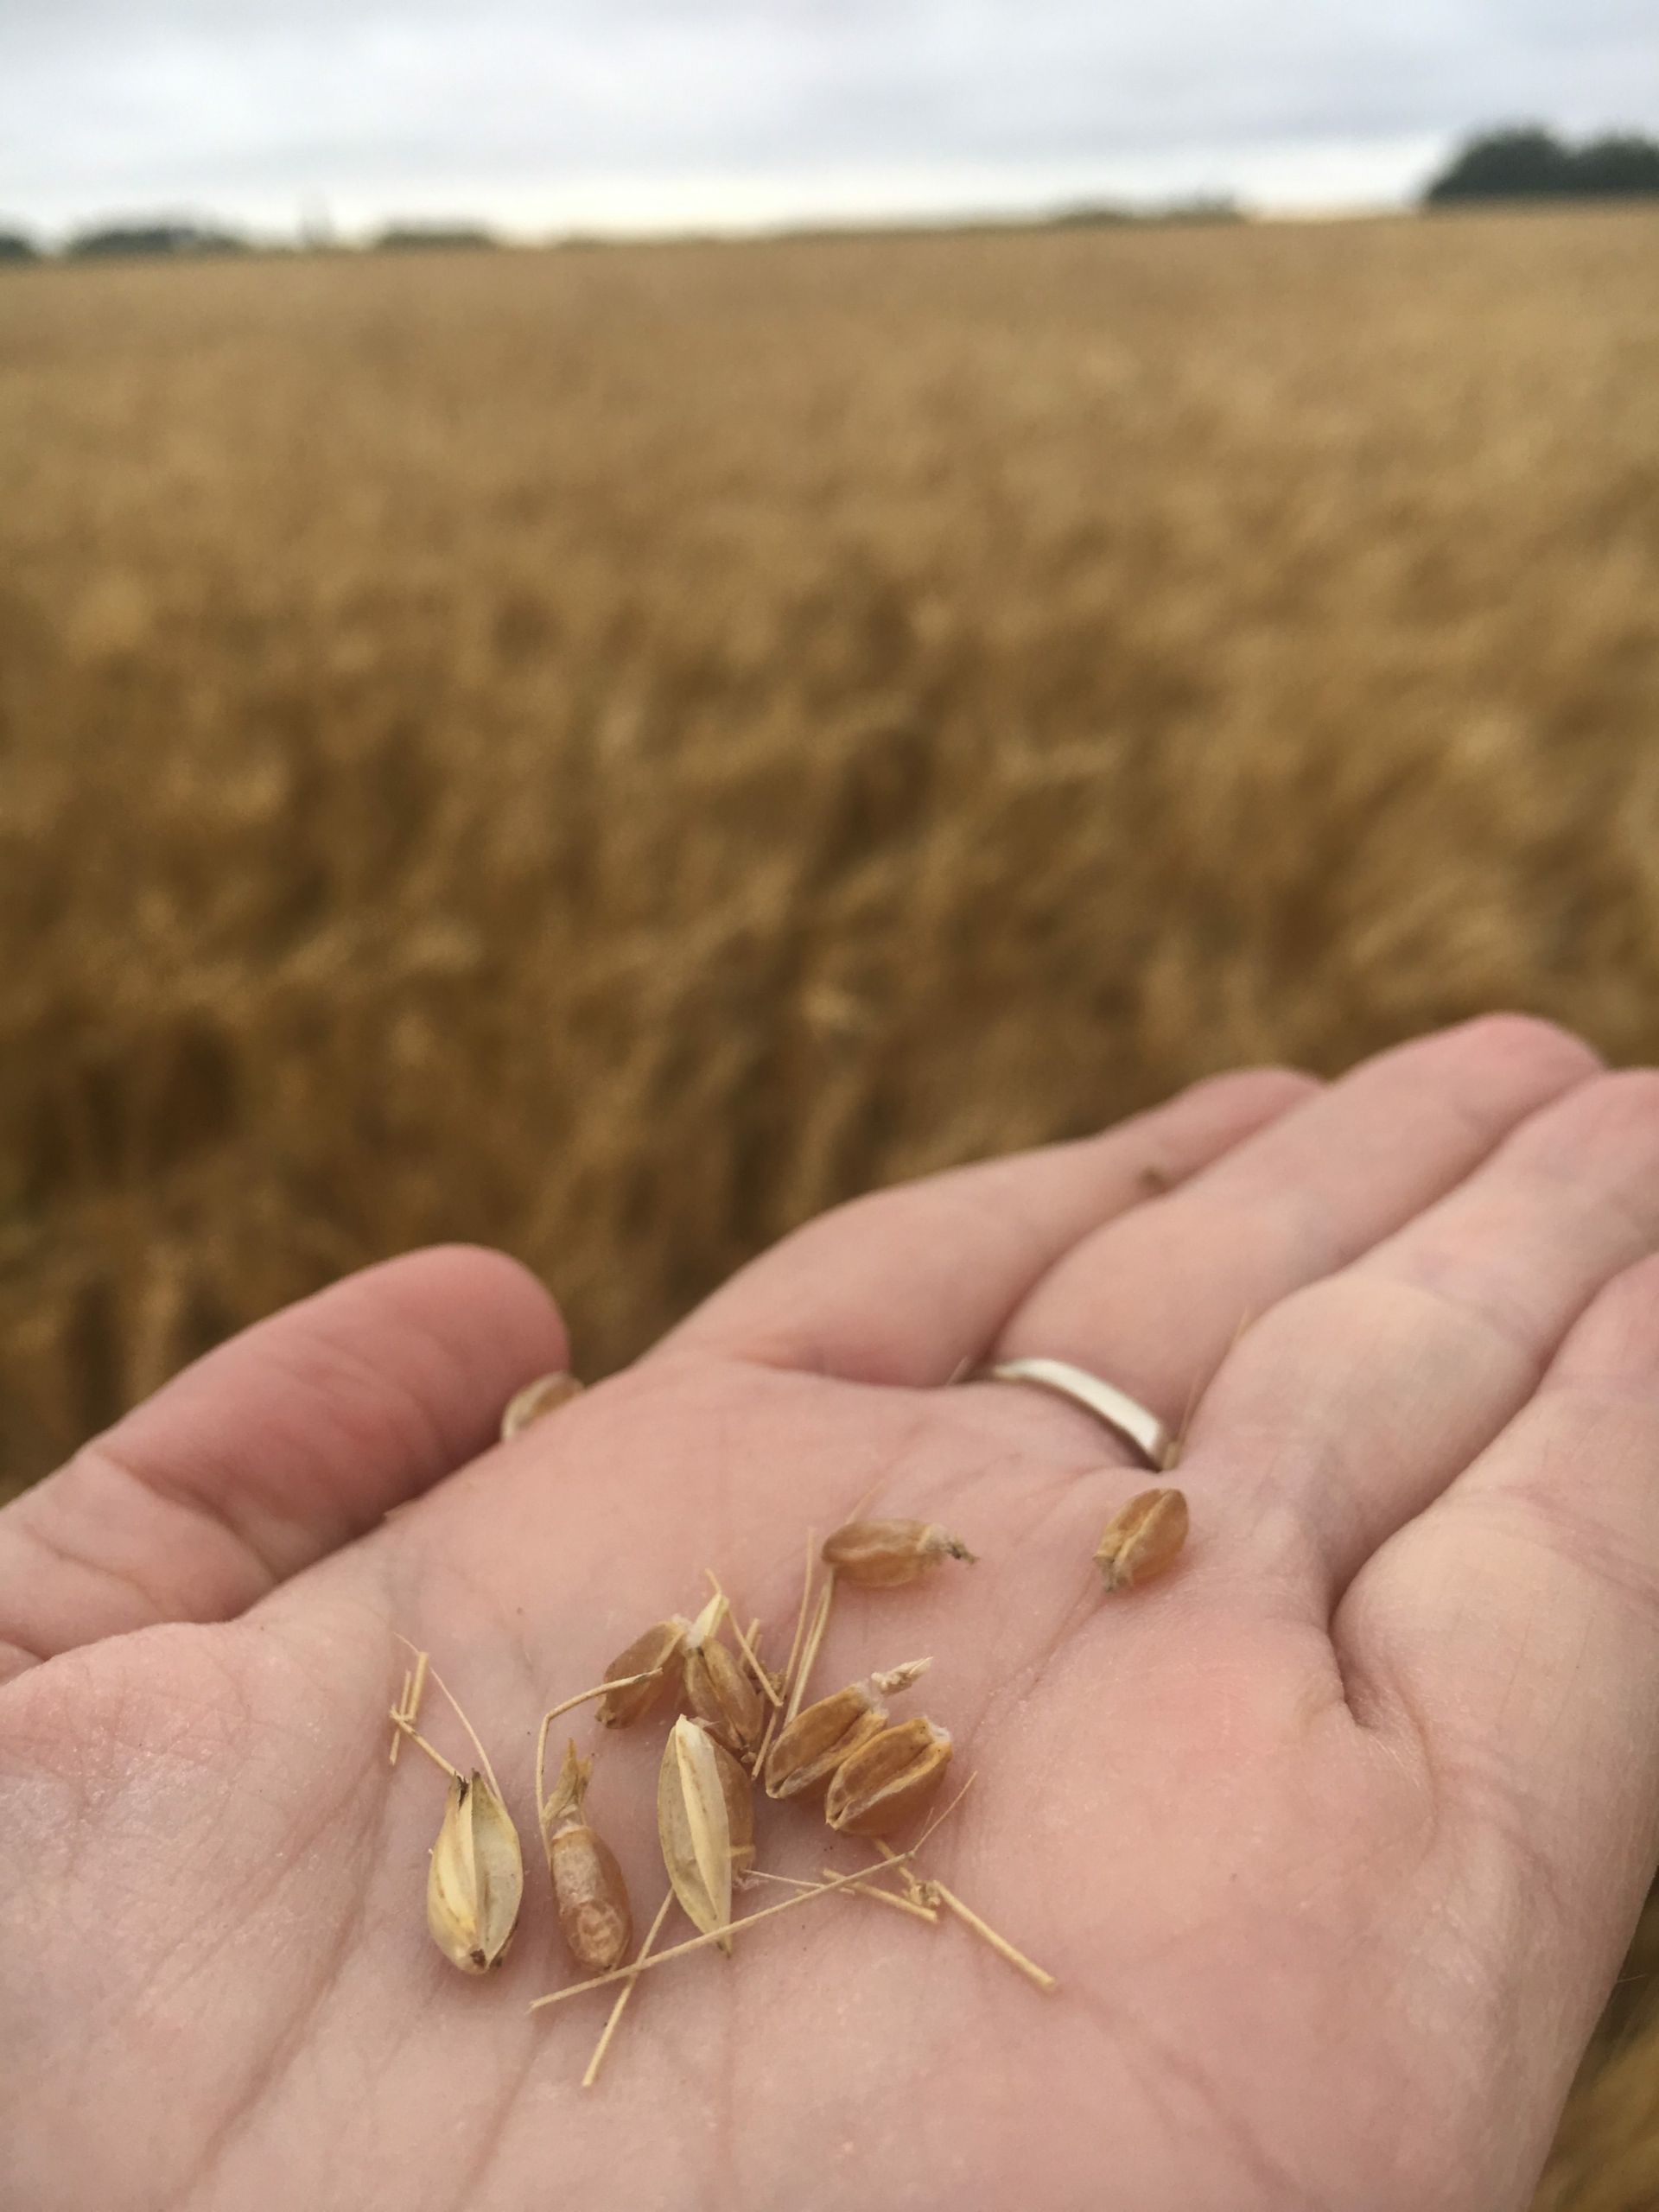
The results reflect a snapshot of yield potential observed by the participants in the fields they scouted.

“I think what we saw was kind of encouraging in part because there had been concern about scab with this crop, but we saw a lot of spraying for it; and we never felt that more than a handful of fields had a serious scab problem,” said Green. “And we were scouting for it, so we were very positive about what we saw.”

Green added, “I’m also positive that we thought we were headed for a lower protein record relative to how good everything looked going in, but I wouldn’t say the same thing now that we’ve seen the crop. I think it is going to have a wide range of protein and a lot of choices for buyers. I would anticipate that with the heat that us on the crop, the quality is going to be better than normal.”

View highlights and photos from the tour by searching #wheattour18 on Facebook and Twitter. For more information and for results from previous tours, visit the Wheat Quality Council’s website at www.wheatqualitycouncil.org.

July 26, 2018/by actualize
Share this
  • Share on Facebook
  • Share on Twitter
  • Share on WhatsApp
  • Share on LinkedIn
  • Share by Mail
https://www.uswheat.org/wp-content/uploads/2021/07/JUL18-spring-wheat-tour-Amanda-Spoo-scaled.jpg 1322 2560 actualize https://www.uswheat.org/wp-content/uploads/USW-Logo-Full-Color.png actualize2018-07-26 21:40:452018-07-26 21:40:45Annual Spring Wheat Tour Sees Improvement from 2017 Drought Impact

Wheatletter Sidebar

Quick Links

  • Newsroom
  • Wheat Letter Blog
  • News Releases
  • Videos

Wheat Letter Related Blogs

Wheat Industry News

Wheat Industry News

Recent news and highlights from around the U.S. wheat industry. Speaking of Wheat “We agree…
MORE
June 23, 2022
https://www.uswheat.org/wp-content/uploads/2021/07/PHOTOH1-e1529071940819-1-scaled.jpg 1696 2560 Amanda Spoo https://www.uswheat.org/wp-content/uploads/USW-Logo-Full-Color.png Amanda Spoo2022-06-23 14:42:132022-06-23 14:46:57Wheat Industry News
U.S. wheat farmers share a way of life in North Dakota
Wheat Production and Harvest

How to Follow the U.S. Wheat Harvest by Class and State

The 2022 U.S. wheat harvest is well underway across several states. U.S. Wheat Associates (USW)…
MORE
June 23, 2022
https://www.uswheat.org/wp-content/uploads/sharing-way-of-life-header-2021.jpg 1025 2284 Amanda Spoo https://www.uswheat.org/wp-content/uploads/USW-Logo-Full-Color.png Amanda Spoo2022-06-23 14:20:122022-06-23 14:24:57How to Follow the U.S. Wheat Harvest by Class and State

Stay up to date on wheat industry news!

SUBSCRIBE

Think Farm Export Programs Don’t Matter? Think Again.

GET THE REST OF THE STORY

Our Story

  • About USW
  • Dependable People. Reliable Wheat.
  • Board of Directors
  • Staff Directory
  • Office Locations

Market Information

  • Market Information
  • Price Reports
  • Price Charting Tools
  • Supply and Demand
  • Commercial Sales

Crop Quality

  • Crop Quality
  • Harvest Reports
  • Hard Red Winter
  • Hard Red Spring
  • Hard White
  • Soft White
  • Soft Red Winter
  • Durum

Working with Buyers

  • Working With Buyers
  • Customer Conferences
  • Wheat Classes
  • Wheat Glossary
  • Wheat Grade Factors
  • How to Buy
  • Ask the Expert
  • Resources

Who We Represent

  • Who We Represent
  • Board Meetings
  • State Wheat Commissions
  • Partners
  • Trade Activities

Policy

  • Policy
  • Trade Negotiations
  • Trade Barriers
  • Innovation and Sustainability
  • Food Security and Assistance
  • Public-Private Partnership

News

  • Newsroom
  • Wheat Letter Blog
  • News Releases
  • Videos

DTN Wheat Detail
DTN Corn Detail

2008-2013 U.S. Wheat Associates. All Rights Reserved
Privacy Policy | Non-Discrimination Statement

Scroll to top