The 2019 Soft White Crop Shines Again
Pacific Northwest (PNW) farmers produced another fine soft white wheat (SW) and white club (WC) crop with good test weight and very acceptable finished product characteristics for 2019. Adequate soil moisture at planting and throughout the growing season did contribute to higher moisture and protein content compared to 2018 but protein remained lower than the 5-year average. In fact, the higher SW protein segment provides opportunities in blends for crackers, Asian noodles, steamed breads, flat breads, and pan breads. Variations in performance data for 2019 compared to 2018 and the 5-year averages are included below for this 6.09 million metric ton (MMT) crop, including 170,000 MT of WC.
That is a summary of results from the U.S. Wheat Associates (USW) 2019 SW and WC crop quality analysis to be posted soon at https://www.uswheat.org/market-and-crop-information/crop-quality/. To complete the analysis, the Wheat Marketing Center (WMC) received and tested SW and WC samples from Idaho, Oregon, and Washington. The Federal Grain Inspection Service (FGIS) graded and ran wheat protein on each sample. WMC conducted wheat, flour, Solvent Retention Capacity (SRC), dough, and finished product tests on composites based on production zones and protein levels. Funding for the annual survey come from state wheat commission USW members and the USDA Foreign Agricultural Service.
As always, buyers are encouraged to review their quality specifications to ensure that their purchases meet their expectations.
Wheat and Grade Data: The Overall average grade of the 2019 SW and WC crops is U.S. No. 1. The average SW test weight of 61.6 lb/bu (81.0 kg/hl) is slightly lower than last year’s 61.7 lb/bu (81.1 kg/hl); WC test weight of 60.6 lb/bu (79.7 kg/hl) is slightly higher than 2018’s 60.4 lb/bu (79.5 kg/hl). SW has fewer damaged kernels, fewer shrunken and broken kernels, and less foreign material than the 5-year averages. WC shrunken and broken kernel percentages are lower than last year and the 5-year averages. WC foreign material is higher than last year and 5-year averages. WC dockage is slightly higher than last year and the 5-year averages. Other WC grade factors are similar to past averages. Wheat moisture for both SW and WC is above last year and the 5-year averages.
The Overall SW and WC wheat protein content (12% mb) of 10.0 and 9.8%, respectively, are 0.7 and 0.8 percentage points above the respective 2018 values, but below those of 5-year averages. SW and WC wheat ash contents (14% moisture basis) are similar to last year and the 5-year averages. Thousand kernel weight for SW is above 2018 and the 5-year average levels; WC is lower than last year and higher than the 5-year average. SW kernel diameter is the same as last year, but larger than the 5-year average. WC kernel diameter is smaller than last year, but larger than the 5-year average. Falling number values are 317 sec for SW and 355 sec for WC.
Flour, Dough, and Bake Data: The 2019 Buhler Laboratory Mill flour extraction average for SW and WC at 72.1% and 72.8% respectively are lower than last year and the 5-year averages. Flour protein content (14% mb) is 8.9% for both SW and WC. Flour ash content (14% mb) for both SW and WC are higher than last year but the same as 5-year averages. Amylograph peak viscosity value for SW is 485 BU, slightly lower than last year; WC is 523 BU, much higher than last year. Starch damage value is slightly higher for SW than last year but lower than the 5-year averages. WC starch damage is lower than last year and the 5-year averages.
Solvent retention capacity (SRC) water values for SW and WC are less than last year and 5-year averages. SW lactic acid and sodium carbonate values are similar to last year and the 5-year averages. WC lactic acid values are higher than last year, but same as 5-year average. SW and WC gluten performance index (GPI) values are similar to last year and 5-year averages. SW farinograph peak and stability times are shorter than last year and the 5-year averages. WC peak time is slightly longer than last year and 5-year averages. SW and WC water absorptions are similar to last year, but less than the 5-year averages. The SW and WC alveograph L values are considerably longer than last year and 5-year averages. SW and WC extensograph resistance is larger than last year and the 5-year averages. SW and WC extensibility values are longer than last year and the 5-year averages.
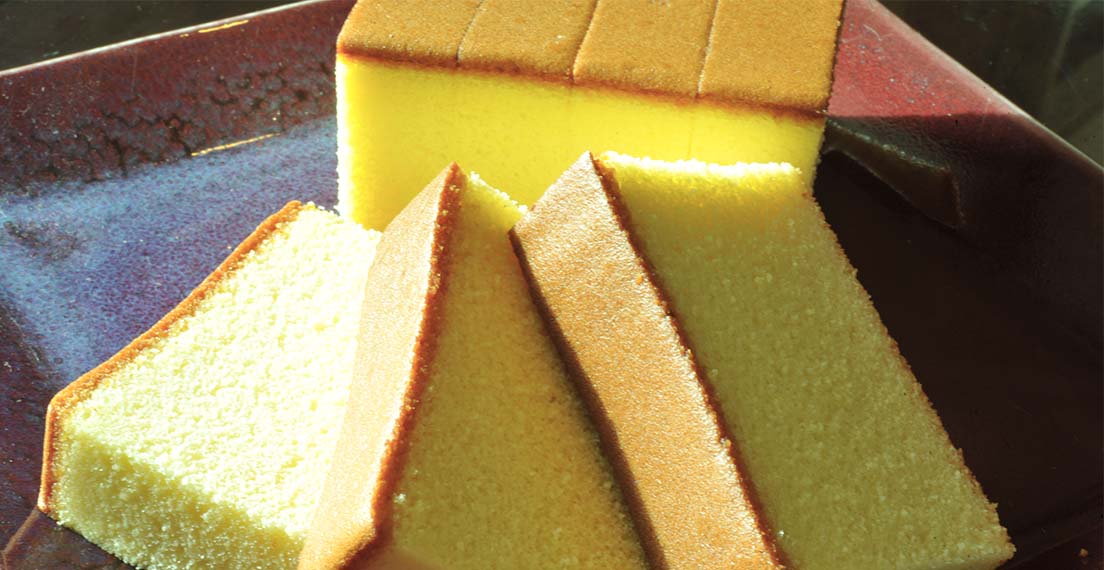
Sponge cake volume for SW at 1104 cc is larger than last year, but smaller than the 5-year average, and the total score is slightly lower than last year and the 5-year averages. The sponge cake volume for WC at 1141 cc is slightly larger than last year, but smaller than the 5-year average, and total score the same as last year and much higher than the 5-year averages. SW and WC cookie diameter values are smaller than last year, but similar to the 5-year averages. SW and WC cookie spread factors are more than last year and the 5-year averages.
Chinese Southern-Type Steamed Bread: In southern-type steamed bread compared to a control flour, the 2019 SW and WC specific volumes are slightly less than last year and the 5-year averages. The SW total score is higher than last year and the 5-year averages; WC is the same as last year, but lower than the 5-year average.


