By Stephanie Bryant-Erdmann, USW Market Analyst
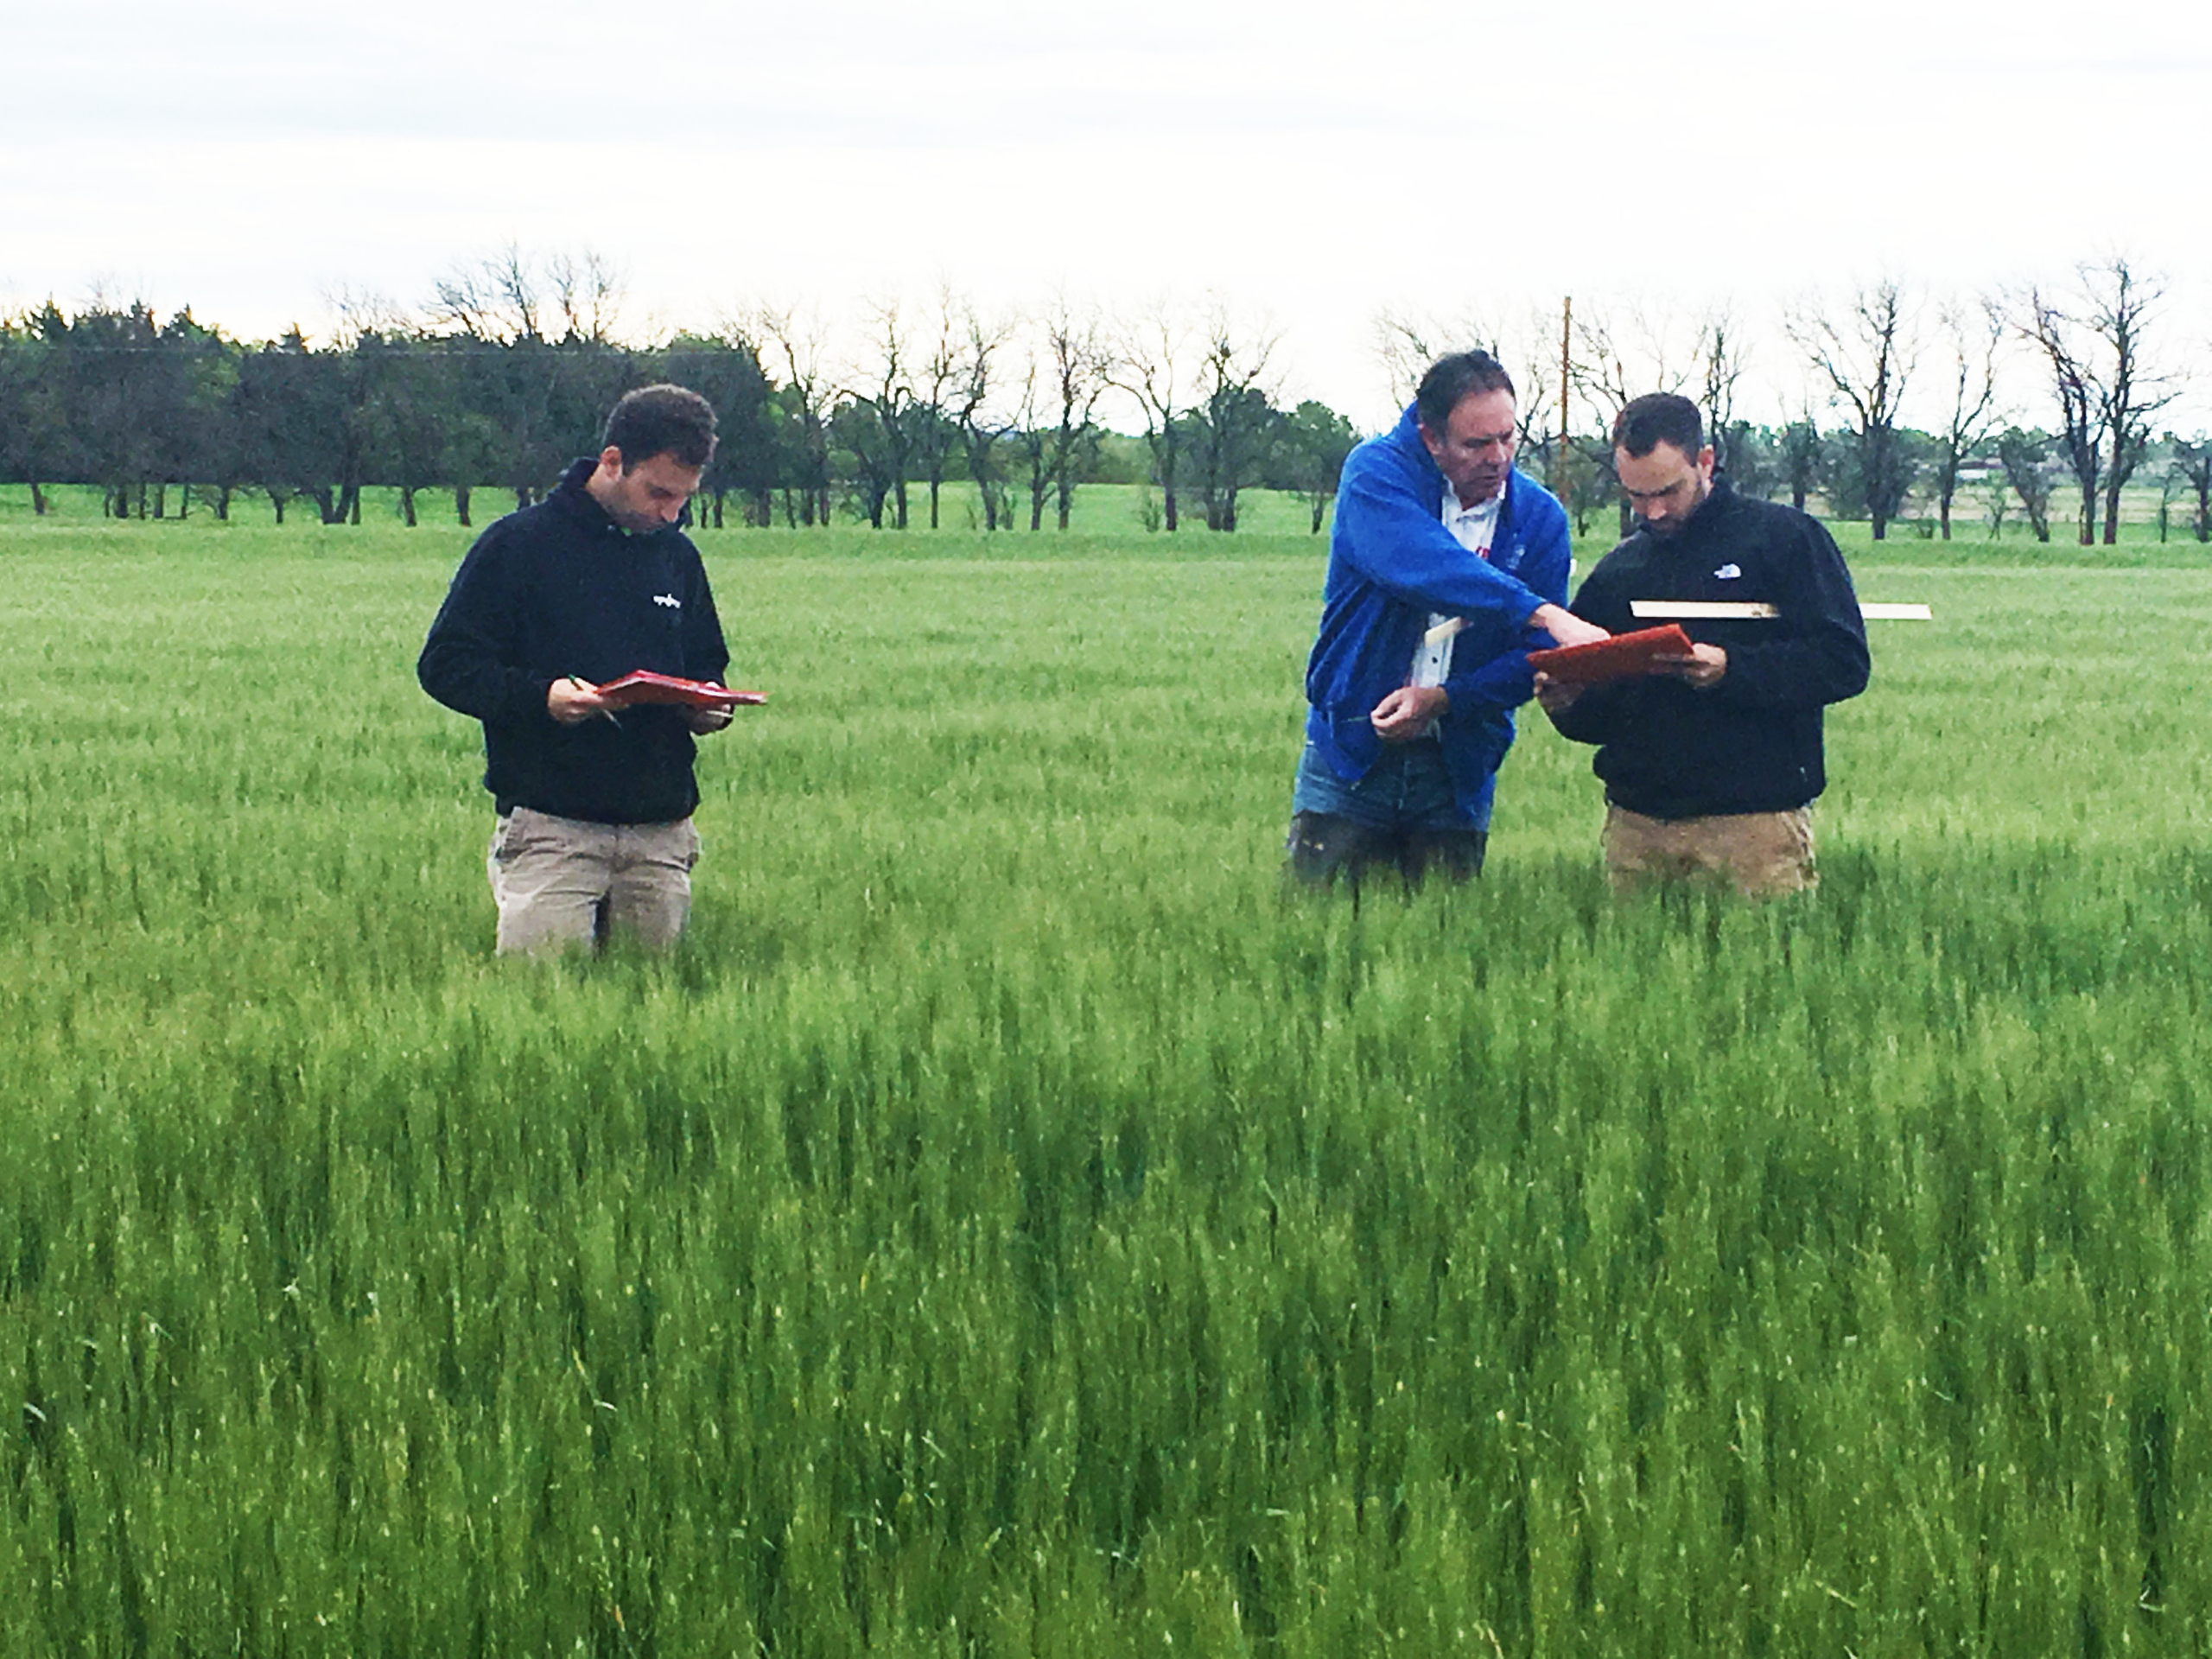
This week I joined the annual Wheat Quality Council (WQC) “Hard Red Wheat Tour” for an early survey of the new crop. Each year, participants gather in Manhattan, KS, and spend the next two and a half days in small team, randomly stopping at 14, 15 or more fields in a full day along the same routes followed for many years. The scout teams measure yield potential, determine an average for the route and estimate a cumulative average for the day when all the scouts come together in the evening.
Just a few hours before USW published this issue of “Wheat Letter,” the tour estimated a final average yield potential of 46.1 bushels per acre (bu/ac) or about 3.10 metric tons per hectare for the 2017/18 Kansas hard red winter (HRW) crop. This year the tour participants made 469 stops to scout fields. Combining seeded area with per-acre yield potential, the total production potential estimate was 282.0 million bushels (7.67 million MT). Last year’s total production estimate was 382.4 million bushels (10.4 MMT). Sampling this year was skewed toward central and eastern Kansas due to difficulties sampling in the west.
On the first day, the tour traveled from Manhattan along several routes covering most northern Kansas counties. The cumulative Day 1 average yield potential was 43.0 bu/ac, which is equivalent to about 2.89 MT per hectare, compared to 47.1 bu/ac (3.16 MT per hectare) in 2016. To reach that average, participants surveyed 222 fields recording a range from a low of 18 bu/ac to a high of 96 bu/ac. We saw moderate pressure from stripe rust, a fungal disease, as well as viral diseases wheat streak mosaic and barley yellow dwarf. Many farmers were having fungicide applied by air to protect against fungal diseases, but there is no input to check viral disease.
Participants also received a report on the Nebraska and Colorado wheat crops. Nebraska estimated an average 40.0 bu/ac (2.69 MT per hectare) for a total production estimate of 41.8 million bushels (1.14 MMT), down roughly 41 percent from last year’s tour estimate. Colorado estimated an average of 31.6 bu/ac (2.12 MT per hectare) with total production estimated at 69.5 million bushels.
On the second day, the tour traveled on routes that led from the city of Colby to Wichita, making 202 stops. The number of observations was down significantly this year due to the challenging field conditions found in the western third of the state where wet, heavy snow continued to blanket wheat fields. After digging the wheat out of the snow, scouts noted the combination of heavy snow and accompanying 50 to 60 mile per hour winds had laid substantial portions of the wheat down and in some instances had broken the wheat stems. Wheat that was knocked over by the heavy snow, then endured several days of cold temperatures.
Standing water in fields and flooded ditches made field evaluation difficult in the south central part of the state where lodging and some freeze damage was also noted. Wheat streak mosaic was prevalent on Day 2, and participants reported seeing barley yellow dwarf, leaf rust and stripe rust. This year the tour estimated Day 2 average yield at 46.9 bu/ac (3.15 MT per hectare), for a combined two-day average of 44.9 bu/ac (3.02 MT per hectare) across 427 stops. Last year, the Day 2 average was 49.3 bu/ac (3.31 MT per hectare) and the combined two-day average was 48.2 bu/ac (3.24 MT per hectare).
A word of caution to our overseas customers is prudent. The wind, snow and cold events this year are unprecedented. Participants in the tour did the best they could to evaluate the western Kansas crop, but Dr. Romulo Lollato, Assistant Professor, Wheat and Forages Production, Kansas State University told us the most accurate assessment of the storm and freeze will not be possible for 10 to 14 days after each event. “High Plains Journal” magazine is reporting from the Tour and provides more details on Day 2 activities here. Kansas Wheat published additional information here.
Participants also received a crop report from Oklahoma, where drought conditions severely impacted the southern half of the state which received one inch (2.5 cm) of rain between September and mid-February. The northern half of the state benefited from the recent rainfall. The estimated average yield in Oklahoma is 33.7 bu/ac (2.26 MT per hectare), for a total production estimate of 100 million bushels or about 2.72 MMT. If realized, that would be down 27 percent year over year. The crop development is well ahead of normal with farmers expecting to start harvest in the next three weeks.
The third and final day of the tour was shorter, with each car making 3 to 4 field stops on the way from Wichita back to Manhattan for the final report. The Day 3 estimated average yield was 58.3 bu/ac, (3.92 MT per hectare) across 49 stops.
View highlights and photos from the tour by searching #wheattour17 on Facebook and Twitter. The WQC also sponsors a spring wheat tour in the Northern Plains in July. For more information, visit the Council’s web site at https://www.wheatqualitycouncil.org.